Australia Non-leather Products Market (2026-2032) | Analysis, Share, Trends, Segmentation, Forecast, Companies, Growth, Industry, Competitive Landscape, Outlook, Size & Revenue, Value
Market Forecast By Product (Footwear, Luggage Bags, Handbags and Wallets, Belts, Others) And Competitive Landscape
| Product Code: ETC6186391 | Publication Date: Sep 2024 | Updated Date: Mar 2026 | Product Type: Market Research Report | |
| Publisher: 6Wresearch | Author: Shubham Deep | No. of Pages: 75 | No. of Figures: 35 | No. of Tables: 20 |
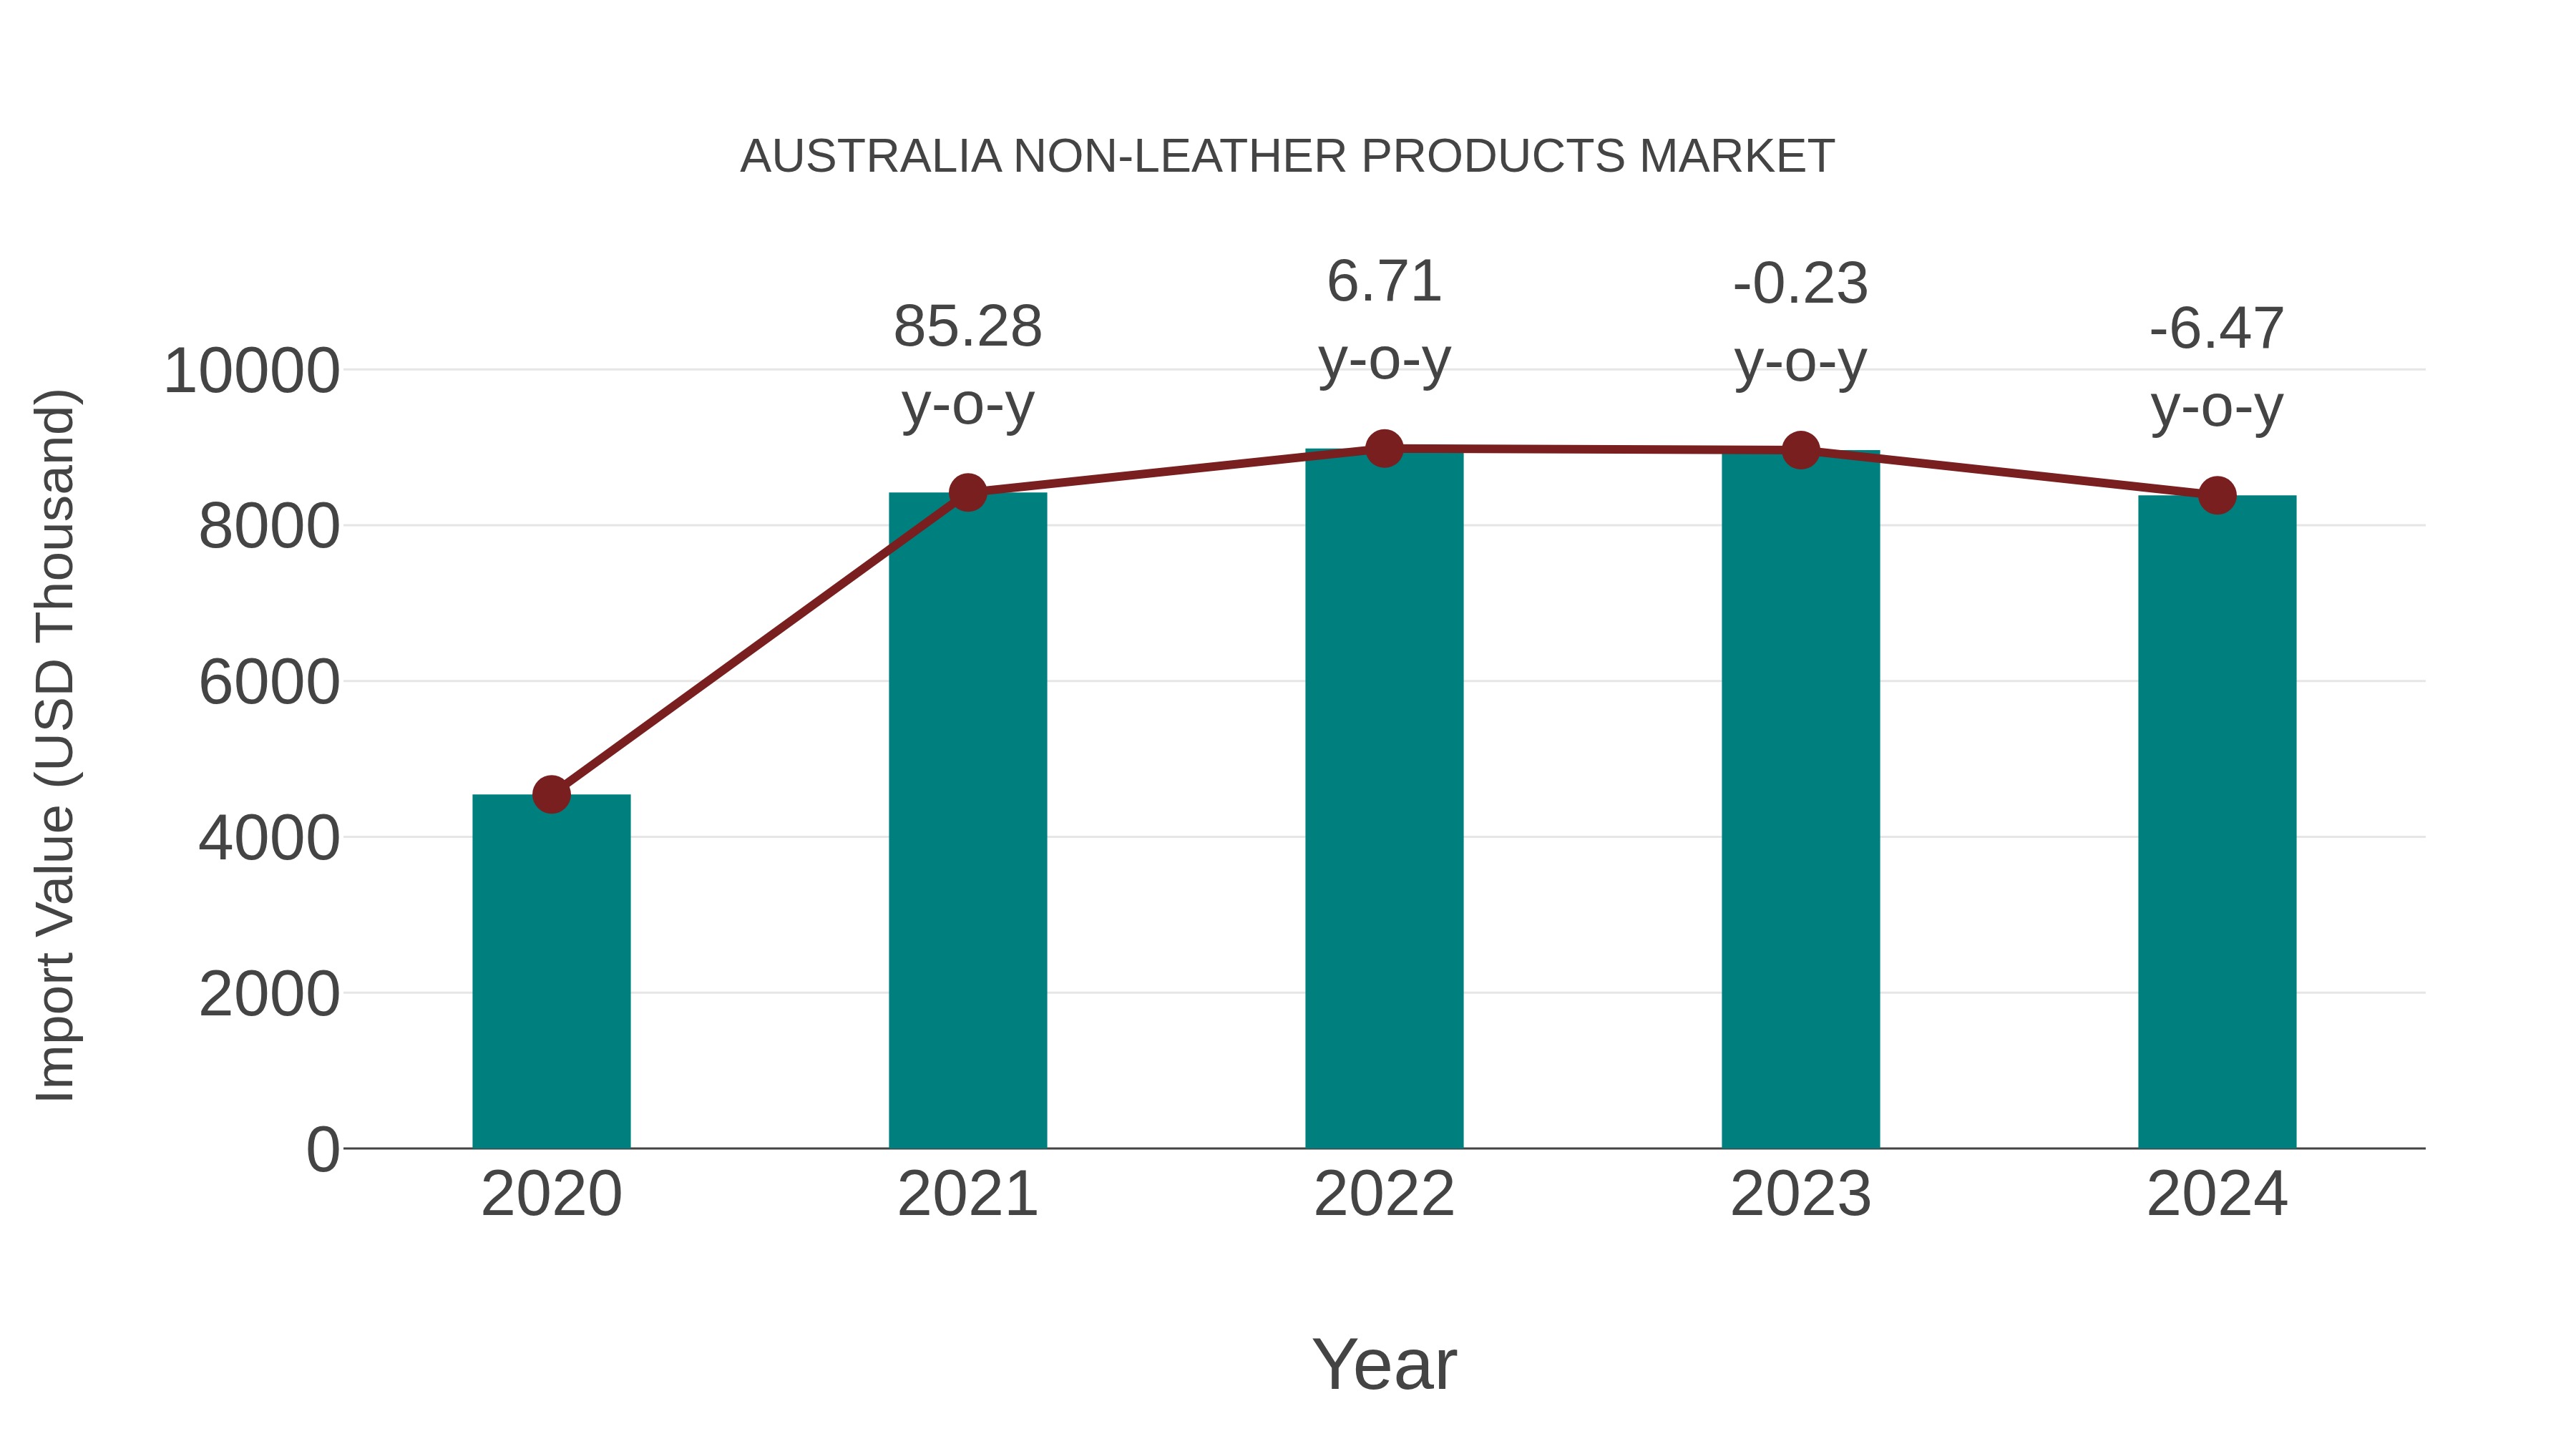
Australia Non-leather Products Market: Import Trend Analysis
In the Australia non-leather products market, the import trend experienced a decline from 2023 to 2024, with a growth rate of -6.47%. However, the compound annual growth rate (CAGR) for the period of 2020-2024 stood at 16.54%. This shift could be attributed to changing consumer preferences or adjustments in trade policies impacting import momentum.
Australia Non Leather Products Market Overview
The non-leather products market in Australia is expanding due to growing demand for sustainable and animal-free alternatives. Materials such as synthetic leather, plant-based leather, and recycled fabrics are gaining popularity in fashion, automotive, and furniture industries.
Drivers of the market
The non-leather products market in Australia is driven by increasing consumer demand for vegan and cruelty-free alternatives. Growing adoption of synthetic and plant-based leather in footwear, apparel, and accessories, along with increasing awareness about sustainable fashion, is fueling market growth.
Challenges of the market
The non-leather products market in Australia faces challenges from high production costs and limited consumer awareness. Regulatory requirements for product quality and environmental safety increase operational complexity. Competition from traditional leather products and limited availability of synthetic raw materials reduce market penetration. High transportation costs and slow adoption rates further restrict market growth.
Investment opportunities in the Market
The non-leather products market in Australia is expanding due to increasing demand for sustainable and cruelty-free fashion alternatives. Investment opportunities lie in developing plant-based and synthetic leather alternatives, improving product durability, and expanding retail partnerships. Growth in veganism and sustainability trends is driving market expansion.
Government Policy of the market
Non-leather products are subject to trade and import regulations under the Department of Industry, Science and Resources. The government promotes the use of sustainable materials and eco-friendly manufacturing practices through grants and tax incentives. Labeling requirements ensure transparency in product composition and environmental impact.
Key Highlights of the Report:
- Australia Non-leather Products Market Outlook
- Market Size of Australia Non-leather Products Market, 2025
- Forecast of Australia Non-leather Products Market, 2032
- Historical Data and Forecast of Australia Non-leather Products Revenues & Volume for the Period 2022 - 2032F
- Australia Non-leather Products Market Trend Evolution
- Australia Non-leather Products Market Drivers and Challenges
- Australia Non-leather Products Price Trends
- Australia Non-leather Products Porter's Five Forces
- Australia Non-leather Products Industry Life Cycle
- Historical Data and Forecast of Australia Non-leather Products Market Revenues & Volume By Product for the Period 2022 - 2032F
- Historical Data and Forecast of Australia Non-leather Products Market Revenues & Volume By Footwear for the Period 2022 - 2032F
- Historical Data and Forecast of Australia Non-leather Products Market Revenues & Volume By Luggage Bags for the Period 2022 - 2032F
- Historical Data and Forecast of Australia Non-leather Products Market Revenues & Volume By Handbags and Wallets for the Period 2022 - 2032F
- Historical Data and Forecast of Australia Non-leather Products Market Revenues & Volume By Belts for the Period 2022 - 2032F
- Historical Data and Forecast of Australia Non-leather Products Market Revenues & Volume By Others for the Period 2022 - 2032F
- Australia Non-leather Products Import Export Trade Statistics
- Market Opportunity Assessment By Product
- Australia Non-leather Products Top Companies Market Share
- Australia Non-leather Products Competitive Benchmarking By Technical and Operational Parameters
- Australia Non-leather Products Company Profiles
- Australia Non-leather Products Key Strategic Recommendations
Australia Non-leather Products Market (2026-2032): FAQs
6Wresearch actively monitors the Australia Non-leather Products Market and publishes its comprehensive annual report, highlighting emerging trends, growth drivers, revenue analysis, and forecast outlook. Our insights help businesses to make data-backed strategic decisions with ongoing market dynamics. Our analysts track relevent industries related to the Australia Non-leather Products Market, allowing our clients with actionable intelligence and reliable forecasts tailored to emerging regional needs.
Yes, we provide customisation as per your requirements. To learn more, feel free to contact us on sales@6wresearch.com
1 Executive Summary |
2 Introduction |
2.1 Key Highlights of the Report |
2.2 Report Description |
2.3 Market Scope & Segmentation |
2.4 Research Methodology |
2.5 Assumptions |
3 Australia Non-leather Products Market Overview |
3.1 Australia Country Macro Economic Indicators |
3.2 Australia Non-leather Products Market Revenues & Volume, 2022 & 2032F |
3.3 Australia Non-leather Products Market - Industry Life Cycle |
3.4 Australia Non-leather Products Market - Porter's Five Forces |
3.5 Australia Non-leather Products Market Revenues & Volume Share, By Product, 2022 & 2032F |
4 Australia Non-leather Products Market Dynamics |
4.1 Impact Analysis |
4.2 Market Drivers |
4.2.1 Increasing consumer awareness about sustainability and ethical practices in the fashion industry |
4.2.2 Growing preference for cruelty-free and eco-friendly products |
4.2.3 Rising demand for innovative non-leather materials in the market |
4.3 Market Restraints |
4.3.1 High production costs associated with non-leather materials |
4.3.2 Limited availability of advanced non-leather substitutes compared to traditional leather |
4.3.3 Lack of standardization in quality and performance of non-leather products |
5 Australia Non-leather Products Market Trends |
6 Australia Non-leather Products Market, By Types |
6.1 Australia Non-leather Products Market, By Product |
6.1.1 Overview and Analysis |
6.1.2 Australia Non-leather Products Market Revenues & Volume, By Product, 2022 - 2032F |
6.1.3 Australia Non-leather Products Market Revenues & Volume, By Footwear, 2022 - 2032F |
6.1.4 Australia Non-leather Products Market Revenues & Volume, By Luggage Bags, 2022 - 2032F |
6.1.5 Australia Non-leather Products Market Revenues & Volume, By Handbags and Wallets, 2022 - 2032F |
6.1.6 Australia Non-leather Products Market Revenues & Volume, By Belts, 2022 - 2032F |
6.1.7 Australia Non-leather Products Market Revenues & Volume, By Others, 2022 - 2032F |
7 Australia Non-leather Products Market Import-Export Trade Statistics |
7.1 Australia Non-leather Products Market Export to Major Countries |
7.2 Australia Non-leather Products Market Imports from Major Countries |
8 Australia Non-leather Products Market Key Performance Indicators |
8.1 Percentage of consumers choosing non-leather products over traditional leather products |
8.2 Adoption rate of new non-leather materials in the fashion industry |
8.3 Number of partnerships between non-leather product manufacturers and sustainable fashion brands |
8.4 Growth in the number of retailers offering a wide range of non-leather products |
8.5 Number of research and development initiatives focused on enhancing non-leather material quality and performance |
9 Australia Non-leather Products Market - Opportunity Assessment |
9.1 Australia Non-leather Products Market Opportunity Assessment, By Product, 2022 & 2032F |
10 Australia Non-leather Products Market - Competitive Landscape |
10.1 Australia Non-leather Products Market Revenue Share, By Companies, 2025 |
10.2 Australia Non-leather Products Market Competitive Benchmarking, By Operating and Technical Parameters |
11 Company Profiles |
12 Recommendations |
13 Disclaimer |
Export potential assessment - trade Analytics for 2030
Export potential enables firms to identify high-growth global markets with greater confidence by combining advanced trade intelligence with a structured quantitative methodology. The framework analyzes emerging demand trends and country-level import patterns while integrating macroeconomic and trade datasets such as GDP and population forecasts, bilateral import–export flows, tariff structures, elasticity differentials between developed and developing economies, geographic distance, and import demand projections. Using weighted trade values from 2020–2024 as the base period to project country-to-country export potential for 2030, these inputs are operationalized through calculated drivers such as gravity model parameters, tariff impact factors, and projected GDP per-capita growth. Through an analysis of hidden potentials, demand hotspots, and market conditions that are most favorable to success, this method enables firms to focus on target countries, maximize returns, and global expansion with data, backed by accuracy.
By factoring in the projected importer demand gap that is currently unmet and could be potential opportunity, it identifies the potential for the Exporter (Country) among 190 countries, against the general trade analysis, which identifies the biggest importer or exporter.
To discover high-growth global markets and optimize your business strategy:
Click Here
Pricing
- Single User License$ 1,995
- Department License$ 2,400
- Site License$ 3,120
- Global License$ 3,795

Search
Thought Leadership and Analyst Meet


Our Clients
Latest Reports
- United Kingdom (UK) Long-term Care Insurance Market (2026-2032) | Growth, Share, Consumer Insights, Drivers, Opportunities, Competition, Pricing Analysis, Segments, Restraints, Companies, Competitive, Value, Outlook, Size, Demand, Analysis, Challenges, Strategic Insights, Investment Trends, Revenue, Trends, Supply, Forecast
- United Kingdom (UK) Long Term Care Market (2026-2032) | Companies, Outlook, Analysis, Trends, Value, Revenue, Segmentation, Share, Forecast, Competitive Landscape, Growth, Size & Forecast
- Iraq Insulation and Waterproofing Market (2026-2032) | Outlook, Drivers, Growth, Size, Share, Industry, Revenue, Trends, Demand, Competitive, Strategic Insights, Opportunities, Segments, Companies, Challenges, Strategy, Consumer Insights, Analysis, Investment Trends, Value, Segmentation, Forecast, Restraints
- India Switchgear Market Outlook (2026 - 2032) | Size, Share, Trends, Growth, Revenue, Forecast, Analysis, Value, Outlook
- Pakistan Contraceptive Implants Market (2025-2031) | Demand, Growth, Size, Share, Industry, Pricing Analysis, Competitive, Strategic Insights, Strategy, Consumer Insights, Analysis, Investment Trends, Opportunities, Revenue, Segments, Value, Segmentation, Supply, Forecast, Restraints, Outlook, Competition, Drivers, Trends, Companies, Challenges
- Sri Lanka Packaging Market (2026-2032) | Outlook, Competition, Drivers, Trends, Demand, Pricing Analysis, Competitive, Strategic Insights, Companies, Challenges, Strategy, Consumer Insights, Analysis, Investment Trends, Opportunities, Growth, Size, Share, Industry, Revenue, Segments, Value, Segmentation, Supply, Forecast, Restraints
- India Kids Watches Market (2026-2032) | Strategy, Consumer Insights, Analysis, Investment Trends, Opportunities, Growth, Size, Share, Industry, Revenue, Segments, Value, Segmentation, Supply, Forecast, Restraints, Outlook, Competition, Drivers, Trends, Demand, Pricing Analysis, Competitive, Strategic Insights, Companies, Challenges
- Saudi Arabia Core Assurance Service Market (2025-2031) | Strategy, Consumer Insights, Analysis, Investment Trends, Opportunities, Growth, Size, Share, Industry, Revenue, Segments, Value, Segmentation, Supply, Forecast, Restraints, Outlook, Competition, Drivers, Trends, Demand, Pricing Analysis, Competitive, Strategic Insights, Companies, Challenges
- Romania Uninterruptible Power Supply (UPS) Market (2026-2032) | Industry, Analysis, Revenue, Size, Forecast, Outlook, Value, Trends, Share, Growth & Companies
- Saudi Arabia Car Window Tinting Film, Paint Protection Film (PPF), and Ceramic Coating Market (2025-2031) | Strategy, Consumer Insights, Analysis, Investment Trends, Opportunities, Growth, Size, Share, Industry, Revenue, Segments, Value, Segmentation, Supply, Forecast, Restraints, Outlook, Competition, Drivers, Trends, Demand, Pricing Analysis, Competitive, Strategic Insights, Companies, Challenges
Industry Events and Analyst Meet

India EV Show 2026

EV tech India Expo 2026

Auto Tech Asia 2026

Battery Tech India 2026

Smart Production Solutions Guangzhou 2026
Whitepaper
- Middle East & Africa Commercial Security Market Click here to view more.
- Middle East & Africa Fire Safety Systems & Equipment Market Click here to view more.
- GCC Drone Market Click here to view more.
- Middle East Lighting Fixture Market Click here to view more.
- GCC Physical & Perimeter Security Market Click here to view more.
6WResearch In News
- Doha a strategic location for EV manufacturing hub: IPA Qatar
- Demand for luxury TVs surging in the GCC, says Samsung
- Empowering Growth: The Thriving Journey of Bangladesh’s Cable Industry
- Demand for luxury TVs surging in the GCC, says Samsung
- Video call with a traditional healer? Once unthinkable, it’s now common in South Africa
- Intelligent Buildings To Smooth GCC’s Path To Net Zero