Australia Non-Meat Ingredients Market (2026-2032) Outlook | Companies, Analysis, Share, Size, Forecast, Revenue, Value, Industry, Trends & Growth
Market Forecast By Ingredient (Binders, Extenders, Fillers, Coloring & Flavoring Agents, Salts & Preservatives), By Type (Beef, Pork, Mutton, Poultry), By Source (Chemical substances, Plant origin, Animal origin), By Product Type (Fresh Processed Meat, Raw-Cooked Meat, Pre-Cooked Meat, Raw Fermented Sausages, Cured Meat, Dried Meat) And Competitive Landscape
| Product Code: ETC4537716 | Publication Date: Jul 2023 | Updated Date: Mar 2026 | Product Type: Report | |
| Publisher: 6Wresearch | Author: Summon Dutta | No. of Pages: 85 | No. of Figures: 45 | No. of Tables: 25 |
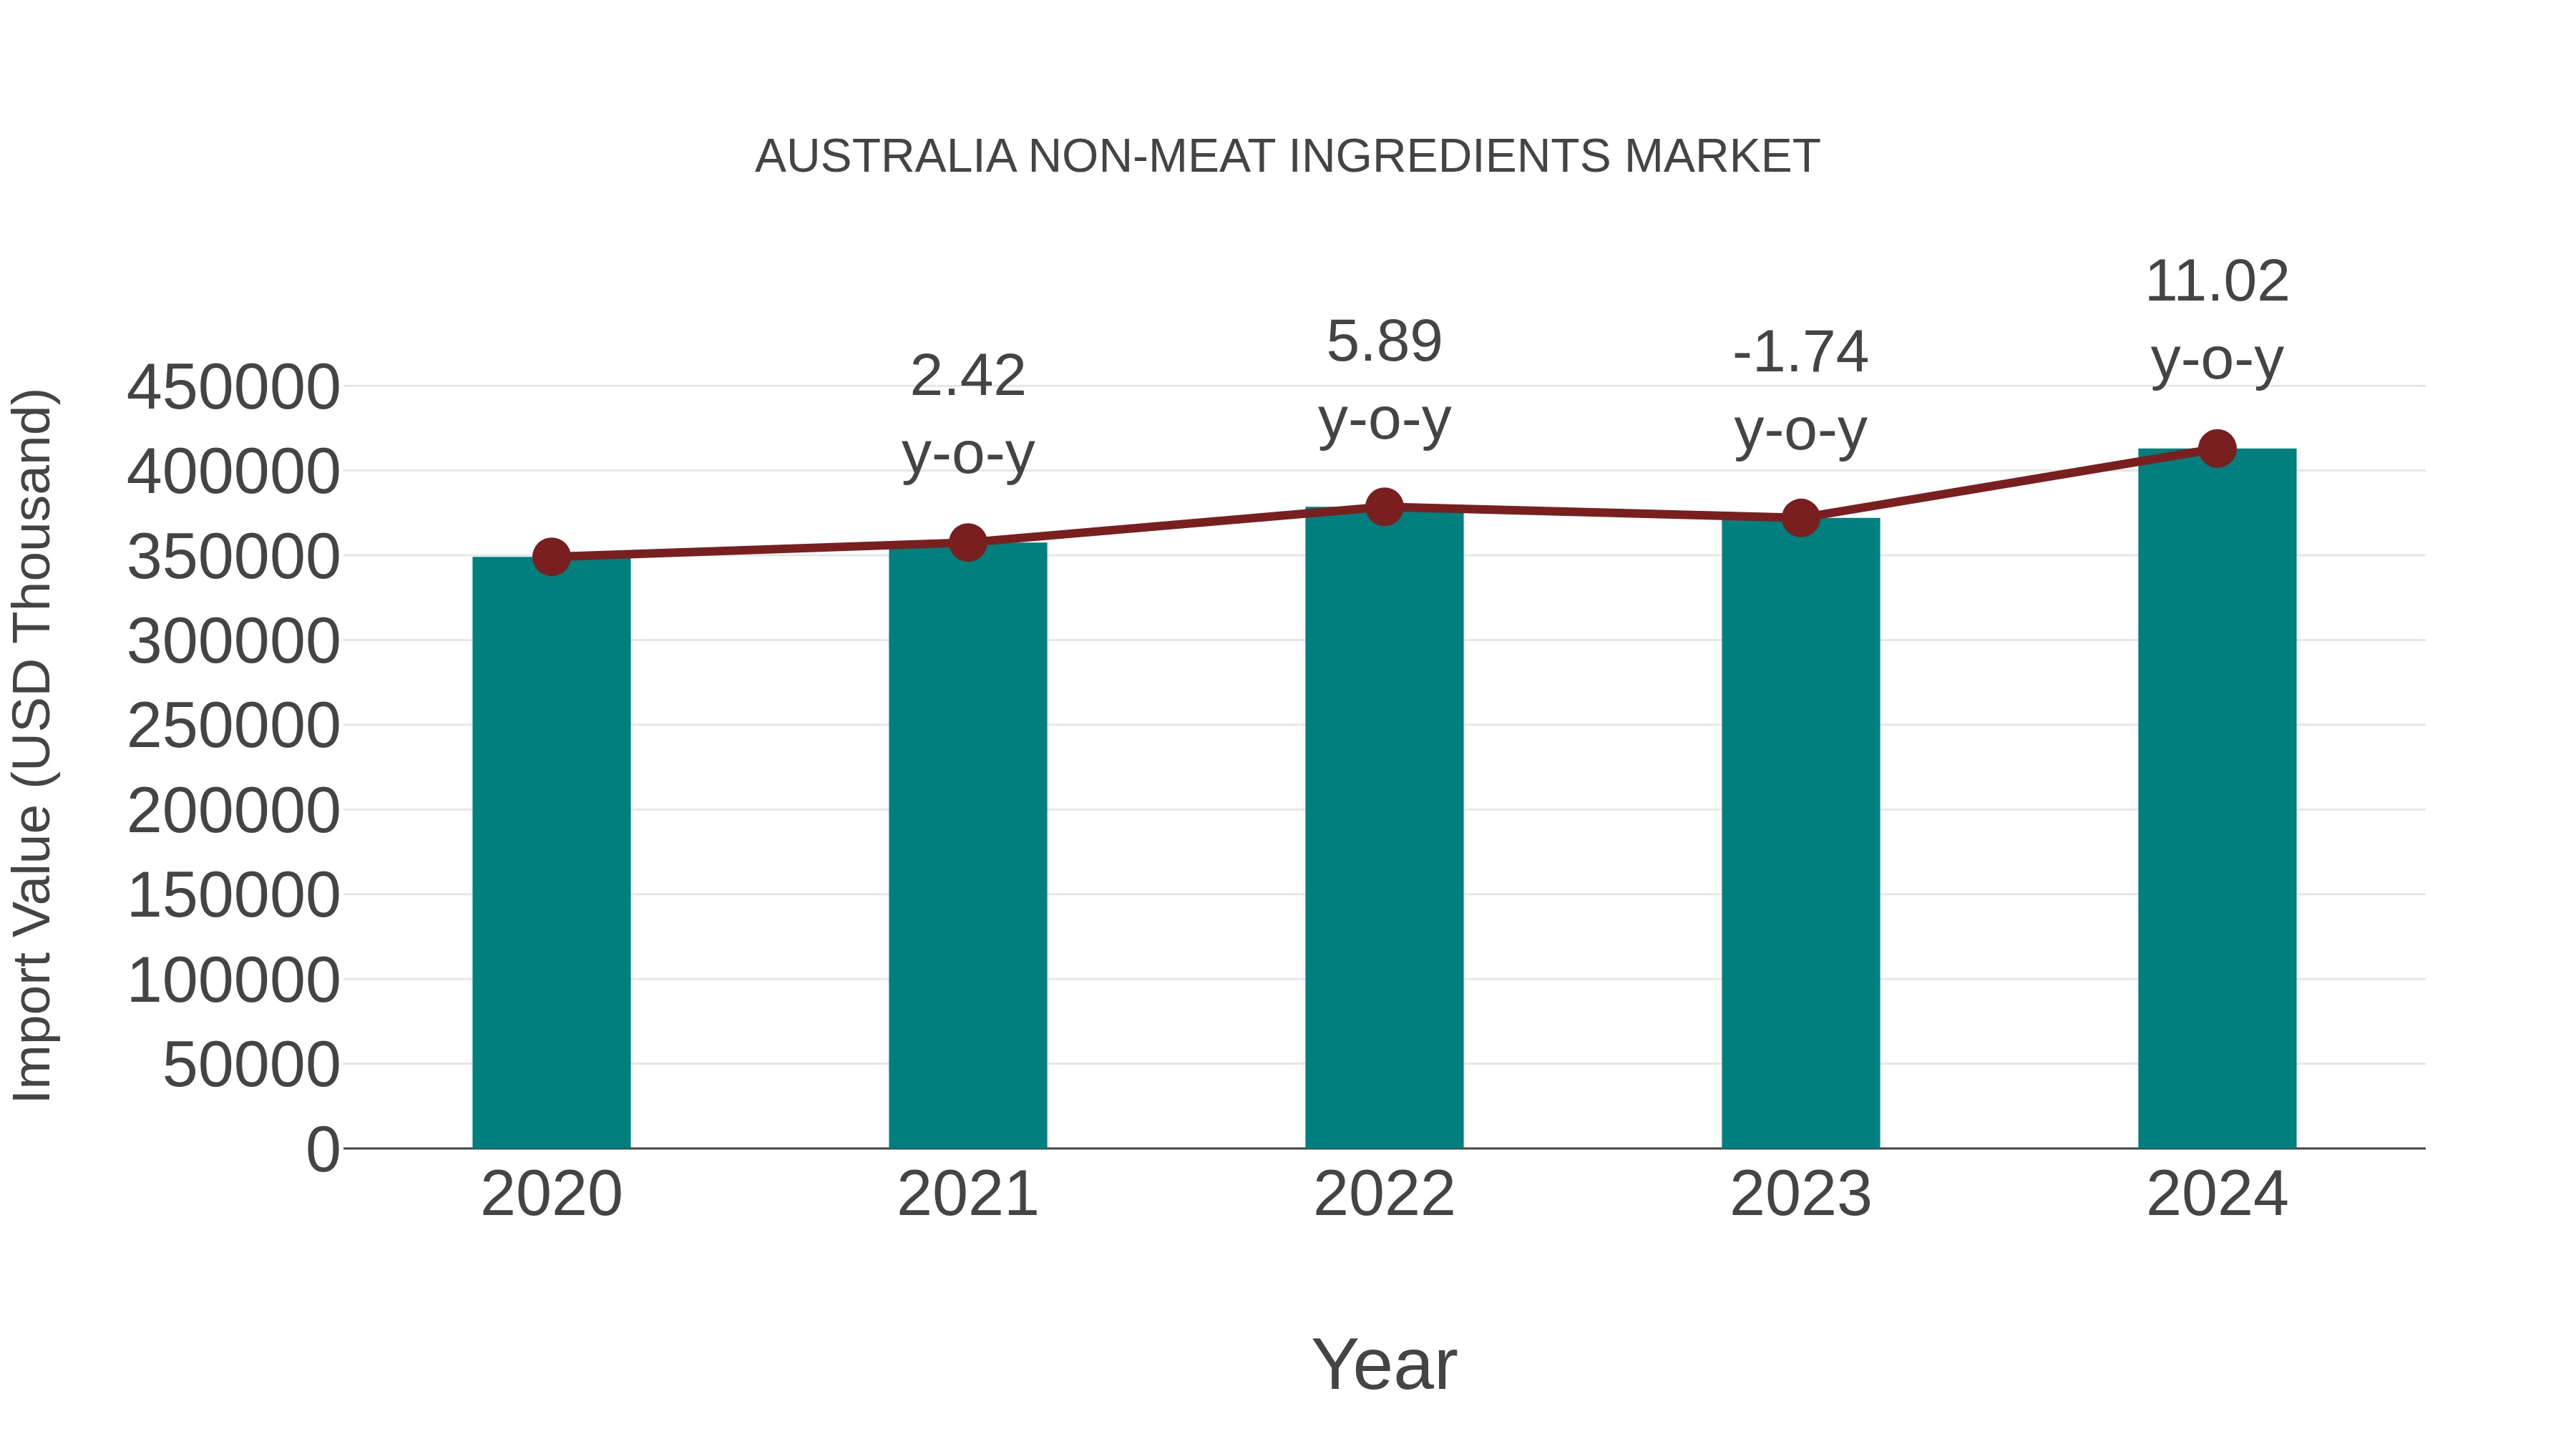
Australia Non-meat Ingredients Market: Import Trend Analysis
In the Australia non-meat ingredients market, the import trend showed a notable growth rate of 11.02% from 2023 to 2024. The compound annual growth rate (CAGR) for the period 2020-2024 stood at 4.29%. This import momentum can be attributed to a shifting demand landscape, potentially influenced by evolving consumer preferences or changes in trade policies impacting market dynamics.
Australia Non Meat Ingredients Market Overview
The non-meat ingredients market in Australia is growing due to increasing demand for plant-based and alternative protein products. Non-meat ingredients, including soy, wheat, and pea proteins, are used to create texture and flavor in meat substitutes. The rise in vegan and vegetarian diets is driving market growth.
Drivers of the market
The Australia Non-Meat Ingredients Market is driven by the increasing demand for plant-based and alternative protein products. Non-meat ingredients, including soy protein, wheat gluten, and pea protein, are used in the formulation of meat substitutes and hybrid products. Growing consumer interest in sustainable and ethical food choices and rising investment in alternative protein production are fueling market demand. Technological advancements in ingredient processing and formulation are further enhancing market potential.
Challenges of the market
The non-meat ingredients market in Australia is constrained by high production and storage costs. Dependence on imports increases supply chain risks. Regulatory requirements for food safety and ingredient labeling increase compliance complexity. Competition from plant-based meat alternatives pressures market growth.
Investment opportunities in the Market
The Australia Non-Meat Ingredients Market offers significant growth potential due to increasing demand for plant-based and alternative meat products. Investment opportunities include developing flavor enhancers, texture modifiers, and binding agents for meat analogs, improving natural preservation and shelf-stability technologies, and expanding into functional plant-based meat alternatives. The rising focus on vegan and vegetarian diets supports market expansion.
Government Policy of the market
The non-meat ingredients market is regulated under FSANZ guidelines for food additives, preservatives, and flavor enhancers. The government promotes the development of plant-based and alternative protein products through research funding and tax incentives. Import regulations ensure that non-meat ingredients meet food safety and quality standards.
Key Highlights of the Report:
- Australia Non-Meat Ingredients Market Outlook
- Market Size of Australia Non-Meat Ingredients Market, 2025
- Forecast of Australia Non-Meat Ingredients Market, 2032
- Historical Data and Forecast of Australia Non-Meat Ingredients Revenues & Volume for the Period 2022-2032F
- Australia Non-Meat Ingredients Market Trend Evolution
- Australia Non-Meat Ingredients Market Drivers and Challenges
- Australia Non-Meat Ingredients Price Trends
- Australia Non-Meat Ingredients Porter's Five Forces
- Australia Non-Meat Ingredients Industry Life Cycle
- Historical Data and Forecast of Australia Non-Meat Ingredients Market Revenues & Volume By Ingredient for the Period 2022-2032F
- Historical Data and Forecast of Australia Non-Meat Ingredients Market Revenues & Volume By Binders for the Period 2022-2032F
- Historical Data and Forecast of Australia Non-Meat Ingredients Market Revenues & Volume By Extenders for the Period 2022-2032F
- Historical Data and Forecast of Australia Non-Meat Ingredients Market Revenues & Volume By Fillers for the Period 2022-2032F
- Historical Data and Forecast of Australia Non-Meat Ingredients Market Revenues & Volume By Coloring & Flavoring Agents for the Period 2022-2032F
- Historical Data and Forecast of Australia Non-Meat Ingredients Market Revenues & Volume By Salts & Preservatives for the Period 2022-2032F
- Historical Data and Forecast of Australia Non-Meat Ingredients Market Revenues & Volume By Type for the Period 2022-2032F
- Historical Data and Forecast of Australia Non-Meat Ingredients Market Revenues & Volume By Beef for the Period 2022-2032F
- Historical Data and Forecast of Australia Non-Meat Ingredients Market Revenues & Volume By Pork for the Period 2022-2032F
- Historical Data and Forecast of Australia Non-Meat Ingredients Market Revenues & Volume By Mutton for the Period 2022-2032F
- Historical Data and Forecast of Australia Non-Meat Ingredients Market Revenues & Volume By Poultry for the Period 2022-2032F
- Historical Data and Forecast of Australia Non-Meat Ingredients Market Revenues & Volume By Source for the Period 2022-2032F
- Historical Data and Forecast of Australia Non-Meat Ingredients Market Revenues & Volume By Chemical substances for the Period 2022-2032F
- Historical Data and Forecast of Australia Non-Meat Ingredients Market Revenues & Volume By Plant origin for the Period 2022-2032F
- Historical Data and Forecast of Australia Non-Meat Ingredients Market Revenues & Volume By Animal origin for the Period 2022-2032F
- Historical Data and Forecast of Australia Non-Meat Ingredients Market Revenues & Volume By Product Type for the Period 2022-2032F
- Historical Data and Forecast of Australia Non-Meat Ingredients Market Revenues & Volume By Fresh Processed Meat for the Period 2022-2032F
- Historical Data and Forecast of Australia Non-Meat Ingredients Market Revenues & Volume By Raw-Cooked Meat for the Period 2022-2032F
- Historical Data and Forecast of Australia Non-Meat Ingredients Market Revenues & Volume By Pre-Cooked Meat for the Period 2022-2032F
- Historical Data and Forecast of Australia Non-Meat Ingredients Market Revenues & Volume By Raw Fermented Sausages for the Period 2022-2032F
- Historical Data and Forecast of Australia Non-Meat Ingredients Market Revenues & Volume By Cured Meat for the Period 2022-2032F
- Historical Data and Forecast of Australia Non-Meat Ingredients Market Revenues & Volume By Dried Meat for the Period 2022-2032F
- Australia Non-Meat Ingredients Import Export Trade Statistics
- Market Opportunity Assessment By Ingredient
- Market Opportunity Assessment By Type
- Market Opportunity Assessment By Source
- Market Opportunity Assessment By Product Type
- Australia Non-Meat Ingredients Top Companies Market Share
- Australia Non-Meat Ingredients Competitive Benchmarking By Technical and Operational Parameters
- Australia Non-Meat Ingredients Company Profiles
- Australia Non-Meat Ingredients Key Strategic Recommendations
Australia Non-Meat Ingredients Market (2026-2032): FAQs
6Wresearch actively monitors the Australia Non-Meat Ingredients Market and publishes its comprehensive annual report, highlighting emerging trends, growth drivers, revenue analysis, and forecast outlook. Our insights help businesses to make data-backed strategic decisions with ongoing market dynamics. Our analysts track relevent industries related to the Australia Non-Meat Ingredients Market, allowing our clients with actionable intelligence and reliable forecasts tailored to emerging regional needs.
Yes, we provide customisation as per your requirements. To learn more, feel free to contact us on sales@6wresearch.com
1 Executive Summary |
2 Introduction |
2.1 Key Highlights of the Report |
2.2 Report Description |
2.3 Market Scope & Segmentation |
2.4 Research Methodology |
2.5 Assumptions |
3 Australia Non-Meat Ingredients Market Overview |
3.1 Australia Country Macro Economic Indicators |
3.2 Australia Non-Meat Ingredients Market Revenues & Volume, 2022 & 2032F |
3.3 Australia Non-Meat Ingredients Market - Industry Life Cycle |
3.4 Australia Non-Meat Ingredients Market - Porter's Five Forces |
3.5 Australia Non-Meat Ingredients Market Revenues & Volume Share, By Ingredient, 2022 & 2032F |
3.6 Australia Non-Meat Ingredients Market Revenues & Volume Share, By Type, 2022 & 2032F |
3.7 Australia Non-Meat Ingredients Market Revenues & Volume Share, By Source, 2022 & 2032F |
3.8 Australia Non-Meat Ingredients Market Revenues & Volume Share, By Product Type, 2022 & 2032F |
4 Australia Non-Meat Ingredients Market Dynamics |
4.1 Impact Analysis |
4.2 Market Drivers |
4.2.1 Increasing consumer awareness about health and wellness leading to a rise in demand for plant-based alternatives. |
4.2.2 Growing trend of veganism and vegetarianism in Australia. |
4.2.3 Government initiatives promoting sustainable and environmentally friendly food choices. |
4.3 Market Restraints |
4.3.1 High production costs associated with non-meat ingredients. |
4.3.2 Limited availability of certain key non-meat ingredients. |
4.3.3 Lack of awareness and understanding among consumers about the benefits of using non-meat ingredients. |
5 Australia Non-Meat Ingredients Market Trends |
6 Australia Non-Meat Ingredients Market, By Types |
6.1 Australia Non-Meat Ingredients Market, By Ingredient |
6.1.1 Overview and Analysis |
6.1.2 Australia Non-Meat Ingredients Market Revenues & Volume, By Ingredient, 2022-2032F |
6.1.3 Australia Non-Meat Ingredients Market Revenues & Volume, By Binders, 2022-2032F |
6.1.4 Australia Non-Meat Ingredients Market Revenues & Volume, By Extenders, 2022-2032F |
6.1.5 Australia Non-Meat Ingredients Market Revenues & Volume, By Fillers, 2022-2032F |
6.1.6 Australia Non-Meat Ingredients Market Revenues & Volume, By Coloring & Flavoring Agents, 2022-2032F |
6.1.7 Australia Non-Meat Ingredients Market Revenues & Volume, By Salts & Preservatives, 2022-2032F |
6.2 Australia Non-Meat Ingredients Market, By Type |
6.2.1 Overview and Analysis |
6.2.2 Australia Non-Meat Ingredients Market Revenues & Volume, By Beef, 2022-2032F |
6.2.3 Australia Non-Meat Ingredients Market Revenues & Volume, By Pork, 2022-2032F |
6.2.4 Australia Non-Meat Ingredients Market Revenues & Volume, By Mutton, 2022-2032F |
6.2.5 Australia Non-Meat Ingredients Market Revenues & Volume, By Poultry, 2022-2032F |
6.3 Australia Non-Meat Ingredients Market, By Source |
6.3.1 Overview and Analysis |
6.3.2 Australia Non-Meat Ingredients Market Revenues & Volume, By Chemical substances, 2022-2032F |
6.3.3 Australia Non-Meat Ingredients Market Revenues & Volume, By Plant origin, 2022-2032F |
6.3.4 Australia Non-Meat Ingredients Market Revenues & Volume, By Animal origin, 2022-2032F |
6.4 Australia Non-Meat Ingredients Market, By Product Type |
6.4.1 Overview and Analysis |
6.4.2 Australia Non-Meat Ingredients Market Revenues & Volume, By Fresh Processed Meat, 2022-2032F |
6.4.3 Australia Non-Meat Ingredients Market Revenues & Volume, By Raw-Cooked Meat, 2022-2032F |
6.4.4 Australia Non-Meat Ingredients Market Revenues & Volume, By Pre-Cooked Meat, 2022-2032F |
6.4.5 Australia Non-Meat Ingredients Market Revenues & Volume, By Raw Fermented Sausages, 2022-2032F |
6.4.6 Australia Non-Meat Ingredients Market Revenues & Volume, By Cured Meat, 2022-2032F |
6.4.7 Australia Non-Meat Ingredients Market Revenues & Volume, By Dried Meat, 2022-2032F |
7 Australia Non-Meat Ingredients Market Import-Export Trade Statistics |
7.1 Australia Non-Meat Ingredients Market Export to Major Countries |
7.2 Australia Non-Meat Ingredients Market Imports from Major Countries |
8 Australia Non-Meat Ingredients Market Key Performance Indicators |
8.1 Number of new product launches featuring non-meat ingredients. |
8.2 Growth in the number of vegan and vegetarian restaurants and food establishments. |
8.3 Percentage increase in the use of non-meat ingredients in food manufacturing processes. |
8.4 Consumer surveys indicating preferences for non-meat ingredient products. |
8.5 Increase in the number of partnerships between food companies and non-meat ingredient suppliers. |
9 Australia Non-Meat Ingredients Market - Opportunity Assessment |
9.1 Australia Non-Meat Ingredients Market Opportunity Assessment, By Ingredient, 2022 & 2032F |
9.2 Australia Non-Meat Ingredients Market Opportunity Assessment, By Type, 2022 & 2032F |
9.3 Australia Non-Meat Ingredients Market Opportunity Assessment, By Source, 2022 & 2032F |
9.4 Australia Non-Meat Ingredients Market Opportunity Assessment, By Product Type, 2022 & 2032F |
10 Australia Non-Meat Ingredients Market - Competitive Landscape |
10.1 Australia Non-Meat Ingredients Market Revenue Share, By Companies, 2025 |
10.2 Australia Non-Meat Ingredients Market Competitive Benchmarking, By Operating and Technical Parameters |
11 Company Profiles |
12 Recommendations |
13 Disclaimer |
Export potential assessment - trade Analytics for 2030
Export potential enables firms to identify high-growth global markets with greater confidence by combining advanced trade intelligence with a structured quantitative methodology. The framework analyzes emerging demand trends and country-level import patterns while integrating macroeconomic and trade datasets such as GDP and population forecasts, bilateral import–export flows, tariff structures, elasticity differentials between developed and developing economies, geographic distance, and import demand projections. Using weighted trade values from 2020–2024 as the base period to project country-to-country export potential for 2030, these inputs are operationalized through calculated drivers such as gravity model parameters, tariff impact factors, and projected GDP per-capita growth. Through an analysis of hidden potentials, demand hotspots, and market conditions that are most favorable to success, this method enables firms to focus on target countries, maximize returns, and global expansion with data, backed by accuracy.
By factoring in the projected importer demand gap that is currently unmet and could be potential opportunity, it identifies the potential for the Exporter (Country) among 190 countries, against the general trade analysis, which identifies the biggest importer or exporter.
To discover high-growth global markets and optimize your business strategy:
Click Here
Pricing
- Single User License$ 1,995
- Department License$ 2,400
- Site License$ 3,120
- Global License$ 3,795

Search
Thought Leadership and Analyst Meet


Our Clients
Latest Reports
- Canada Cloud CFD Market (2026-2032) | Size & Revenue, Industry, Growth, Competitive Landscape, Forecast, Segmentation, Value, Outlook, Trends, Share, Analysis, Companies
- Taiwan Food Delivery Platform Market (2026-2032) | Companies, Outlook, Analysis, Trends, Value, Revenue, Segmentation, Share, Forecast, Competitive Landscape, Growth, Size & Forecast
- United Kingdom (UK) Long-term Care Insurance Market (2026-2032) | Growth, Share, Consumer Insights, Drivers, Opportunities, Competition, Pricing Analysis, Segments, Restraints, Companies, Competitive, Value, Outlook, Size, Demand, Analysis, Challenges, Strategic Insights, Investment Trends, Revenue, Trends, Supply, Forecast
- United Kingdom (UK) Long Term Care Market (2026-2032) | Companies, Outlook, Analysis, Trends, Value, Revenue, Segmentation, Share, Forecast, Competitive Landscape, Growth, Size & Forecast
- Iraq Insulation and Waterproofing Market (2026-2032) | Outlook, Drivers, Growth, Size, Share, Industry, Revenue, Trends, Demand, Competitive, Strategic Insights, Opportunities, Segments, Companies, Challenges, Strategy, Consumer Insights, Analysis, Investment Trends, Value, Segmentation, Forecast, Restraints
- India Switchgear Market Outlook (2026-2032) | Size, Share, Trends, Growth, Revenue, Forecast, Analysis, Value, Outlook
- Pakistan Contraceptive Implants Market (2025-2031) | Demand, Growth, Size, Share, Industry, Pricing Analysis, Competitive, Strategic Insights, Strategy, Consumer Insights, Analysis, Investment Trends, Opportunities, Revenue, Segments, Value, Segmentation, Supply, Forecast, Restraints, Outlook, Competition, Drivers, Trends, Companies, Challenges
- Sri Lanka Packaging Market (2026-2032) | Outlook, Competition, Drivers, Trends, Demand, Pricing Analysis, Competitive, Strategic Insights, Companies, Challenges, Strategy, Consumer Insights, Analysis, Investment Trends, Opportunities, Growth, Size, Share, Industry, Revenue, Segments, Value, Segmentation, Supply, Forecast, Restraints
- India Kids Watches Market (2026-2032) | Strategy, Consumer Insights, Analysis, Investment Trends, Opportunities, Growth, Size, Share, Industry, Revenue, Segments, Value, Segmentation, Supply, Forecast, Restraints, Outlook, Competition, Drivers, Trends, Demand, Pricing Analysis, Competitive, Strategic Insights, Companies, Challenges
- Saudi Arabia Core Assurance Service Market (2025-2031) | Strategy, Consumer Insights, Analysis, Investment Trends, Opportunities, Growth, Size, Share, Industry, Revenue, Segments, Value, Segmentation, Supply, Forecast, Restraints, Outlook, Competition, Drivers, Trends, Demand, Pricing Analysis, Competitive, Strategic Insights, Companies, Challenges
Industry Events and Analyst Meet

India EV Show 2026

EV tech India Expo 2026

Auto Tech Asia 2026

Battery Tech India 2026

Smart Production Solutions Guangzhou 2026
Whitepaper
- Middle East & Africa Commercial Security Market Click here to view more.
- Middle East & Africa Fire Safety Systems & Equipment Market Click here to view more.
- GCC Drone Market Click here to view more.
- Middle East Lighting Fixture Market Click here to view more.
- GCC Physical & Perimeter Security Market Click here to view more.
6WResearch In News
- Doha a strategic location for EV manufacturing hub: IPA Qatar
- Demand for luxury TVs surging in the GCC, says Samsung
- Empowering Growth: The Thriving Journey of Bangladesh’s Cable Industry
- Demand for luxury TVs surging in the GCC, says Samsung
- Video call with a traditional healer? Once unthinkable, it’s now common in South Africa
- Intelligent Buildings To Smooth GCC’s Path To Net Zero