Australia Nondurable Goods Market (2026-2032) Outlook | Industry, Size, Companies, Forecast, Trends, Share, Revenue, Value, Analysis & Growth
Market Forecast By Product Type (Food, Drinks, Medication, Cleaning Supplies, Cosmetics, Office Supplies, Apparel, Cigarettes And Tobacco), By Applications (Offline, Online) And Competitive Landscape
| Product Code: ETC254315 | Publication Date: Aug 2022 | Updated Date: Mar 2026 | Product Type: Market Research Report | |
| Publisher: 6Wresearch | Author: Ravi Bhandari | No. of Pages: 75 | No. of Figures: 35 | No. of Tables: 20 |
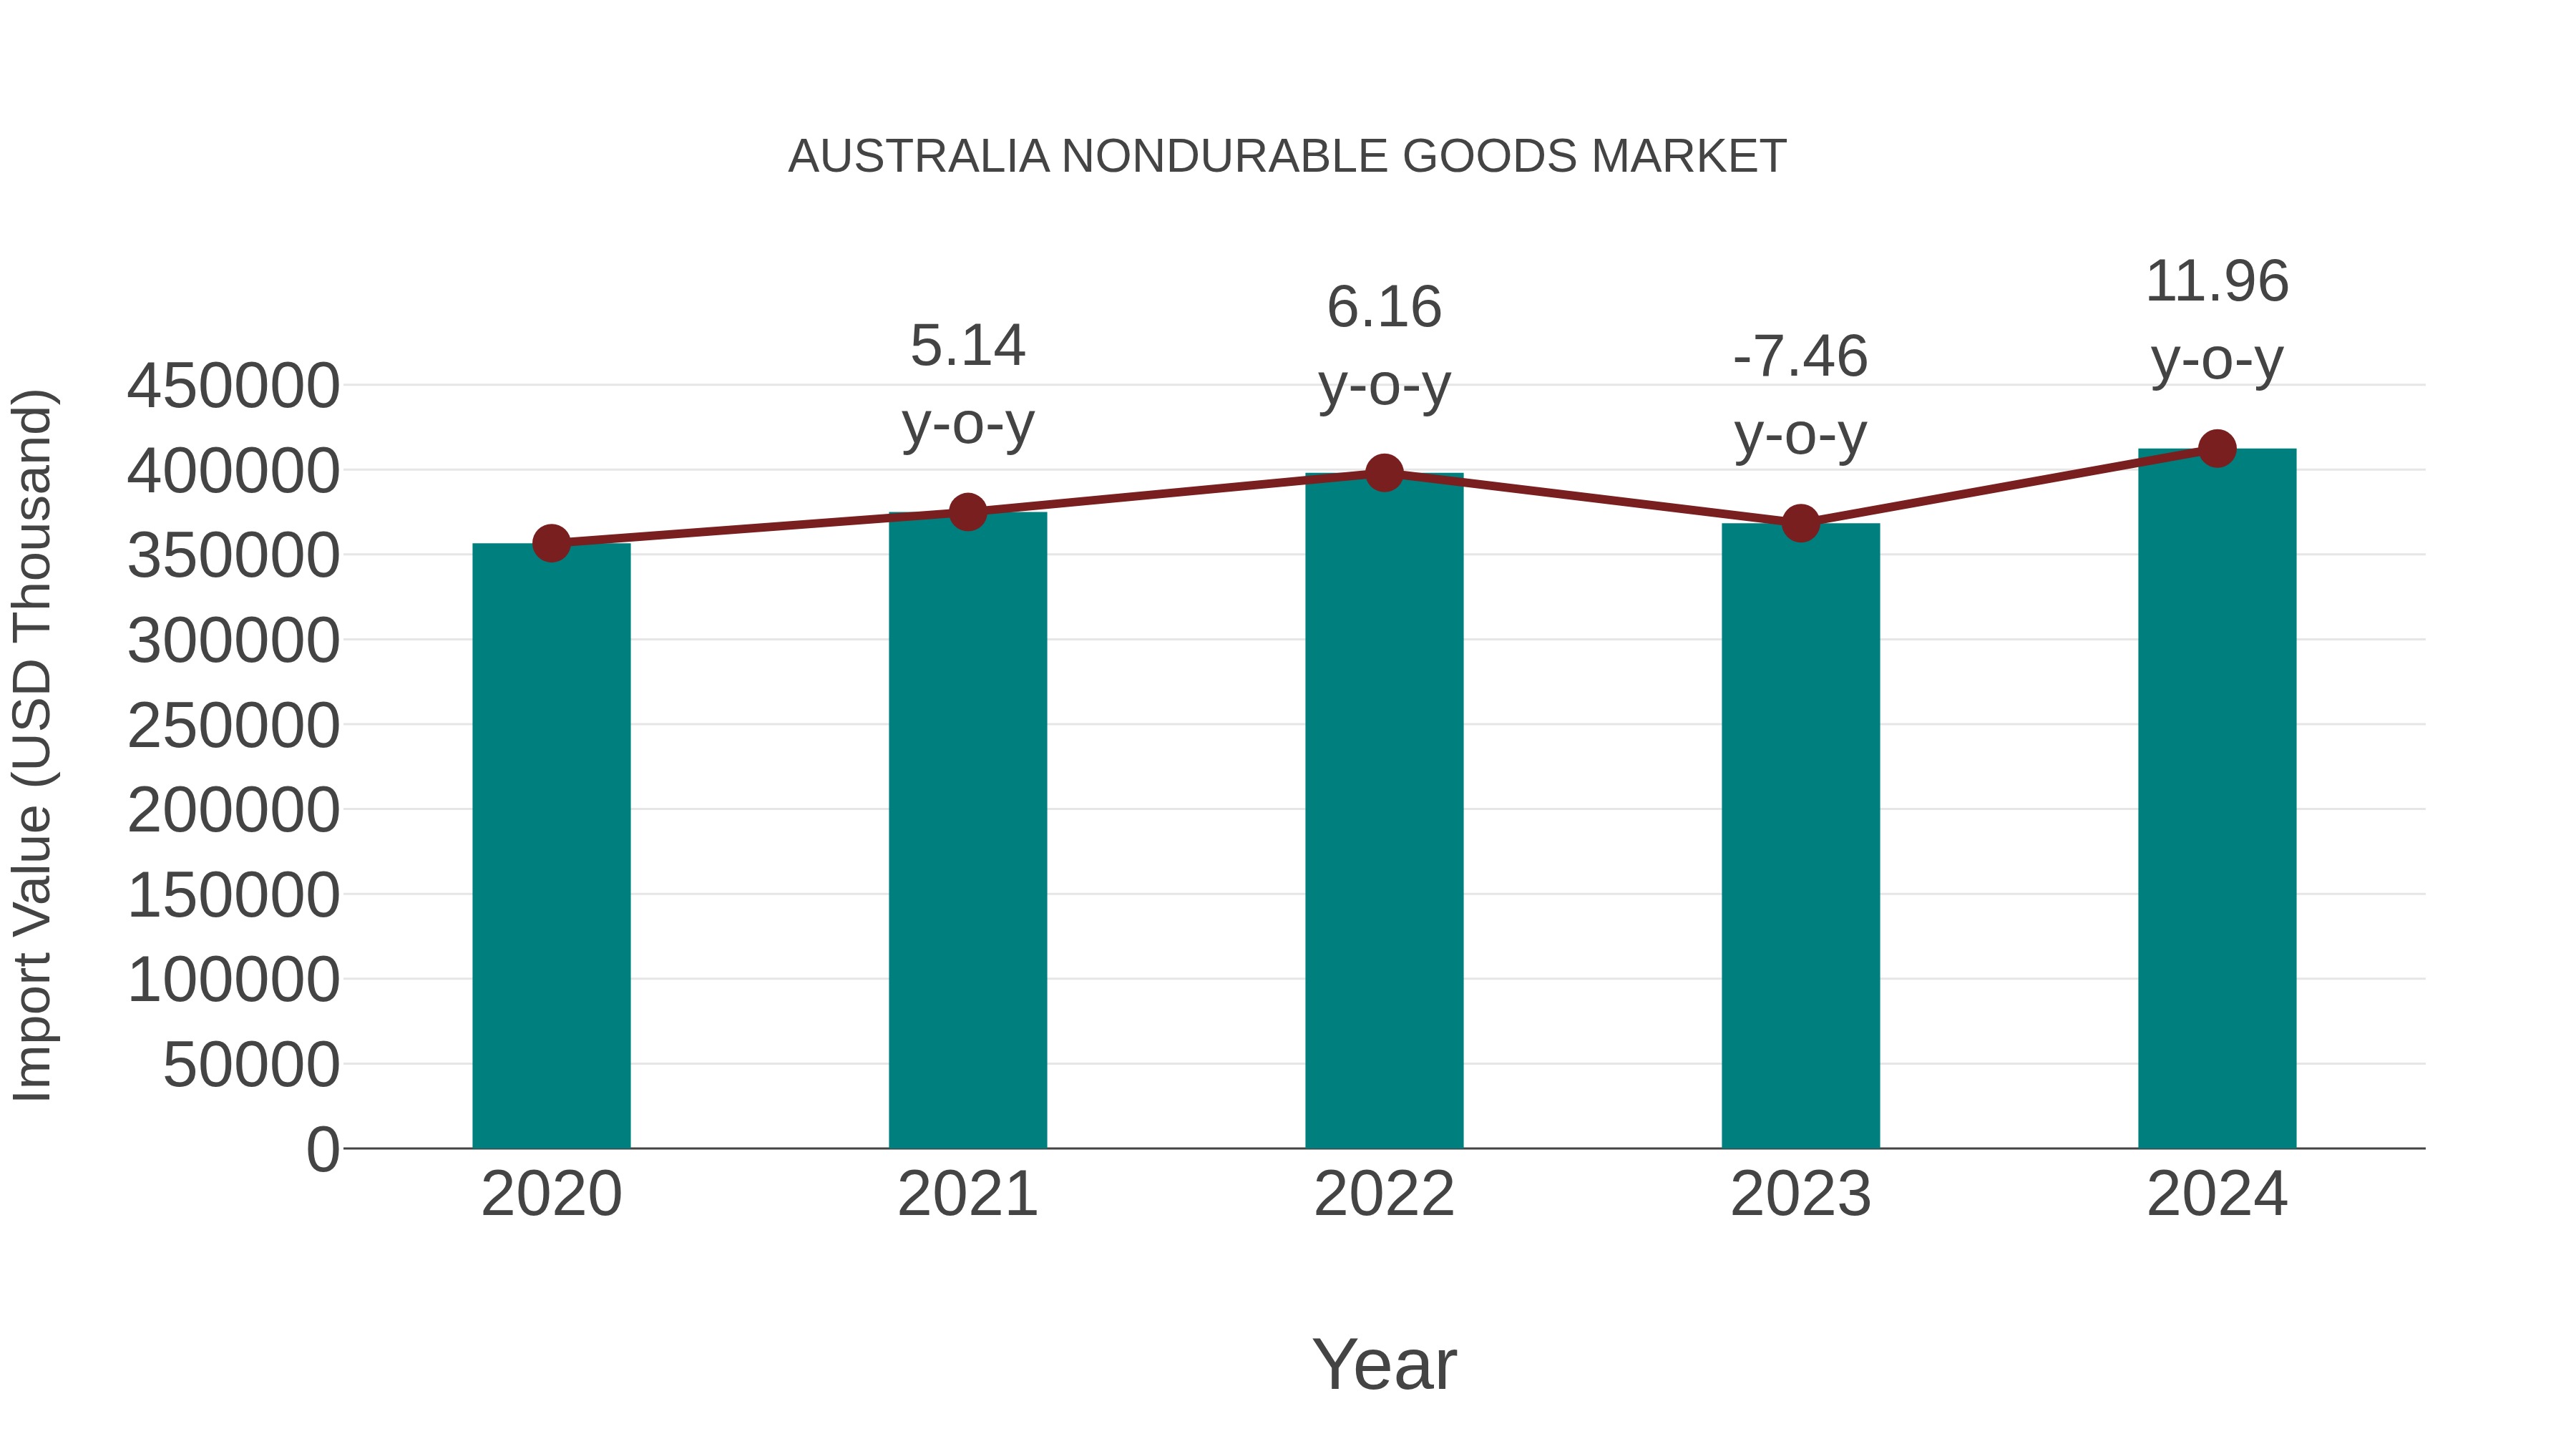
Australia Nondurable Goods Market: Import Trend Analysis
In the Australia nondurable goods market, the import trend showed a notable growth rate of 11.96% from 2023 to 2024, with a compound annual growth rate (CAGR) of 3.7% for the period 2020-2024. This import momentum can be attributed to increased demand for foreign nondurable goods, potentially influenced by evolving consumer preferences or shifts in trade policies.
Australia Nondurable Goods Market Synopsis
Australias nondurable goods market includes a broad range of consumer essentials, from food and beverages to household products. The market is influenced by economic conditions, consumer spending habits, and sustainability trends.
Drivers of the market
The nondurable goods market in Australia is influenced by consistent consumer demand for fast-moving consumer goods (FMCG), including food, beverages, toiletries, and household products. Economic stability, population growth, and changes in consumer behavior impact purchasing trends. The rise of e-commerce and contactless retail shopping has also reshaped the market, offering convenience and accessibility.
Challenges of the market
The nondurable goods market in Australia faces price volatility due to fluctuations in raw material and production costs. Consumer preferences for sustainable and reusable alternatives impact sales of single-use products. Additionally, supply chain disruptions and import dependency create instability in market growth.
Investment opportunities in the Market
The nondurable goods sector in Australia, covering FMCG, paper products, and disposable items, offers steady investment opportunities. Businesses can focus on sustainable packaging, biodegradable materials, and innovative product formulations to meet changing consumer preferences.
Government Policy of the market
The nondurable goods market, which includes perishable and short-lived products, is regulated under consumer protection laws and quality control policies. The government enforces strict labeling and safety standards to ensure product reliability. Environmental initiatives promote sustainable packaging and waste reduction for nondurable goods. Import regulations require foreign goods to comply with Australian safety and quality standards before distribution.
Key Highlights of the Report:
- Australia Nondurable Goods Market Outlook
- Market Size of Australia Nondurable Goods Market, 2025
- Forecast of Australia Nondurable Goods Market, 2032
- Historical Data and Forecast of Australia Nondurable Goods Revenues & Volume for the Period 2022-2032F
- Australia Nondurable Goods Market Trend Evolution
- Australia Nondurable Goods Market Drivers and Challenges
- Australia Nondurable Goods Price Trends
- Australia Nondurable Goods Porter's Five Forces
- Australia Nondurable Goods Industry Life Cycle
- Historical Data and Forecast of Australia Nondurable Goods Market Revenues & Volume By Product Type for the Period 2022-2032F
- Historical Data and Forecast of Australia Nondurable Goods Market Revenues & Volume By Food for the Period 2022-2032F
- Historical Data and Forecast of Australia Nondurable Goods Market Revenues & Volume By Drinks for the Period 2022-2032F
- Historical Data and Forecast of Australia Nondurable Goods Market Revenues & Volume By Medication for the Period 2022-2032F
- Historical Data and Forecast of Australia Nondurable Goods Market Revenues & Volume By Cleaning Supplies for the Period 2022-2032F
- Historical Data and Forecast of Australia Nondurable Goods Market Revenues & Volume By Cosmetics for the Period 2022-2032F
- Historical Data and Forecast of Australia Nondurable Goods Market Revenues & Volume By Office Supplies for the Period 2022-2032F
- Historical Data and Forecast of Australia Nondurable Goods Market Revenues & Volume By Apparel for the Period 2022-2032F
- Historical Data and Forecast of Australia Food Nondurable Goods Market Revenues & Volume By Cigarettes And Tobacco for the Period 2022-2032F
- Historical Data and Forecast of Australia Nondurable Goods Market Revenues & Volume By Applications for the Period 2022-2032F
- Historical Data and Forecast of Australia Nondurable Goods Market Revenues & Volume By Offline for the Period 2022-2032F
- Historical Data and Forecast of Australia Nondurable Goods Market Revenues & Volume By Online for the Period 2022-2032F
- Australia Nondurable Goods Import Export Trade Statistics
- Market Opportunity Assessment By Product Type
- Market Opportunity Assessment By Applications
- Australia Nondurable Goods Top Companies Market Share
- Australia Nondurable Goods Competitive Benchmarking By Technical and Operational Parameters
- Australia Nondurable Goods Company Profiles
- Australia Nondurable Goods Key Strategic Recommendations
Australia Nondurable Goods Market (2026-2032): FAQs
6Wresearch actively monitors the Australia Nondurable Goods Market and publishes its comprehensive annual report, highlighting emerging trends, growth drivers, revenue analysis, and forecast outlook. Our insights help businesses to make data-backed strategic decisions with ongoing market dynamics. Our analysts track relevent industries related to the Australia Nondurable Goods Market, allowing our clients with actionable intelligence and reliable forecasts tailored to emerging regional needs.
Yes, we provide customisation as per your requirements. To learn more, feel free to contact us on sales@6wresearch.com
1 Executive Summary |
2 Introduction |
2.1 Key Highlights of the Report |
2.2 Report Description |
2.3 Market Scope & Segmentation |
2.4 Research Methodology |
2.5 Assumptions |
3 Australia Nondurable Goods Market Overview |
3.1 Australia Country Macro Economic Indicators |
3.2 Australia Nondurable Goods Market Revenues & Volume, 2022 & 2032F |
3.3 Australia Nondurable Goods Market - Industry Life Cycle |
3.4 Australia Nondurable Goods Market - Porter's Five Forces |
3.5 Australia Nondurable Goods Market Revenues & Volume Share, By Product Type, 2022 & 2032F |
3.6 Australia Nondurable Goods Market Revenues & Volume Share, By Applications, 2022 & 2032F |
4 Australia Nondurable Goods Market Dynamics |
4.1 Impact Analysis |
4.2 Market Drivers |
4.2.1 Increasing disposable income of consumers in Australia |
4.2.2 Growing demand for convenience and ready-to-eat products |
4.2.3 Shift towards healthier and organic food products |
4.3 Market Restraints |
4.3.1 Fluctuating raw material prices |
4.3.2 Intense competition among market players |
4.3.3 Changing consumer preferences and trends |
5 Australia Nondurable Goods Market Trends |
6 Australia Nondurable Goods Market, By Types |
6.1 Australia Nondurable Goods Market, By Product Type |
6.1.1 Overview and Analysis |
6.1.2 Australia Nondurable Goods Market Revenues & Volume, By Product Type, 2022-2032F |
6.1.3 Australia Nondurable Goods Market Revenues & Volume, By Food, 2022-2032F |
6.1.4 Australia Nondurable Goods Market Revenues & Volume, By Drinks, 2022-2032F |
6.1.5 Australia Nondurable Goods Market Revenues & Volume, By Medication, 2022-2032F |
6.1.6 Australia Nondurable Goods Market Revenues & Volume, By Cleaning Supplies, 2022-2032F |
6.1.7 Australia Nondurable Goods Market Revenues & Volume, By Cosmetics, 2022-2032F |
6.1.8 Australia Nondurable Goods Market Revenues & Volume, By Office Supplies, 2022-2032F |
6.1.9 Australia Nondurable Goods Market Revenues & Volume, By Cigarettes And Tobacco, 2022-2032F |
6.1.10 Australia Nondurable Goods Market Revenues & Volume, By Cigarettes And Tobacco, 2022-2032F |
6.2 Australia Nondurable Goods Market, By Applications |
6.2.1 Overview and Analysis |
6.2.2 Australia Nondurable Goods Market Revenues & Volume, By Offline, 2022-2032F |
6.2.3 Australia Nondurable Goods Market Revenues & Volume, By Online, 2022-2032F |
7 Australia Nondurable Goods Market Import-Export Trade Statistics |
7.1 Australia Nondurable Goods Market Export to Major Countries |
7.2 Australia Nondurable Goods Market Imports from Major Countries |
8 Australia Nondurable Goods Market Key Performance Indicators |
8.1 Consumer sentiment index towards non-durable goods |
8.2 Household spending on non-durable goods |
8.3 Number of new product launches in the non-durable goods segment |
8.4 Consumer engagement with non-durable goods brands on social media |
8.5 Sustainability initiatives adopted by companies in the non-durable goods market |
9 Australia Nondurable Goods Market - Opportunity Assessment |
9.1 Australia Nondurable Goods Market Opportunity Assessment, By Product Type, 2022 & 2032F |
9.2 Australia Nondurable Goods Market Opportunity Assessment, By Applications, 2022 & 2032F |
10 Australia Nondurable Goods Market - Competitive Landscape |
10.1 Australia Nondurable Goods Market Revenue Share, By Companies, 2025 |
10.2 Australia Nondurable Goods Market Competitive Benchmarking, By Operating and Technical Parameters |
11 Company Profiles |
12 Recommendations |
13 Disclaimer |
Global Go To Market Strategy - 2030
Export potential enables firms to identify high-growth global markets with greater confidence by combining advanced trade intelligence with a structured quantitative methodology. The framework analyzes emerging demand trends and country-level import patterns while integrating macroeconomic and trade datasets such as GDP and population forecasts, bilateral import–export flows, tariff structures, elasticity differentials between developed and developing economies, geographic distance, and import demand projections. Using weighted trade values from 2020–2024 as the base period to project country-to-country export potential for 2030, these inputs are operationalized through calculated drivers such as gravity model parameters, tariff impact factors, and projected GDP per-capita growth. Through an analysis of hidden potentials, demand hotspots, and market conditions that are most favorable to success, this method enables firms to focus on target countries, maximize returns, and global expansion with data, backed by accuracy.
By factoring in the projected importer demand gap that is currently unmet and could be potential opportunity, it identifies the potential for the Exporter (Country) among 190 countries, against the general trade analysis, which identifies the biggest importer or exporter.
To discover high-growth global markets and optimize your business strategy:
Click Here
Pricing
- Single User License$ 1,995
- Department License$ 2,400
- Site License$ 3,120
- Global License$ 3,795

Leadership Perspectives from Industry Events
Search
Thought Leadership and Analyst Meet


Our Clients
6WResearch In News
- India Air Conditioner Market Set for Strong Rebound in 2026 After Weather-Led Correction and GST-Driven Recovery: 6Wresearch
- ADAS in India: How Automatic Emergency Braking, Blind Spot Detection & Driver Monitoring are Transforming Road Safety
- Doha a strategic location for EV manufacturing hub: IPA Qatar
- Demand for luxury TVs surging in the GCC, says Samsung
- Empowering Growth: The Thriving Journey of Bangladesh’s Cable Industry
- Demand for luxury TVs surging in the GCC, says Samsung
Latest Reports
- Poland Fire Protection Systems Market (2026-2032)
- Cape Verde Portable Hand-Thrown Extinguisher Market (2026-2032)
- Canada Portable Hand-Thrown Extinguisher Market (2026-2032)
- Cameroon Portable Hand-Thrown Extinguisher Market (2026-2032)
- Burundi Portable Hand-Thrown Extinguisher Market (2026-2032)
- Burkina Faso Portable Hand-Thrown Extinguisher Market (2026-2032)
- Bulgaria Portable Hand-Thrown Extinguisher Market (2026-2032)
- Brunei Portable Hand-Thrown Extinguisher Market (2026-2032)
- Botswana Portable Hand-Thrown Extinguisher Market (2026-2032)
- Bosnia and Herzegovina Portable Hand-Thrown Extinguisher Market (2026-2032)
Industry Events and Analyst Meet

HIMTEX 2026

India Refining Summit 2026

India EV Show 2026

EV tech India Expo 2026

Auto Tech Asia 2026
Whitepaper
- Middle East & Africa Commercial Security Market Click here to view more.
- Middle East & Africa Fire Safety Systems & Equipment Market Click here to view more.
- GCC Drone Market Click here to view more.
- Middle East Lighting Fixture Market Click here to view more.
- GCC Physical & Perimeter Security Market Click here to view more.