Australia Nylon Market Outlook | Analysis, Industry, Growth, Revenue, Value, Share, COVID-19 IMPACT, Forecast, Companies, Trends & Size
Market Forecast By Product (Nylon 6, Nylon 66), By Application (Automobile, Electrical & Electronics, Engineering Plastics, Textiles, Others) And Competitive Landscape
| Product Code: ETC238595 | Publication Date: Aug 2022 | Updated Date: Jan 2026 | Product Type: Market Research Report | |
| Publisher: 6Wresearch | Author: Ravi Bhandari | No. of Pages: 75 | No. of Figures: 35 | No. of Tables: 20 |
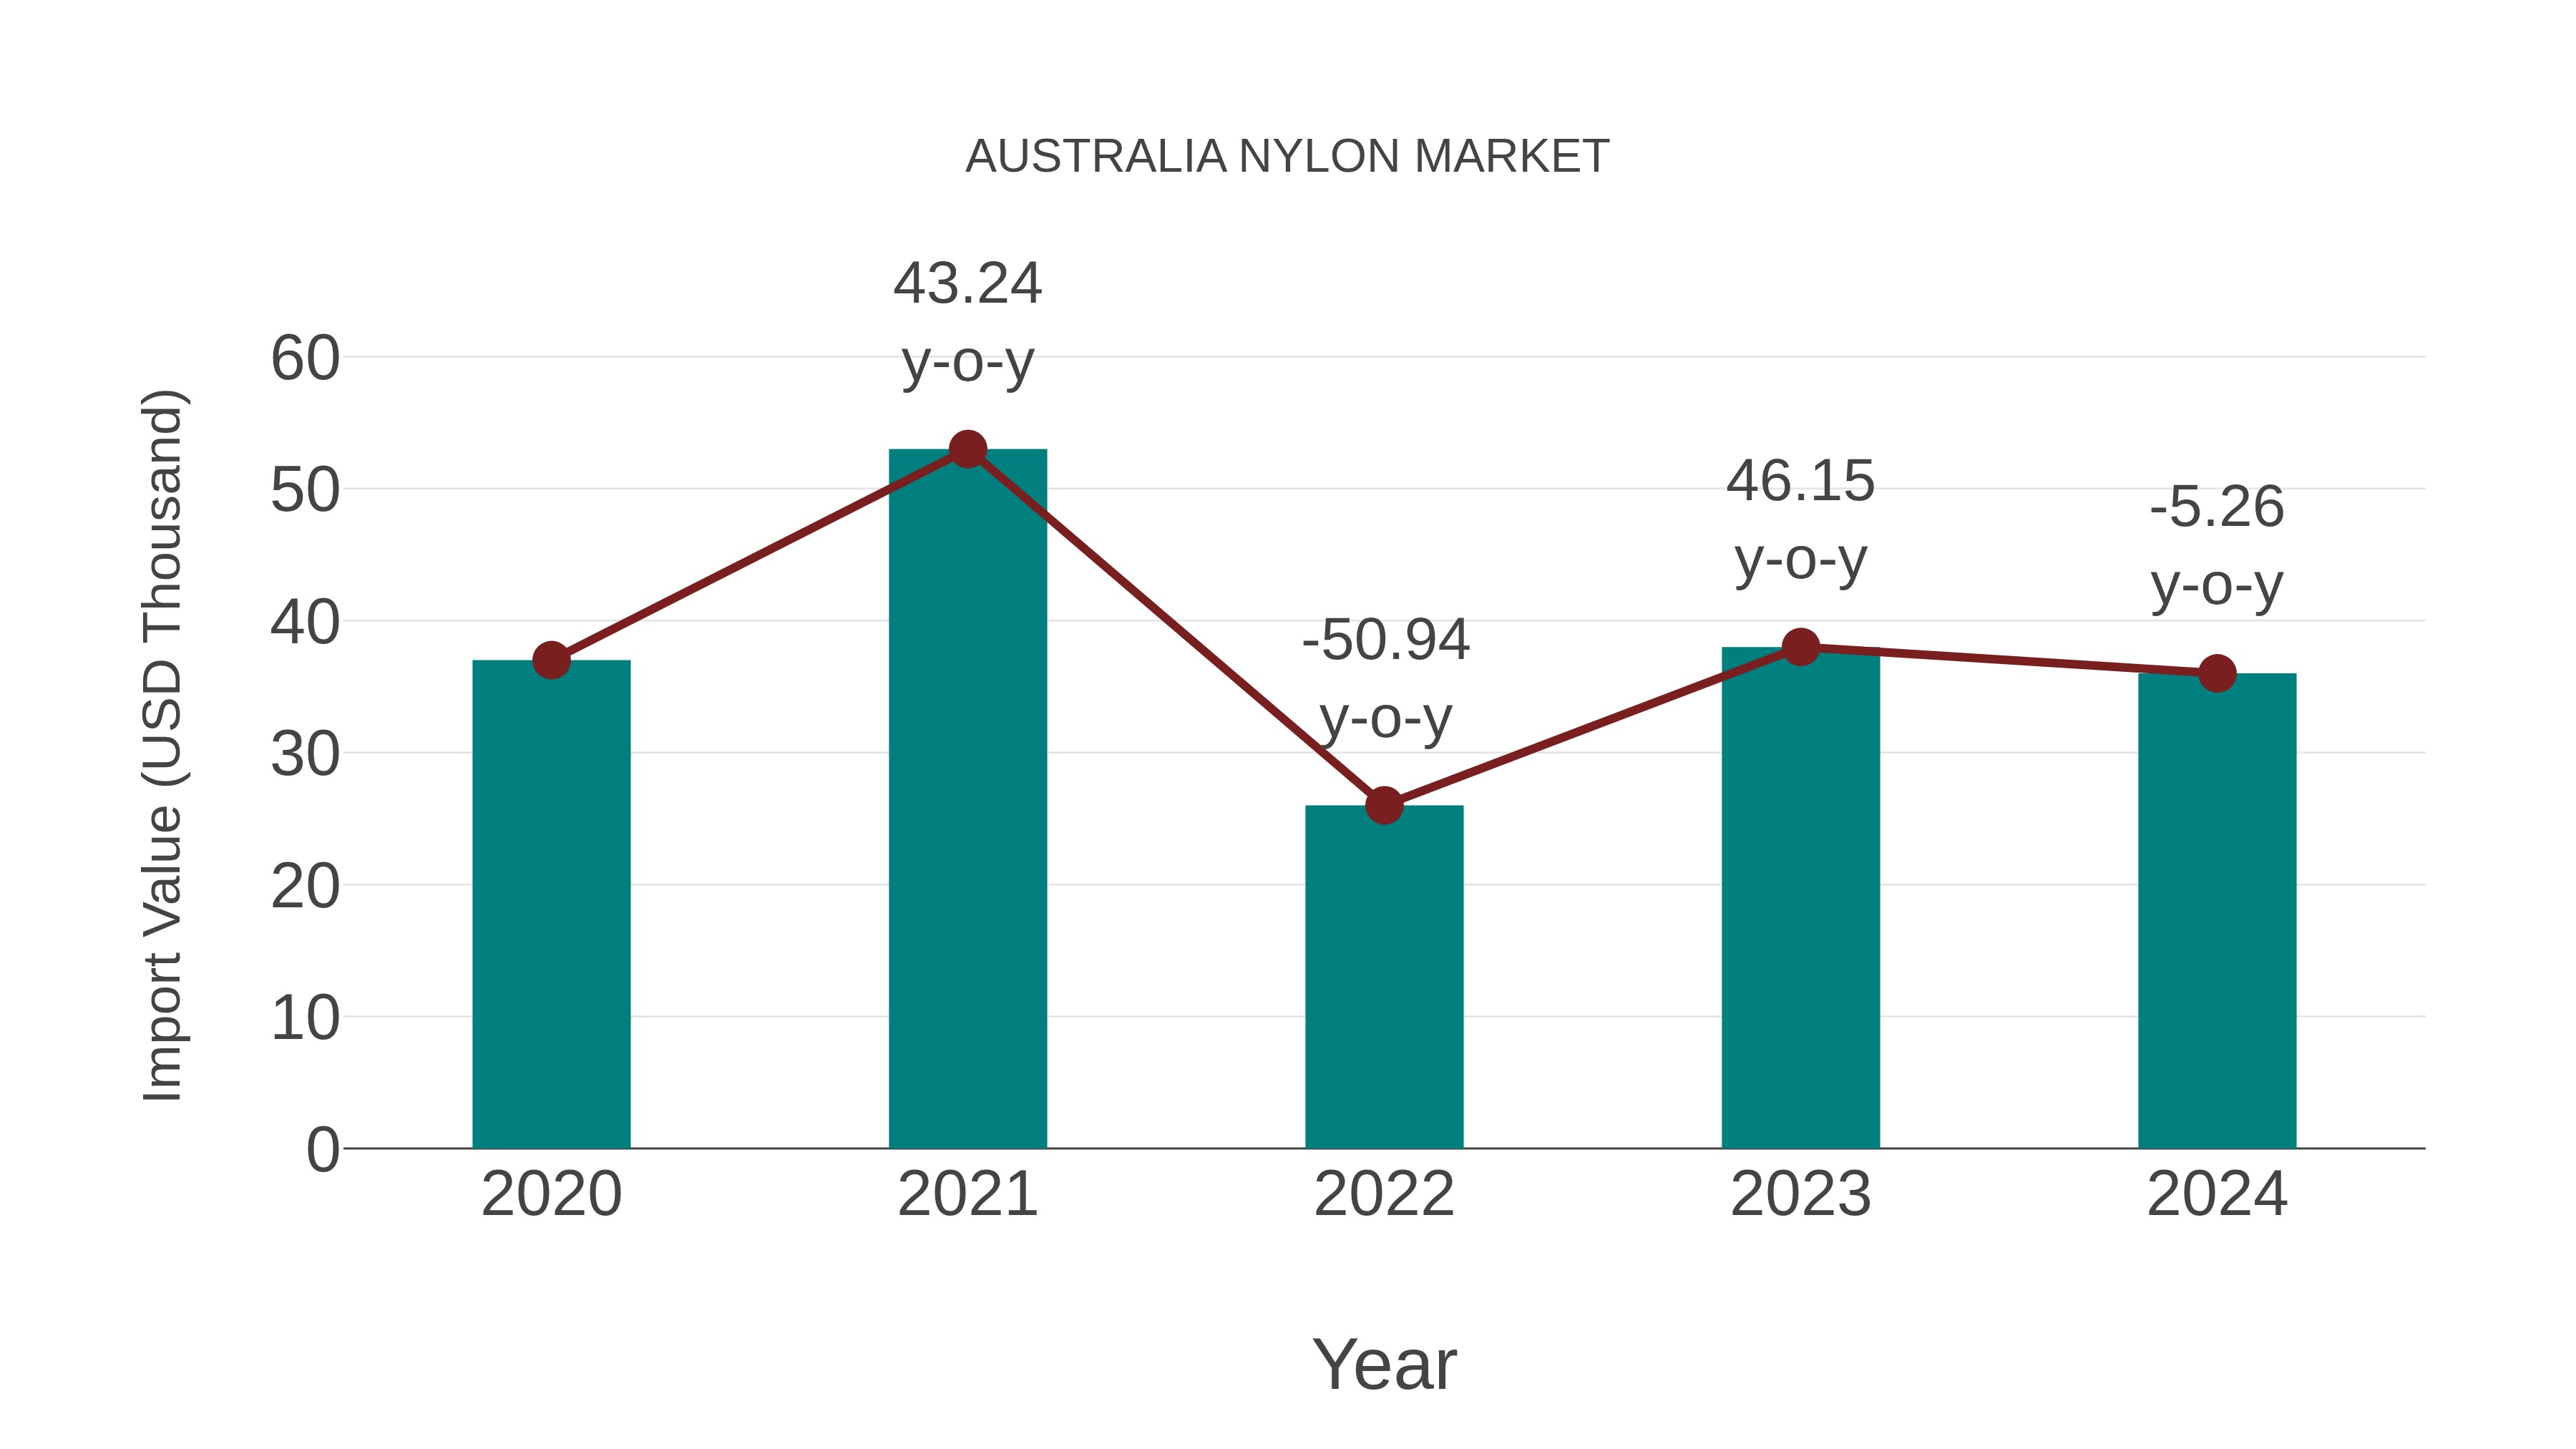
Australia Nylon Market: Import Trend Analysis
In the Australia nylon market, the import trend exhibited a decline, with a growth rate of -5.26% from 2023 to 2024. The compound annual growth rate (CAGR) for imports between 2020 and 2024 stood at -0.68%. This negative momentum can be attributed to shifting demand patterns or changes in trade policies impacting market stability.
Australia Nylon Market Synopsis
The Australian nylon market is influenced by growing demand in various sectors, including textiles, automotive, and industrial applications. With its durability, lightweight properties, and resistance to wear, nylon is widely used in the production of fabrics, engineering plastics, and consumer goods. The market is shaped by both domestic manufacturing and imports, with sustainability concerns driving interest in recycled nylon products. The expansion of end-user industries and technological advancements in polymer processing contribute to steady market growth.
Drivers of the market
Australias nylon market benefits from increasing demand in apparel, automotive components, and industrial applications. The materials versatility and resistance to wear and tear make it a preferred choice for various end uses. The rise of sustainable and bio-based nylon production is also influencing market trends, with manufacturers adopting greener production processes.
Challenges of the market
Australias nylon market is impacted by supply chain disruptions and competition from recycled or bio-based nylon alternatives. The fashion industrys shift toward sustainability is also affecting demand for conventional nylon. Fluctuations in crude oil prices further contribute to raw material cost variations.
Investment opportunities in the Market
The Australian nylon market presents strong investment potential due to its widespread applications in textiles, automotive components, and industrial uses. With the growing demand for durable, lightweight, and high-performance materials, investors can explore opportunities in domestic nylon production, recycling, and innovation in sustainable nylon alternatives. The increasing need for eco-friendly and biodegradable synthetic materials further enhances the sector`s appeal.
Government Policy of the market
The nylon market is governed by industrial regulations and environmental policies. The government enforces chemical safety laws to regulate the production and use of nylon-based products. Recycling initiatives encourage the reuse of nylon materials to reduce plastic waste. Import controls ensure that foreign nylon products meet national safety and quality standards.
Key Highlights of the Report:
- Australia Nylon Market Outlook
- Market Size of Australia Nylon Market, 2024
- Forecast of Australia Nylon Market, 2031
- Historical Data and Forecast of Australia Nylon Revenues & Volume for the Period 2018 - 2031
- Australia Nylon Market Trend Evolution
- Australia Nylon Market Drivers and Challenges
- Australia Nylon Price Trends
- Australia Nylon Porter's Five Forces
- Australia Nylon Industry Life Cycle
- Historical Data and Forecast of Australia Nylon Market Revenues & Volume By Product for the Period 2018 - 2031
- Historical Data and Forecast of Australia Nylon Market Revenues & Volume By Nylon 6 for the Period 2018 - 2031
- Historical Data and Forecast of Australia Nylon Market Revenues & Volume By Nylon 66 for the Period 2018 - 2031
- Historical Data and Forecast of Australia Nylon Market Revenues & Volume By Application for the Period 2018 - 2031
- Historical Data and Forecast of Australia Nylon Market Revenues & Volume By Automobile for the Period 2018 - 2031
- Historical Data and Forecast of Australia Nylon Market Revenues & Volume By Electrical & Electronics for the Period 2018 - 2031
- Historical Data and Forecast of Australia Nylon Market Revenues & Volume By Engineering Plastics for the Period 2018 - 2031
- Historical Data and Forecast of Australia Nylon Market Revenues & Volume By Textiles for the Period 2018 - 2031
- Historical Data and Forecast of Australia Nylon Market Revenues & Volume By Others for the Period 2018 - 2031
- Australia Nylon Import Export Trade Statistics
- Market Opportunity Assessment By Product
- Market Opportunity Assessment By Application
- Australia Nylon Top Companies Market Share
- Australia Nylon Competitive Benchmarking By Technical and Operational Parameters
- Australia Nylon Company Profiles
- Australia Nylon Key Strategic Recommendations
Frequently Asked Questions About the Market Study (FAQs):
6Wresearch actively monitors the Australia Nylon Market and publishes its comprehensive annual report, highlighting emerging trends, growth drivers, revenue analysis, and forecast outlook. Our insights help businesses to make data-backed strategic decisions with ongoing market dynamics. Our analysts track relevent industries related to the Australia Nylon Market, allowing our clients with actionable intelligence and reliable forecasts tailored to emerging regional needs.
Yes, we provide customisation as per your requirements. To learn more, feel free to contact us on sales@6wresearch.com
1 Executive Summary |
2 Introduction |
2.1 Key Highlights of the Report |
2.2 Report Description |
2.3 Market Scope & Segmentation |
2.4 Research Methodology |
2.5 Assumptions |
3 Australia Nylon Market Overview |
3.1 Australia Country Macro Economic Indicators |
3.2 Australia Nylon Market Revenues & Volume, 2021 & 2031F |
3.3 Australia Nylon Market - Industry Life Cycle |
3.4 Australia Nylon Market - Porter's Five Forces |
3.5 Australia Nylon Market Revenues & Volume Share, By Product, 2021 & 2031F |
3.6 Australia Nylon Market Revenues & Volume Share, By Application, 2021 & 2031F |
4 Australia Nylon Market Dynamics |
4.1 Impact Analysis |
4.2 Market Drivers |
4.2.1 Growing demand for nylon in various end-use industries such as automotive, textiles, and consumer goods. |
4.2.2 Technological advancements leading to the development of innovative nylon products with enhanced properties. |
4.2.3 Increasing focus on sustainability and the shift towards eco-friendly nylon production processes. |
4.3 Market Restraints |
4.3.1 Fluctuating prices of raw materials impacting the overall production costs of nylon. |
4.3.2 Intense competition from alternative materials such as polyester and polypropylene. |
4.3.3 Regulatory challenges related to environmental compliance and waste management in the nylon manufacturing process. |
5 Australia Nylon Market Trends |
6 Australia Nylon Market, By Types |
6.1 Australia Nylon Market, By Product |
6.1.1 Overview and Analysis |
6.1.2 Australia Nylon Market Revenues & Volume, By Product, 2021-2031F |
6.1.3 Australia Nylon Market Revenues & Volume, By Nylon 6, 2021-2031F |
6.1.4 Australia Nylon Market Revenues & Volume, By Nylon 66, 2021-2031F |
6.2 Australia Nylon Market, By Application |
6.2.1 Overview and Analysis |
6.2.2 Australia Nylon Market Revenues & Volume, By Automobile, 2021-2031F |
6.2.3 Australia Nylon Market Revenues & Volume, By Electrical & Electronics, 2021-2031F |
6.2.4 Australia Nylon Market Revenues & Volume, By Engineering Plastics, 2021-2031F |
6.2.5 Australia Nylon Market Revenues & Volume, By Textiles, 2021-2031F |
6.2.6 Australia Nylon Market Revenues & Volume, By Others, 2021-2031F |
7 Australia Nylon Market Import-Export Trade Statistics |
7.1 Australia Nylon Market Export to Major Countries |
7.2 Australia Nylon Market Imports from Major Countries |
8 Australia Nylon Market Key Performance Indicators |
8.1 Percentage of recycled materials used in nylon production. |
8.2 Adoption rate of bio-based nylon products in the market. |
8.3 Number of patents filed for new nylon technologies. |
8.4 Rate of investment in research and development for nylon innovation. |
8.5 Carbon footprint reduction achieved in the nylon manufacturing process. |
9 Australia Nylon Market - Opportunity Assessment |
9.1 Australia Nylon Market Opportunity Assessment, By Product, 2021 & 2031F |
9.2 Australia Nylon Market Opportunity Assessment, By Application, 2021 & 2031F |
10 Australia Nylon Market - Competitive Landscape |
10.1 Australia Nylon Market Revenue Share, By Companies, 2024 |
10.2 Australia Nylon Market Competitive Benchmarking, By Operating and Technical Parameters |
11 Company Profiles |
12 Recommendations |
13 Disclaimer |
Global Go To Market Strategy - 2030
Export potential enables firms to identify high-growth global markets with greater confidence by combining advanced trade intelligence with a structured quantitative methodology. The framework analyzes emerging demand trends and country-level import patterns while integrating macroeconomic and trade datasets such as GDP and population forecasts, bilateral import–export flows, tariff structures, elasticity differentials between developed and developing economies, geographic distance, and import demand projections. Using weighted trade values from 2020–2024 as the base period to project country-to-country export potential for 2030, these inputs are operationalized through calculated drivers such as gravity model parameters, tariff impact factors, and projected GDP per-capita growth. Through an analysis of hidden potentials, demand hotspots, and market conditions that are most favorable to success, this method enables firms to focus on target countries, maximize returns, and global expansion with data, backed by accuracy.
By factoring in the projected importer demand gap that is currently unmet and could be potential opportunity, it identifies the potential for the Exporter (Country) among 190 countries, against the general trade analysis, which identifies the biggest importer or exporter.
To discover high-growth global markets and optimize your business strategy:
Click Here
Pricing
- Single User License$ 1,995
- Department License$ 2,400
- Site License$ 3,120
- Global License$ 3,795

Leadership Perspectives from Industry Events
Search
Thought Leadership and Analyst Meet


Our Clients
6WResearch In News
- India Air Conditioner Market Set for Strong Rebound in 2026 After Weather-Led Correction and GST-Driven Recovery: 6Wresearch
- ADAS in India: How Automatic Emergency Braking, Blind Spot Detection & Driver Monitoring are Transforming Road Safety
- Doha a strategic location for EV manufacturing hub: IPA Qatar
- Demand for luxury TVs surging in the GCC, says Samsung
- Empowering Growth: The Thriving Journey of Bangladesh’s Cable Industry
- Demand for luxury TVs surging in the GCC, says Samsung
Latest Reports
- Nicaragua RPG Gaming Market (2026-2032)
- New Zealand RPG Gaming Market (2026-2032)
- Netherlands RPG Gaming Market (2026-2032)
- Nauru RPG Gaming Market (2026-2032)
- Namibia RPG Gaming Market (2026-2032)
- Mozambique RPG Gaming Market (2026-2032)
- Montenegro RPG Gaming Market (2026-2032)
- Mongolia RPG Gaming Market (2026-2032)
- Monaco RPG Gaming Market (2026-2032)
- Micronesia RPG Gaming Market (2026-2032)
Industry Events and Analyst Meet

HIMTEX 2026

India Refining Summit 2026

India EV Show 2026

EV tech India Expo 2026

Auto Tech Asia 2026
Whitepaper
- Middle East & Africa Commercial Security Market Click here to view more.
- Middle East & Africa Fire Safety Systems & Equipment Market Click here to view more.
- GCC Drone Market Click here to view more.
- Middle East Lighting Fixture Market Click here to view more.
- GCC Physical & Perimeter Security Market Click here to view more.