Australia Office Equipment Market (2026-2032) | Value, Share, Size, Growth, Industry, Forecast, Companies, Trends, Revenue, Outlook & Analysis
Market Forecast By Type (Photocopiers, Printers and Scanners, Fax Machines, Coin and Currency Counting Devices), By Distribution Channel (Online, Offline) And Competitive Landscape
| Product Code: ETC037195 | Publication Date: Oct 2020 | Updated Date: Jun 2026 | Product Type: Report | |
| Publisher: 6Wresearch | Author: Ravi Bhandari | No. of Pages: 70 | No. of Figures: 35 | No. of Tables: 5 |
Australia Office Equipment Market Summary
The australia office equipment market was estimated at USD 241 Million in 2025 and is projected to reach USD 284 Million by 2032, growing at a CAGR of 2.6% from 2026 to 2032.
Australia Office Equipment Market Growth Rate Analysis (2021-2032)
The Australian office equipment market began to rebound from a slight contraction of -0.4% in 2021, reflecting the challenges posed by the pandemic and shifts toward remote working. A substantial recovery was noted with a 5.6% growth in 2022, driven by increased consumer demand for innovative solutions and enhanced digitalization initiatives among businesses. This momentum continued into 2023 with a robust growth rate of 4.7%, aided by significant investments in infrastructure and technology adoption. As we look toward 2024 and beyond, growth is projected to stabilize with rates around 2.8% to 3.0% annually, as companies seek to optimize efficiency and adapt to evolving workplace needs. Rising interest in sustainable practices and energy-efficient equipment also plays a pivotal role in supporting this trend.
Australia Office Equipment Market Year-wise Growth Rate and Key Drivers
This graph highlights how the Australia Office Equipment Market has steadily grown over the past five years, supported by major growth factors.
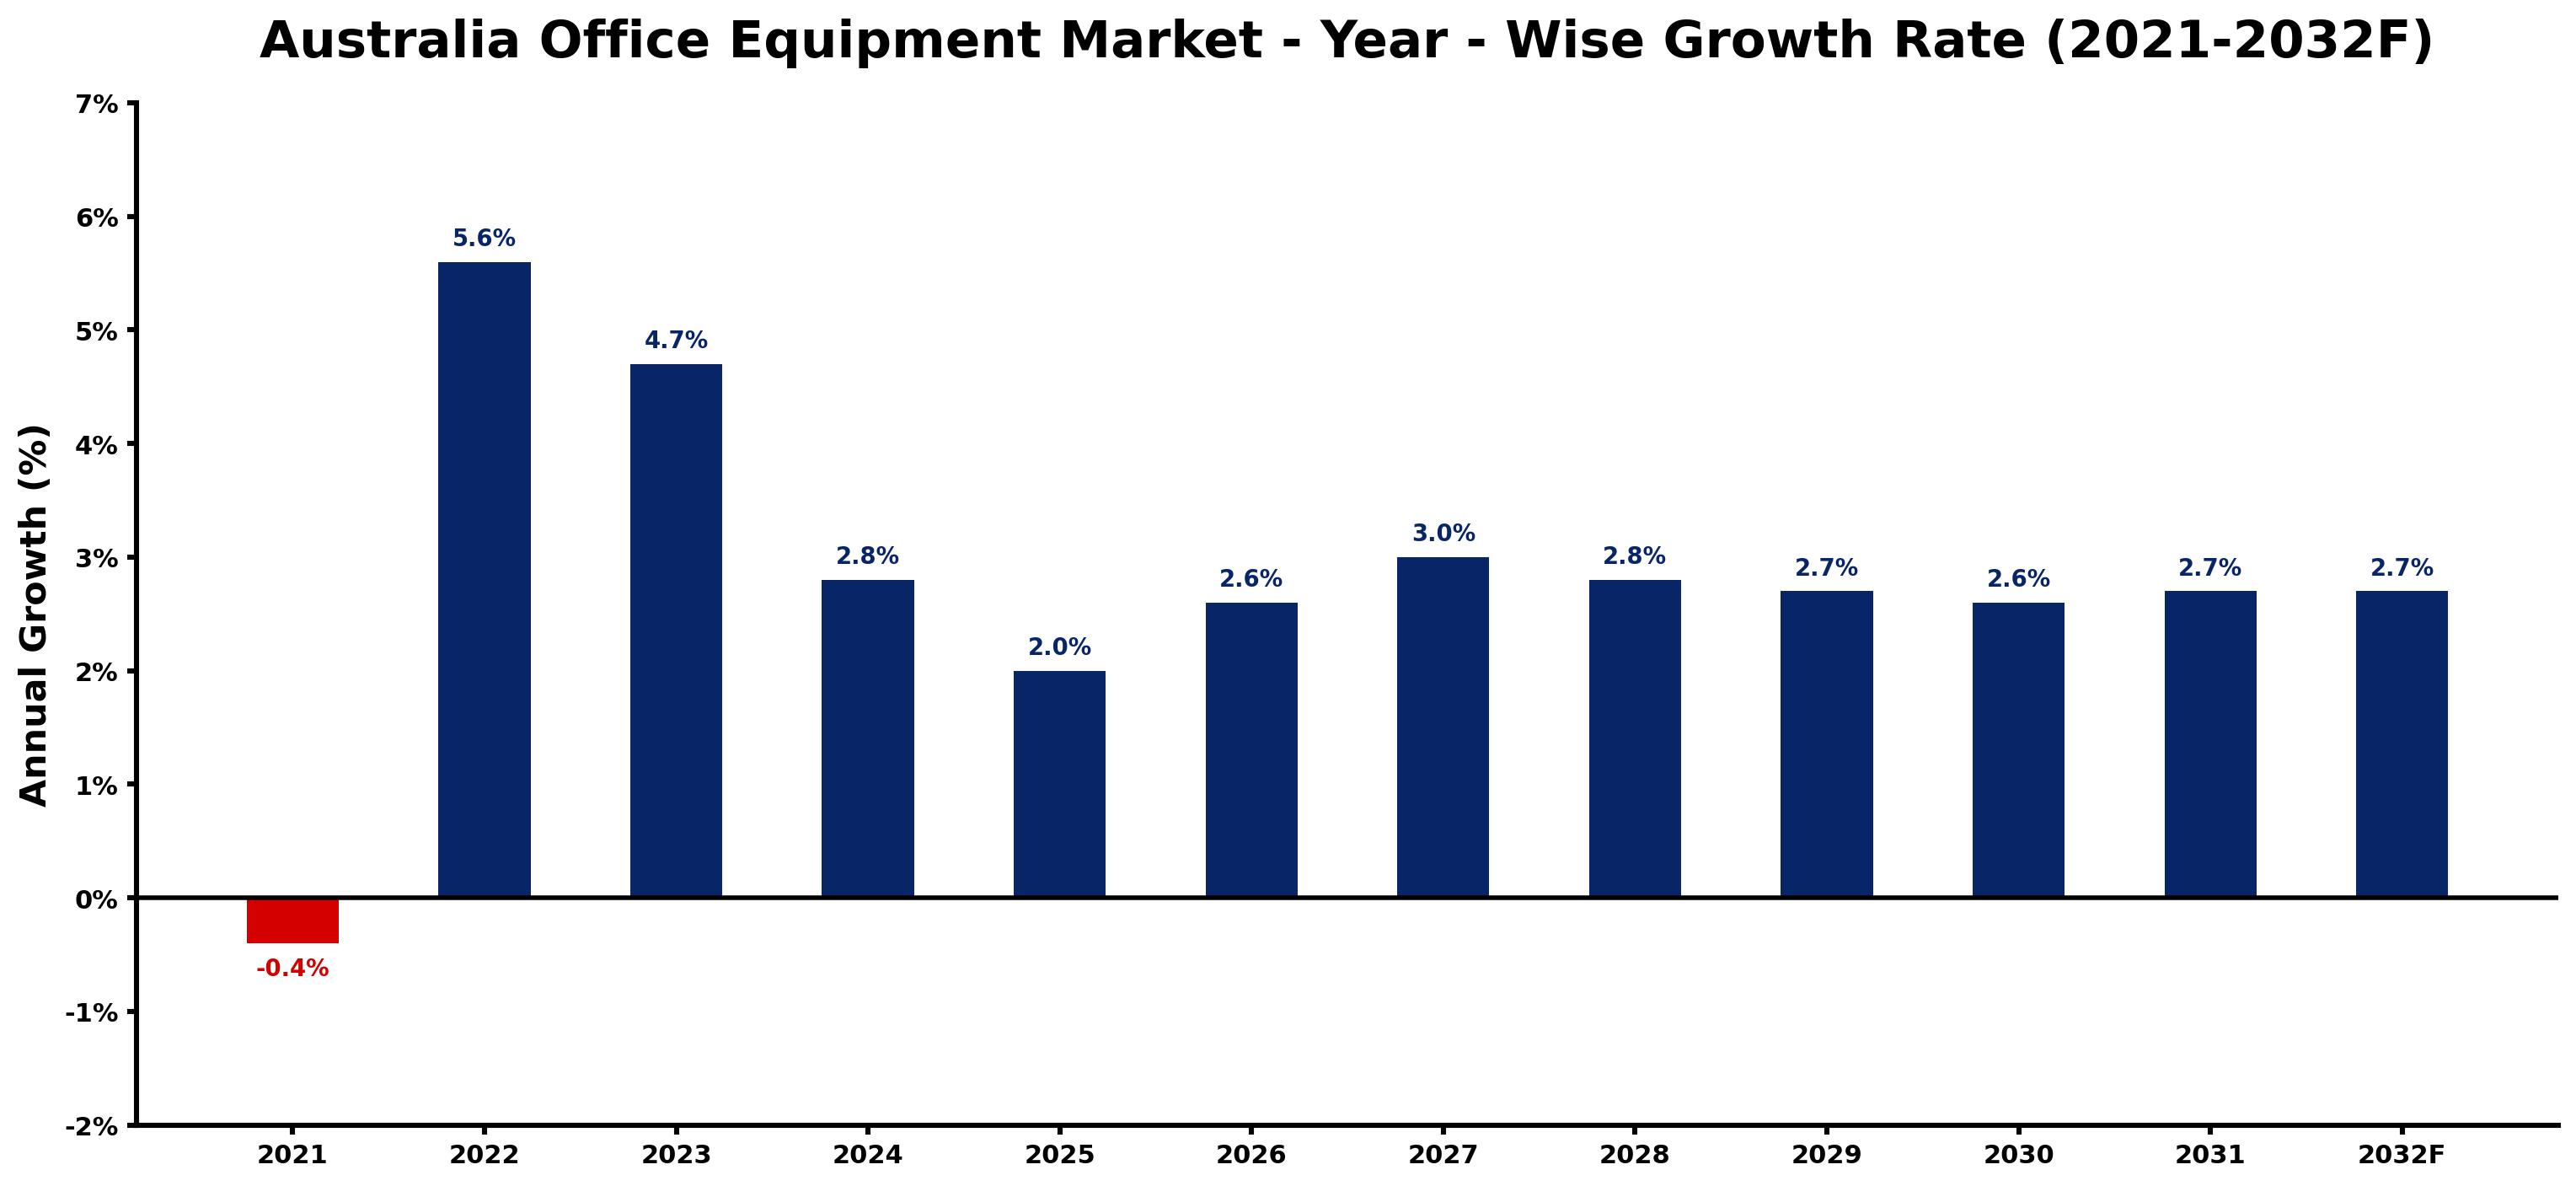
The table below presents the year wise growth rates along with the key drivers influencing the market
| Year | Growth Rate | Major Drivers |
| 2021 | -0.4% | A significant shift towards remote work decreased the demand for traditional office equipment in 2021. |
| 2022 | 5.6% | A shift towards hybrid work models led to increased demand for multifunction devices. |
| 2023 | 4.7% | Enterprises prioritized sustainability, pushing for energy-efficient office equipment solutions. |
| 2024 | 2.8% | Technological advancements enabled cloud printing solutions, enhancing operational efficiencies. |
| 2025 | 2.0% | Growing digital transformation initiatives increased the need for advanced office automation. |
| 2026 | 2.6% | Corporate environmental targets catalyzed investments in eco-friendly office equipment alternatives. |
| 2027 | 3.0% | Increased focus on employee wellness prompted a rise in ergonomically designed equipment. |
| 2028 | 2.8% | Emerging AI technologies integrated into office equipment improved productivity and connectivity. |
| 2029 | 2.7% | Supply chain resilience efforts encouraged local manufacturing of office supplies and equipment. |
| 2030 | 2.6% | Demand for customized office solutions surged amidst evolving workspace designs and layouts. |
| 2031 | 2.7% | Enhanced remote collaboration tools established new standards for office equipment functionalities. |
| 2032 | 2.7% | Economic recovery spurred business expansions, driving further investments in office equipment. |
Note - Market size estimations and growth projections presented in this report are based on 6Wresearch's advanced forecasting approach, validated with industry datasets as of June 2026.
Australia Office Equipment Market Synopsis
The Australia Office Equipment Market is projected to reach 2.6% and witness significant growth during the forecast period (2026-2032). This market is evolving rapidly, driven by the increasing adoption of hybrid work models and a shift towards multifunctional and compact devices. As businesses adapt their workspaces for a blend of remote and in-office employees, there is an observable uptick in the demand for printers, scanners, and ergonomic office furniture. The integration of technological advancements within smart office solutions, particularly cloud-integrated printers and automated document management systems, further characterizes the landscape of this market. Additionally, sustainability concerns are steering preferences towards energy-efficient and recyclable office equipment.
Australia Office Equipment Market Growth Drivers
The growth of the Australia Office Equipment Market is predominantly influenced by several key factors:
- The evolution of work environments, particularly the rise of hybrid and remote work models, has led to increased investment in office equipment that enhances productivity.
- There is a growing demand for efficient office solutions including multifunction printers, ergonomic office furniture, and digital collaboration tools that facilitate seamless interaction among teams.
- Technological innovations, such as advanced printing technologies and smart office devices, are driving market expansion by enhancing operational efficiencies.
- Sustainability trends are compelling companies to invest in energy-efficient and environmentally friendly office supplies, aligning with corporate social responsibility initiatives.
- Government initiatives promoting modernization of workplace standards and compliance with energy efficiency mandates are further catalyzing market growth.
Australia Office Equipment Market Challenges and Restraints
Despite the positive drivers, the Australia Office Equipment Market faces several challenges:
- The ongoing trend towards digitalization and the transition to paperless offices are diminishing the demand for traditional office equipment, such as printers and fax machines.
- Intense competition from global brands leads to pricing pressures, making it challenging for local manufacturers to maintain market share.
- Economic fluctuations and uncertainties, particularly during downturns, influence overall market demand and investment in office equipment.
- The rapid pace of technological advancements requires continual adaptation from manufacturers, which can be resource-intensive.
- Maintaining compliance with evolving regulations related to consumer safety and environmental standards can pose additional operational challenges.
Australia Office Equipment Market Investment Opportunities
The shifting dynamics of the Australia Office Equipment Market create various investment opportunities, notably:
- Cloud-based office solutions, which enable remote access and enhanced collaboration, represent significant potential for investment, especially as remote work continues to rise.
- Investment in energy-efficient printers and other office equipment can align with sustainability trends while meeting consumer demand for eco-friendly products.
- Smart office furniture that maximizes space and improves ergonomics could see increased development, catering to a workforce that prioritizes comfort and health.
- Opportunities also abound in the realm of automated document management systems, which facilitate improved workflow and efficiency.
- The burgeoning focus on hybrid work solutions creates avenues for investments in technologies that integrate office equipment with digital platforms.
Australia Office Equipment Market Government Investment and Initiatives
The government plays a vital role in shaping the Australia Office Equipment Market through various policies and initiatives:
- Consumer safety laws and energy efficiency standards are strictly enforced to ensure the quality and sustainability of office equipment in the market.
- Tax incentives are offered to encourage businesses to invest in energy-efficient office equipment, promoting a greener work environment.
- Import regulations are designed to uphold industry standards by restricting the entry of low-quality electronic office products, thus protecting consumers and local manufacturers.
- Workplace safety regulations mandate that ergonomic design standards are met, ensuring that office environments promote employee well-being.
- Public spending on infrastructure improvements related to office environments supports market growth by driving demand for modern office solutions.
Australia Office Equipment Market Latest Developments (May 2025 - June 2026)
In the period from May 2025 to June 2026, the Australia Office Equipment Market has undergone notable developments:
- There has been a marked increase in the adoption of cloud-integrated printing solutions, reflecting a shift in consumer preferences towards more flexible office equipment.
- Companies are progressively focusing on sustainability, with many introducing product lines that prioritize energy efficiency and recyclability.
- The proliferation of remote work has led businesses to enhance their digital collaboration tools, prompting equipment upgrades that facilitate a hybrid work environment.
- Ergonomic office furniture has gained traction as organizations strive to enhance employee productivity and comfort, resulting in increased demand in this segment.
- Technology integration continues to advance, with smart office setups enabling better management of office resources, thereby streamlining operations.
Australia Office Equipment Market - Key Attractiveness of the Report
- 10 Years of Market Numbers
- Historical Data Starting from 2022 to 2025
- Base Year: 2025
- Forecast Data until 2032
- Key Performance Indicators Impacting the Market
- Major Upcoming Developments and Projects
Key Highlights of the Report:
- Australia Office Equipment Market Outlook
- Market Size of Australia Office Equipment Market, 2025
- Forecast of Australia Office Equipment Market, 2032
- Historical Data and Forecast of Australia Office Equipment Revenues & Volume for the Period 2022-2032F
- Australia Office Equipment Market Trend Evolution
- Australia Office Equipment Market Drivers and Challenges
- Australia Office Equipment Price Trends
- Australia Office Equipment Porter's Five Forces
- Australia Office Equipment Industry Life Cycle
- Historical Data and Forecast of Australia Office Equipment Market Revenues & Volume By Type for the Period 2022-2032F
- Historical Data and Forecast of Australia Office Equipment Market Revenues & Volume By Photocopiers for the Period 2022-2032F
- Historical Data and Forecast of Australia Office Equipment Market Revenues & Volume By Printers and Scanners for the Period 2022-2032F
- Historical Data and Forecast of Australia Office Equipment Market Revenues & Volume By Fax Machines for the Period 2022-2032F
- Historical Data and Forecast of Australia Office Equipment Market Revenues & Volume By Coin and Currency Counting Devices for the Period 2022-2032F
- Historical Data and Forecast of Australia Office Equipment Market Revenues & Volume By Distribution Channel for the Period 2022-2032F
- Historical Data and Forecast of Australia Office Equipment Market Revenues & Volume By Online for the Period 2022-2032F
- Historical Data and Forecast of Australia Office Equipment Market Revenues & Volume By Offline for the Period 2022-2032F
- Australia Office Equipment Import Export Trade Statistics
- Market Opportunity Assessment By Type
- Market Opportunity Assessment By Distribution Channel
- Australia Office Equipment Top Companies Market Share
- Australia Office Equipment Competitive Benchmarking By Technical and Operational Parameters
- Australia Office Equipment Company Profiles
- Australia Office Equipment Key Strategic Recommendations
Frequently Asked Questions About the Market Study (FAQs):
The primary drivers include the rise of hybrid work models, increased demand for multifunctional devices, technological advancements, sustainability trends, and government initiatives supporting modernization.
Main challenges include the shift towards digitalization, intense competition from global brands, economic fluctuations, and the need for manufacturers to continuously adapt to technological changes.
Investment opportunities include cloud-based office solutions, energy-efficient printers, smart office furniture, and automated document management systems.
Government policies influence the market through consumer safety laws, energy efficiency regulations, incentives for sustainable products, and import restrictions on low-quality equipment.
6Wresearch actively monitors the Australia Office Equipment Market and publishes its comprehensive annual report, highlighting emerging trends, growth drivers, revenue analysis, and forecast outlook. Our insights help businesses to make data-backed strategic decisions with ongoing market dynamics. Our analysts track relevent industries related to the Australia Office Equipment Market, allowing our clients with actionable intelligence and reliable forecasts tailored to emerging regional needs.
Yes, we provide customisation as per your requirements. To learn more, feel free to contact us on sales@6wresearch.com
1 Executive Summary |
2 Introduction |
2.1 Key Highlights of the Report |
2.2 Report Description |
2.3 Market Scope & Segmentation |
2.4 Research Methodology |
2.5 Assumptions |
3 Australia Office Equipment Market Overview |
3.1 Australia Country Macro Economic Indicators |
3.2 Australia Office Equipment Market Revenues & Volume, 2022 & 2032F |
3.3 Australia Office Equipment Market - Industry Life Cycle |
3.4 Australia Office Equipment Market - Porter's Five Forces |
3.5 Australia Office Equipment Market Revenues & Volume Share, By Type, 2022 & 2032F |
3.6 Australia Office Equipment Market Revenues & Volume Share, By Distribution Channel, 2022 & 2032F |
4 Australia Office Equipment Market Dynamics |
4.1 Impact Analysis |
4.2 Market Drivers |
4.2.1 Technological advancements in office equipment |
4.2.2 Increasing demand for ergonomic office furniture and equipment |
4.2.3 Growing trend towards flexible and remote working arrangements |
4.3 Market Restraints |
4.3.1 Economic downturn affecting office expansion and renovation projects |
4.3.2 Price volatility of raw materials used in office equipment manufacturing |
4.3.3 Intense competition from online retailers impacting traditional office equipment suppliers |
5 Australia Office Equipment Market Trends |
6 Australia Office Equipment Market, By Types |
6.1 Australia Office Equipment Market, By Type |
6.1.1 Overview and Analysis |
6.1.2 Australia Office Equipment Market Revenues & Volume, By Type, 2022-2032F |
6.1.3 Australia Office Equipment Market Revenues & Volume, By Photocopiers, 2022-2032F |
6.1.4 Australia Office Equipment Market Revenues & Volume, By Printers and Scanners, 2022-2032F |
6.1.5 Australia Office Equipment Market Revenues & Volume, By Fax Machines, 2022-2032F |
6.1.6 Australia Office Equipment Market Revenues & Volume, By Coin and Currency Counting Devices, 2022-2032F |
6.2 Australia Office Equipment Market, By Distribution Channel |
6.2.1 Overview and Analysis |
6.2.2 Australia Office Equipment Market Revenues & Volume, By Online, 2022-2032F |
6.2.3 Australia Office Equipment Market Revenues & Volume, By Offline, 2022-2032F |
7 Australia Office Equipment Market Import-Export Trade Statistics |
7.1 Australia Office Equipment Market Export to Major Countries |
7.2 Australia Office Equipment Market Imports from Major Countries |
8 Australia Office Equipment Market Key Performance Indicators |
8.1 Average order value per customer |
8.2 Percentage of repeat customers |
8.3 Employee satisfaction ratings with office equipment provided |
8.4 Percentage of companies investing in sustainable office equipment practices |
8.5 Rate of adoption of smart office technologies |
9 Australia Office Equipment Market - Opportunity Assessment |
9.1 Australia Office Equipment Market Opportunity Assessment, By Type, 2022 & 2032F |
9.2 Australia Office Equipment Market Opportunity Assessment, By Distribution Channel, 2022 & 2032F |
10 Australia Office Equipment Market - Competitive Landscape |
10.1 Australia Office Equipment Market Revenue Share, By Companies, 2025 |
10.2 Australia Office Equipment Market Competitive Benchmarking, By Operating and Technical Parameters |
11 Company Profiles |
12 Recommendations |
13 Disclaimer |
Global Go To Market Strategy - 2030
Export potential enables firms to identify high-growth global markets with greater confidence by combining advanced trade intelligence with a structured quantitative methodology. The framework analyzes emerging demand trends and country-level import patterns while integrating macroeconomic and trade datasets such as GDP and population forecasts, bilateral import–export flows, tariff structures, elasticity differentials between developed and developing economies, geographic distance, and import demand projections. Using weighted trade values from 2020–2024 as the base period to project country-to-country export potential for 2030, these inputs are operationalized through calculated drivers such as gravity model parameters, tariff impact factors, and projected GDP per-capita growth. Through an analysis of hidden potentials, demand hotspots, and market conditions that are most favorable to success, this method enables firms to focus on target countries, maximize returns, and global expansion with data, backed by accuracy.
By factoring in the projected importer demand gap that is currently unmet and could be potential opportunity, it identifies the potential for the Exporter (Country) among 190 countries, against the general trade analysis, which identifies the biggest importer or exporter.
To discover high-growth global markets and optimize your business strategy:
Click Here
Pricing
- Single User License$ 1,995
- Department License$ 2,400
- Site License$ 3,120
- Global License$ 3,795

Leadership Perspectives from Industry Events
Search
Thought Leadership and Analyst Meet


Our Clients
6WResearch In News
- India Air Conditioner Market Set for Strong Rebound in 2026 After Weather-Led Correction and GST-Driven Recovery: 6Wresearch
- ADAS in India: How Automatic Emergency Braking, Blind Spot Detection & Driver Monitoring are Transforming Road Safety
- Doha a strategic location for EV manufacturing hub: IPA Qatar
- Demand for luxury TVs surging in the GCC, says Samsung
- Empowering Growth: The Thriving Journey of Bangladesh’s Cable Industry
- Demand for luxury TVs surging in the GCC, says Samsung
Latest Reports
- Nicaragua RPG Gaming Market (2026-2032)
- New Zealand RPG Gaming Market (2026-2032)
- Netherlands RPG Gaming Market (2026-2032)
- Nauru RPG Gaming Market (2026-2032)
- Namibia RPG Gaming Market (2026-2032)
- Mozambique RPG Gaming Market (2026-2032)
- Montenegro RPG Gaming Market (2026-2032)
- Mongolia RPG Gaming Market (2026-2032)
- Monaco RPG Gaming Market (2026-2032)
- Micronesia RPG Gaming Market (2026-2032)
Industry Events and Analyst Meet

HIMTEX 2026

India Refining Summit 2026

India EV Show 2026

EV tech India Expo 2026

Auto Tech Asia 2026
Whitepaper
- Middle East & Africa Commercial Security Market Click here to view more.
- Middle East & Africa Fire Safety Systems & Equipment Market Click here to view more.
- GCC Drone Market Click here to view more.
- Middle East Lighting Fixture Market Click here to view more.
- GCC Physical & Perimeter Security Market Click here to view more.