Australia Organic Tea Premixes Market (2026-2032) | Segmentation, Industry, Competitive Landscape, Size & Revenue, Growth, Companies, Forecast, Trends, Value, Outlook, Analysis, Share
Market Forecast By Type (No Sugar Tea Premixes, With Sugar Tea Premixes), By Flavour (Ginger, Lemon Grass, Elaichi, Masala, Cardamon, Regular, Combo), By Form (Powder, Paste, Granules), By End-Use (Residential, Commercial), By Sales Channel (Hypermarket/Supermarket, Convenience Store, Drug Stores, Specialty Stores, Traditional Grocery Store, Online Stores) And Competitive Landscape
| Product Code: ETC6187144 | Publication Date: Sep 2024 | Updated Date: Mar 2026 | Product Type: Market Research Report | |
| Publisher: 6Wresearch | Author: Vasudha | No. of Pages: 75 | No. of Figures: 35 | No. of Tables: 20 |
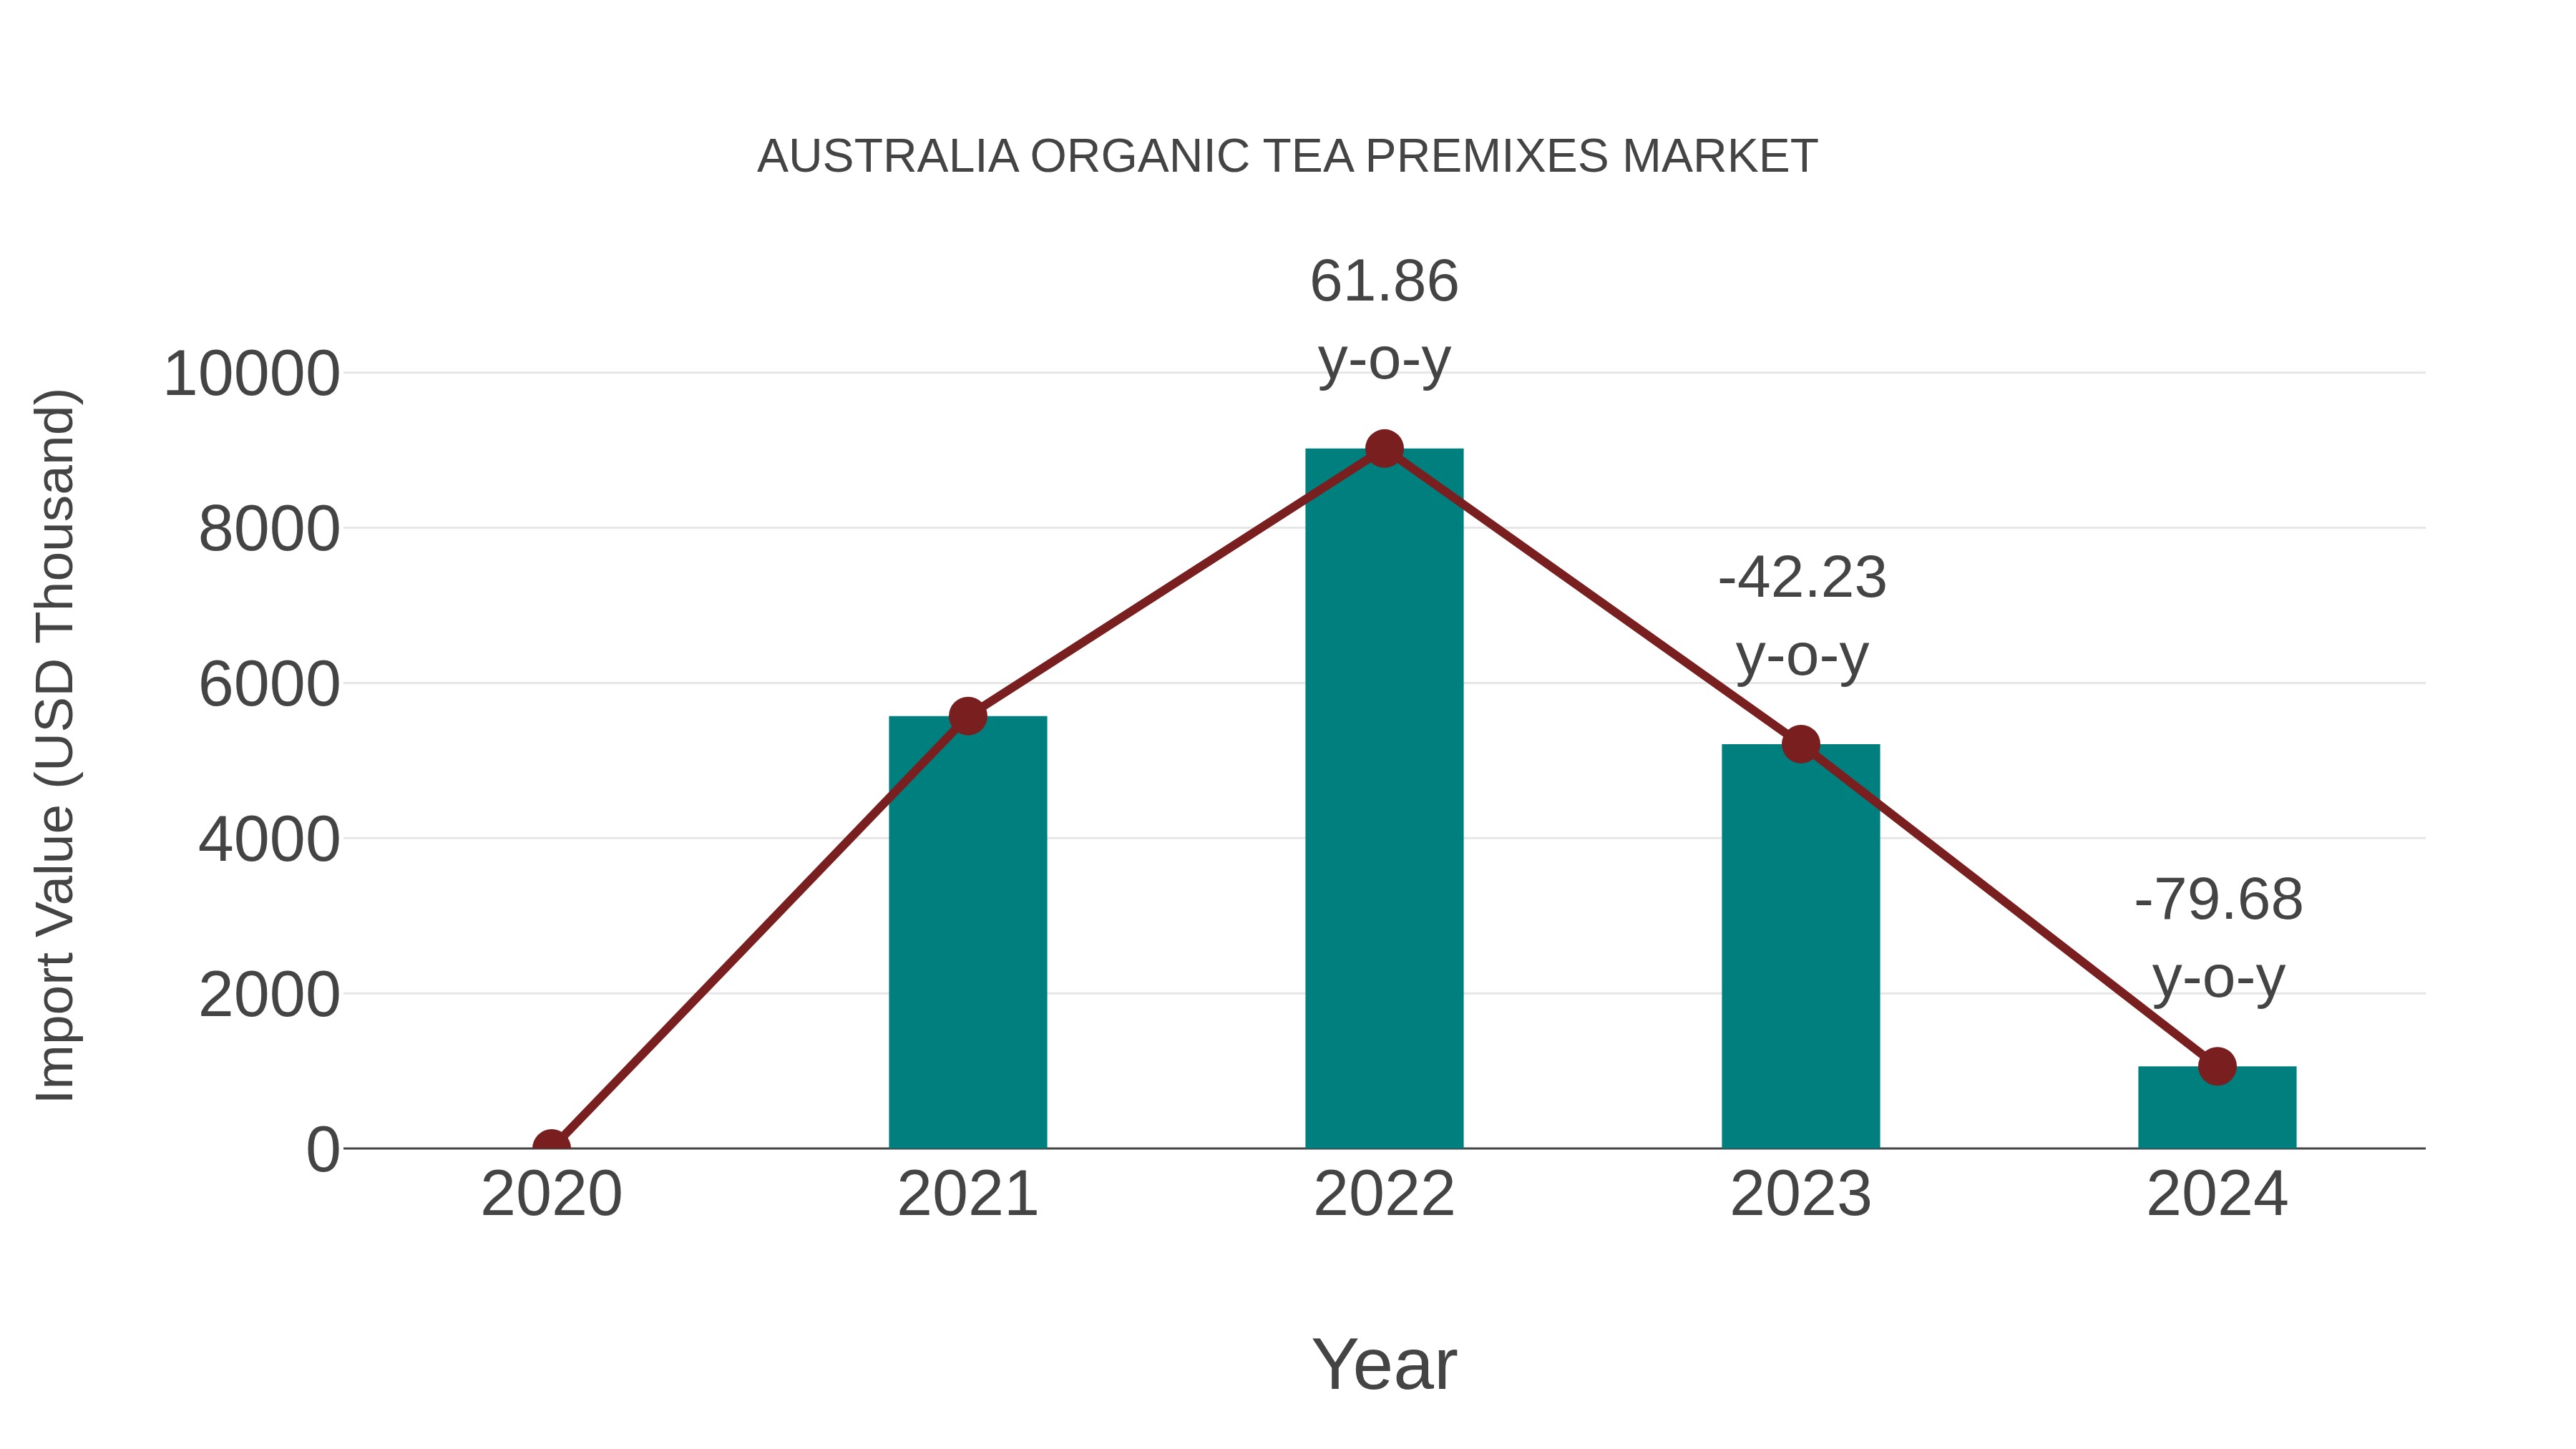
Australia Organic Tea Premixes Market: Import Trend Analysis
In the Australia organic tea premixes market, the import trend saw a notable decline from 2023 to 2024, with a growth rate of -79.68%. The compound annual growth rate (CAGR) for imports between 2020 and 2024 stood at -42.51%. This substantial downturn in import momentum could be attributed to shifting consumer preferences towards local products or changes in trade policies impacting international tea imports.
Australia Organic Tea Premixes Market Overview
The Australia Organic Tea Premixes Market is gaining traction, especially among busy consumers seeking convenience without compromising health. These premixes, often in powder or liquid form, allow for easy preparation of tea with consistent flavor. The market growth is fueled by innovations in flavors, functional ingredients, and attractive packaging. However, maintaining the integrity of organic certifications throughout the production and supply chain is a significant challenge. Additionally, ensuring affordability and shelf stability for natural ingredients can impact market dynamics.
Trends of the market
In Australia, the organic tea premixes market is gaining popularity, particularly among health-conscious, time-poor consumers looking for convenience without compromising quality. The trend leans toward ready-to-mix formulations with organic certification and added health benefits such as detoxification, immunity-boosting, and digestion support. Brands are also innovating with flavors and expanding into vegan and allergen-free segments, while the proliferation of online retail and health food stores has made these products more accessible.
Challenges of the market
In the organic tea premixes segment, a major hurdle is ensuring the stability and shelf-life of premixed organic ingredients without using synthetic preservatives. This limits the range of formulations and increases manufacturing complexity. Additionally, there is a lack of awareness among Australia consumers about the availability and benefits of organic premixes, making market expansion slow and challenging.
Investment opportunities in the Market
The organic tea premixes market in Australia presents unique investment opportunities due to the rising popularity of convenience products that align with health-conscious lifestyles. Organic tea premixes cater to consumers seeking quick and easy ways to enjoy organic tea without compromising quality. With a growing number of consumers preferring ready-to-drink tea options, companies in the beverage industry could benefit by expanding their product lines to include organic tea premixes. Additionally, innovation in packaging and flavor varieties could differentiate brands in a competitive market, attracting a loyal customer base.
Government Policy of the market
Government policies related to the organic tea premixes market in Australia emphasize food safety, consumer protection, and the promotion of organic agriculture. The Australia government supports the organic tea premix industry through regulations that ensure organic certification and food labeling standards are met. This market benefits from public initiatives promoting healthy and sustainable food products. Subsidies and grants for companies that create organic tea blends and premixes are common, as the government seeks to support innovation in organic beverage production.
Key Highlights of the Report:
- Australia Organic Tea Premixes Market Outlook
- Market Size of Australia Organic Tea Premixes Market, 2025
- Forecast of Australia Organic Tea Premixes Market, 2032
- Historical Data and Forecast of Australia Organic Tea Premixes Revenues & Volume for the Period 2022 - 2032F
- Australia Organic Tea Premixes Market Trend Evolution
- Australia Organic Tea Premixes Market Drivers and Challenges
- Australia Organic Tea Premixes Price Trends
- Australia Organic Tea Premixes Porter's Five Forces
- Australia Organic Tea Premixes Industry Life Cycle
- Historical Data and Forecast of Australia Organic Tea Premixes Market Revenues & Volume By Type for the Period 2022 - 2032F
- Historical Data and Forecast of Australia Organic Tea Premixes Market Revenues & Volume By No Sugar Tea Premixes for the Period 2022 - 2032F
- Historical Data and Forecast of Australia Organic Tea Premixes Market Revenues & Volume By With Sugar Tea Premixes for the Period 2022 - 2032F
- Historical Data and Forecast of Australia Organic Tea Premixes Market Revenues & Volume By Flavour for the Period 2022 - 2032F
- Historical Data and Forecast of Australia Organic Tea Premixes Market Revenues & Volume By Ginger for the Period 2022 - 2032F
- Historical Data and Forecast of Australia Organic Tea Premixes Market Revenues & Volume By Lemon Grass for the Period 2022 - 2032F
- Historical Data and Forecast of Australia Organic Tea Premixes Market Revenues & Volume By Elaichi for the Period 2022 - 2032F
- Historical Data and Forecast of Australia Organic Tea Premixes Market Revenues & Volume By Masala for the Period 2022 - 2032F
- Historical Data and Forecast of Australia Organic Tea Premixes Market Revenues & Volume By Cardamon for the Period 2022 - 2032F
- Historical Data and Forecast of Australia Organic Tea Premixes Market Revenues & Volume By Regular for the Period 2022 - 2032F
- Historical Data and Forecast of Australia Organic Tea Premixes Market Revenues & Volume By Combo for the Period 2022 - 2032F
- Historical Data and Forecast of Australia Organic Tea Premixes Market Revenues & Volume By Form for the Period 2022 - 2032F
- Historical Data and Forecast of Australia Organic Tea Premixes Market Revenues & Volume By Powder for the Period 2022 - 2032F
- Historical Data and Forecast of Australia Organic Tea Premixes Market Revenues & Volume By Paste for the Period 2022 - 2032F
- Historical Data and Forecast of Australia Organic Tea Premixes Market Revenues & Volume By Granules for the Period 2022 - 2032F
- Historical Data and Forecast of Australia Organic Tea Premixes Market Revenues & Volume By End-Use for the Period 2022 - 2032F
- Historical Data and Forecast of Australia Organic Tea Premixes Market Revenues & Volume By Residential for the Period 2022 - 2032F
- Historical Data and Forecast of Australia Organic Tea Premixes Market Revenues & Volume By Commercial for the Period 2022 - 2032F
- Historical Data and Forecast of Australia Organic Tea Premixes Market Revenues & Volume By Sales Channel for the Period 2022 - 2032F
- Historical Data and Forecast of Australia Organic Tea Premixes Market Revenues & Volume By Hypermarket/Supermarket for the Period 2022 - 2032F
- Historical Data and Forecast of Australia Organic Tea Premixes Market Revenues & Volume By Convenience Store for the Period 2022 - 2032F
- Historical Data and Forecast of Australia Organic Tea Premixes Market Revenues & Volume By Drug Stores for the Period 2022 - 2032F
- Historical Data and Forecast of Australia Organic Tea Premixes Market Revenues & Volume By Specialty Stores for the Period 2022 - 2032F
- Historical Data and Forecast of Australia Organic Tea Premixes Market Revenues & Volume By Traditional Grocery Store for the Period 2022 - 2032F
- Historical Data and Forecast of Australia Organic Tea Premixes Market Revenues & Volume By Online Stores for the Period 2022 - 2032F
- Australia Organic Tea Premixes Import Export Trade Statistics
- Market Opportunity Assessment By Type
- Market Opportunity Assessment By Flavour
- Market Opportunity Assessment By Form
- Market Opportunity Assessment By End-Use
- Market Opportunity Assessment By Sales Channel
- Australia Organic Tea Premixes Top Companies Market Share
- Australia Organic Tea Premixes Competitive Benchmarking By Technical and Operational Parameters
- Australia Organic Tea Premixes Company Profiles
- Australia Organic Tea Premixes Key Strategic Recommendations
Australia Organic Tea Premixes Market (2026-2032): FAQs
6Wresearch actively monitors the Australia Organic Tea Premixes Market and publishes its comprehensive annual report, highlighting emerging trends, growth drivers, revenue analysis, and forecast outlook. Our insights help businesses to make data-backed strategic decisions with ongoing market dynamics. Our analysts track relevent industries related to the Australia Organic Tea Premixes Market, allowing our clients with actionable intelligence and reliable forecasts tailored to emerging regional needs.
Yes, we provide customisation as per your requirements. To learn more, feel free to contact us on sales@6wresearch.com
1 Executive Summary |
2 Introduction |
2.1 Key Highlights of the Report |
2.2 Report Description |
2.3 Market Scope & Segmentation |
2.4 Research Methodology |
2.5 Assumptions |
3 Australia Organic Tea Premixes Market Overview |
3.1 Australia Country Macro Economic Indicators |
3.2 Australia Organic Tea Premixes Market Revenues & Volume, 2022 & 2032F |
3.3 Australia Organic Tea Premixes Market - Industry Life Cycle |
3.4 Australia Organic Tea Premixes Market - Porter's Five Forces |
3.5 Australia Organic Tea Premixes Market Revenues & Volume Share, By Type, 2022 & 2032F |
3.6 Australia Organic Tea Premixes Market Revenues & Volume Share, By Flavour, 2022 & 2032F |
3.7 Australia Organic Tea Premixes Market Revenues & Volume Share, By Form, 2022 & 2032F |
3.8 Australia Organic Tea Premixes Market Revenues & Volume Share, By End-Use, 2022 & 2032F |
3.9 Australia Organic Tea Premixes Market Revenues & Volume Share, By Sales Channel, 2022 & 2032F |
4 Australia Organic Tea Premixes Market Dynamics |
4.1 Impact Analysis |
4.2 Market Drivers |
4.2.1 Increasing health consciousness and awareness among consumers |
4.2.2 Growing preference for organic and natural products |
4.2.3 Rising demand for convenient and ready-to-drink beverage options |
4.2.4 Expansion of distribution channels and availability in retail stores |
4.2.5 Innovation and product development in the organic tea premixes market |
4.3 Market Restraints |
4.3.1 High pricing compared to conventional tea premixes |
4.3.2 Limited awareness and education about the benefits of organic tea premixes |
4.3.3 Challenges in maintaining consistent supply of organic ingredients |
4.3.4 Competition from other beverage categories like energy drinks and flavored water |
4.3.5 Regulatory hurdles and certifications required for organic products |
5 Australia Organic Tea Premixes Market Trends |
6 Australia Organic Tea Premixes Market, By Types |
6.1 Australia Organic Tea Premixes Market, By Type |
6.1.1 Overview and Analysis |
6.1.2 Australia Organic Tea Premixes Market Revenues & Volume, By Type, 2022 - 2032F |
6.1.3 Australia Organic Tea Premixes Market Revenues & Volume, By No Sugar Tea Premixes, 2022 - 2032F |
6.1.4 Australia Organic Tea Premixes Market Revenues & Volume, By With Sugar Tea Premixes, 2022 - 2032F |
6.2 Australia Organic Tea Premixes Market, By Flavour |
6.2.1 Overview and Analysis |
6.2.2 Australia Organic Tea Premixes Market Revenues & Volume, By Ginger, 2022 - 2032F |
6.2.3 Australia Organic Tea Premixes Market Revenues & Volume, By Lemon Grass, 2022 - 2032F |
6.2.4 Australia Organic Tea Premixes Market Revenues & Volume, By Elaichi, 2022 - 2032F |
6.2.5 Australia Organic Tea Premixes Market Revenues & Volume, By Masala, 2022 - 2032F |
6.2.6 Australia Organic Tea Premixes Market Revenues & Volume, By Cardamon, 2022 - 2032F |
6.2.7 Australia Organic Tea Premixes Market Revenues & Volume, By Regular, 2022 - 2032F |
6.3 Australia Organic Tea Premixes Market, By Form |
6.3.1 Overview and Analysis |
6.3.2 Australia Organic Tea Premixes Market Revenues & Volume, By Powder, 2022 - 2032F |
6.3.3 Australia Organic Tea Premixes Market Revenues & Volume, By Paste, 2022 - 2032F |
6.3.4 Australia Organic Tea Premixes Market Revenues & Volume, By Granules, 2022 - 2032F |
6.4 Australia Organic Tea Premixes Market, By End-Use |
6.4.1 Overview and Analysis |
6.4.2 Australia Organic Tea Premixes Market Revenues & Volume, By Residential, 2022 - 2032F |
6.4.3 Australia Organic Tea Premixes Market Revenues & Volume, By Commercial, 2022 - 2032F |
6.5 Australia Organic Tea Premixes Market, By Sales Channel |
6.5.1 Overview and Analysis |
6.5.2 Australia Organic Tea Premixes Market Revenues & Volume, By Hypermarket/Supermarket, 2022 - 2032F |
6.5.3 Australia Organic Tea Premixes Market Revenues & Volume, By Convenience Store, 2022 - 2032F |
6.5.4 Australia Organic Tea Premixes Market Revenues & Volume, By Drug Stores, 2022 - 2032F |
6.5.5 Australia Organic Tea Premixes Market Revenues & Volume, By Specialty Stores, 2022 - 2032F |
6.5.6 Australia Organic Tea Premixes Market Revenues & Volume, By Traditional Grocery Store, 2022 - 2032F |
6.5.7 Australia Organic Tea Premixes Market Revenues & Volume, By Online Stores, 2022 - 2032F |
7 Australia Organic Tea Premixes Market Import-Export Trade Statistics |
7.1 Australia Organic Tea Premixes Market Export to Major Countries |
7.2 Australia Organic Tea Premixes Market Imports from Major Countries |
8 Australia Organic Tea Premixes Market Key Performance Indicators |
8.1 Consumer engagement on social media platforms for organic tea premix brands |
8.2 Number of new product launches and innovations in the organic tea premixes segment |
8.3 Growth in the number of organic tea premixes available in mainstream supermarkets and specialty stores |
8.4 Increase in online searches and website traffic for organic tea premix products |
8.5 Participation and attendance in organic and wellness-related events and expos |
9 Australia Organic Tea Premixes Market - Opportunity Assessment |
9.1 Australia Organic Tea Premixes Market Opportunity Assessment, By Type, 2022 & 2032F |
9.2 Australia Organic Tea Premixes Market Opportunity Assessment, By Flavour, 2022 & 2032F |
9.3 Australia Organic Tea Premixes Market Opportunity Assessment, By Form, 2022 & 2032F |
9.4 Australia Organic Tea Premixes Market Opportunity Assessment, By End-Use, 2022 & 2032F |
9.5 Australia Organic Tea Premixes Market Opportunity Assessment, By Sales Channel, 2022 & 2032F |
10 Australia Organic Tea Premixes Market - Competitive Landscape |
10.1 Australia Organic Tea Premixes Market Revenue Share, By Companies, 2025 |
10.2 Australia Organic Tea Premixes Market Competitive Benchmarking, By Operating and Technical Parameters |
11 Company Profiles |
12 Recommendations |
13 Disclaimer |
Export potential assessment - trade Analytics for 2030
Export potential enables firms to identify high-growth global markets with greater confidence by combining advanced trade intelligence with a structured quantitative methodology. The framework analyzes emerging demand trends and country-level import patterns while integrating macroeconomic and trade datasets such as GDP and population forecasts, bilateral import–export flows, tariff structures, elasticity differentials between developed and developing economies, geographic distance, and import demand projections. Using weighted trade values from 2020–2024 as the base period to project country-to-country export potential for 2030, these inputs are operationalized through calculated drivers such as gravity model parameters, tariff impact factors, and projected GDP per-capita growth. Through an analysis of hidden potentials, demand hotspots, and market conditions that are most favorable to success, this method enables firms to focus on target countries, maximize returns, and global expansion with data, backed by accuracy.
By factoring in the projected importer demand gap that is currently unmet and could be potential opportunity, it identifies the potential for the Exporter (Country) among 190 countries, against the general trade analysis, which identifies the biggest importer or exporter.
To discover high-growth global markets and optimize your business strategy:
Click Here
Pricing
- Single User License$ 1,995
- Department License$ 2,400
- Site License$ 3,120
- Global License$ 3,795

Search
Thought Leadership and Analyst Meet


Our Clients
Latest Reports
- China Electric Appliance Rental Market (2026-2032) | Trends, Revenue, Growth, Challenges, Size, Value, Outlook, Pricing, Strategy, Insights, Restraints, segmentation, Companies, Investment Opportunities, Analysis, Demand, Drivers, Competition, Forecast, Share
- Chile Electric Appliance Rental Market (2026-2032) | Outlook, Competition, Drivers, Strategy, Revenue, Analysis, Value, Pricing, Restraints, Size, Demand, Share, Growth, Forecast, Challenges, Insights, Investment Opportunities, Companies, Trends, segmentation
- Cambodia Electric Appliance Rental Market (2026-2032) | Companies, Analysis, Restraints, Pricing, Insights, Challenges, Outlook, Strategy, Forecast, Trends, Competition, Value, Revenue, Investment Opportunities, segmentation, Drivers, Size, Demand, Growth, Share
- Brazil Electric Appliance Rental Market (2026-2032) | Revenue, Strategy, Forecast, Companies, segmentation, Competition, Size, Investment Opportunities, Pricing, Restraints, Outlook, Challenges, Analysis, Drivers, Value, Demand, Insights, Trends, Growth, Share
- Bangladesh Electric Appliance Rental Market (2026-2032) | Drivers, Forecast, Investment Opportunities, Strategy, Insights, Demand, Challenges, Outlook, Trends, Competition, Value, Revenue, Size, Pricing, Analysis, Companies, Restraints, segmentation, Share, Growth
- Bahrain Electric Appliance Rental Market (2026-2032) | Outlook, Size, Competition, Restraints, Drivers, Value, Trends, Investment Opportunities, Insights, Forecast, Revenue, Strategy, Growth, Share, Demand, Analysis, Challenges, Companies, segmentation, Pricing
- Azerbaijan Electric Appliance Rental Market (2026-2032) | Trends, Investment Opportunities, Restraints, Insights, Strategy, Competition, Value, Growth, Demand, Drivers, Analysis, Forecast, Size, Share, Outlook, segmentation, Pricing, Challenges, Revenue, Companies
- Australia Electric Appliance Rental Market (2026-2032) | Challenges, Restraints, Forecast, Demand, Size, Competition, Pricing, Investment Opportunities, Revenue, Trends, Drivers, Growth, Outlook, Analysis, Strategy, Value, segmentation, Insights, Companies, Share
- Argentina Electric Appliance Rental Market (2026-2032) | Growth, Trends, Insights, Outlook, Forecast, Size, Drivers, Analysis, Restraints, Challenges, Share, Revenue, Investment Opportunities, Strategy, Demand, Value, Companies, segmentation, Competition, Pricing
- Algeria Electric Appliance Rental Market (2026-2032) | Share, Size, Value, Strategy, Competition, Outlook, Challenges, Companies, Trends, Pricing, Insights, Forecast, Investment Opportunities, Revenue, Growth, Restraints, segmentation, Analysis, Demand, Drivers
Industry Events and Analyst Meet

HIMTEX 2026

India Refining Summit 2026

India EV Show 2026

EV tech India Expo 2026

Auto Tech Asia 2026
Whitepaper
- Middle East & Africa Commercial Security Market Click here to view more.
- Middle East & Africa Fire Safety Systems & Equipment Market Click here to view more.
- GCC Drone Market Click here to view more.
- Middle East Lighting Fixture Market Click here to view more.
- GCC Physical & Perimeter Security Market Click here to view more.
6WResearch In News
- Doha a strategic location for EV manufacturing hub: IPA Qatar
- Demand for luxury TVs surging in the GCC, says Samsung
- Empowering Growth: The Thriving Journey of Bangladesh’s Cable Industry
- Demand for luxury TVs surging in the GCC, says Samsung
- Video call with a traditional healer? Once unthinkable, it’s now common in South Africa
- Intelligent Buildings To Smooth GCC’s Path To Net Zero