Australia Paints for Non-Plastic Application for Paints Market (2026-2032) | Industry, Forecast, Value, Competitive Landscape, Outlook, Growth, Segmentation, Trends, Companies, Size & Revenue, Analysis, Share
Market Forecast By Product (Acrylic, Polyurethanes, Polyesters, Epoxy, Alkyd, Wood Colorant, Synthetic, Oil Group) And Competitive Landscape
| Product Code: ETC6187515 | Publication Date: Sep 2024 | Updated Date: Mar 2026 | Product Type: Market Research Report | |
| Publisher: 6Wresearch | Author: Sachin Kumar Rai | No. of Pages: 75 | No. of Figures: 35 | No. of Tables: 20 |
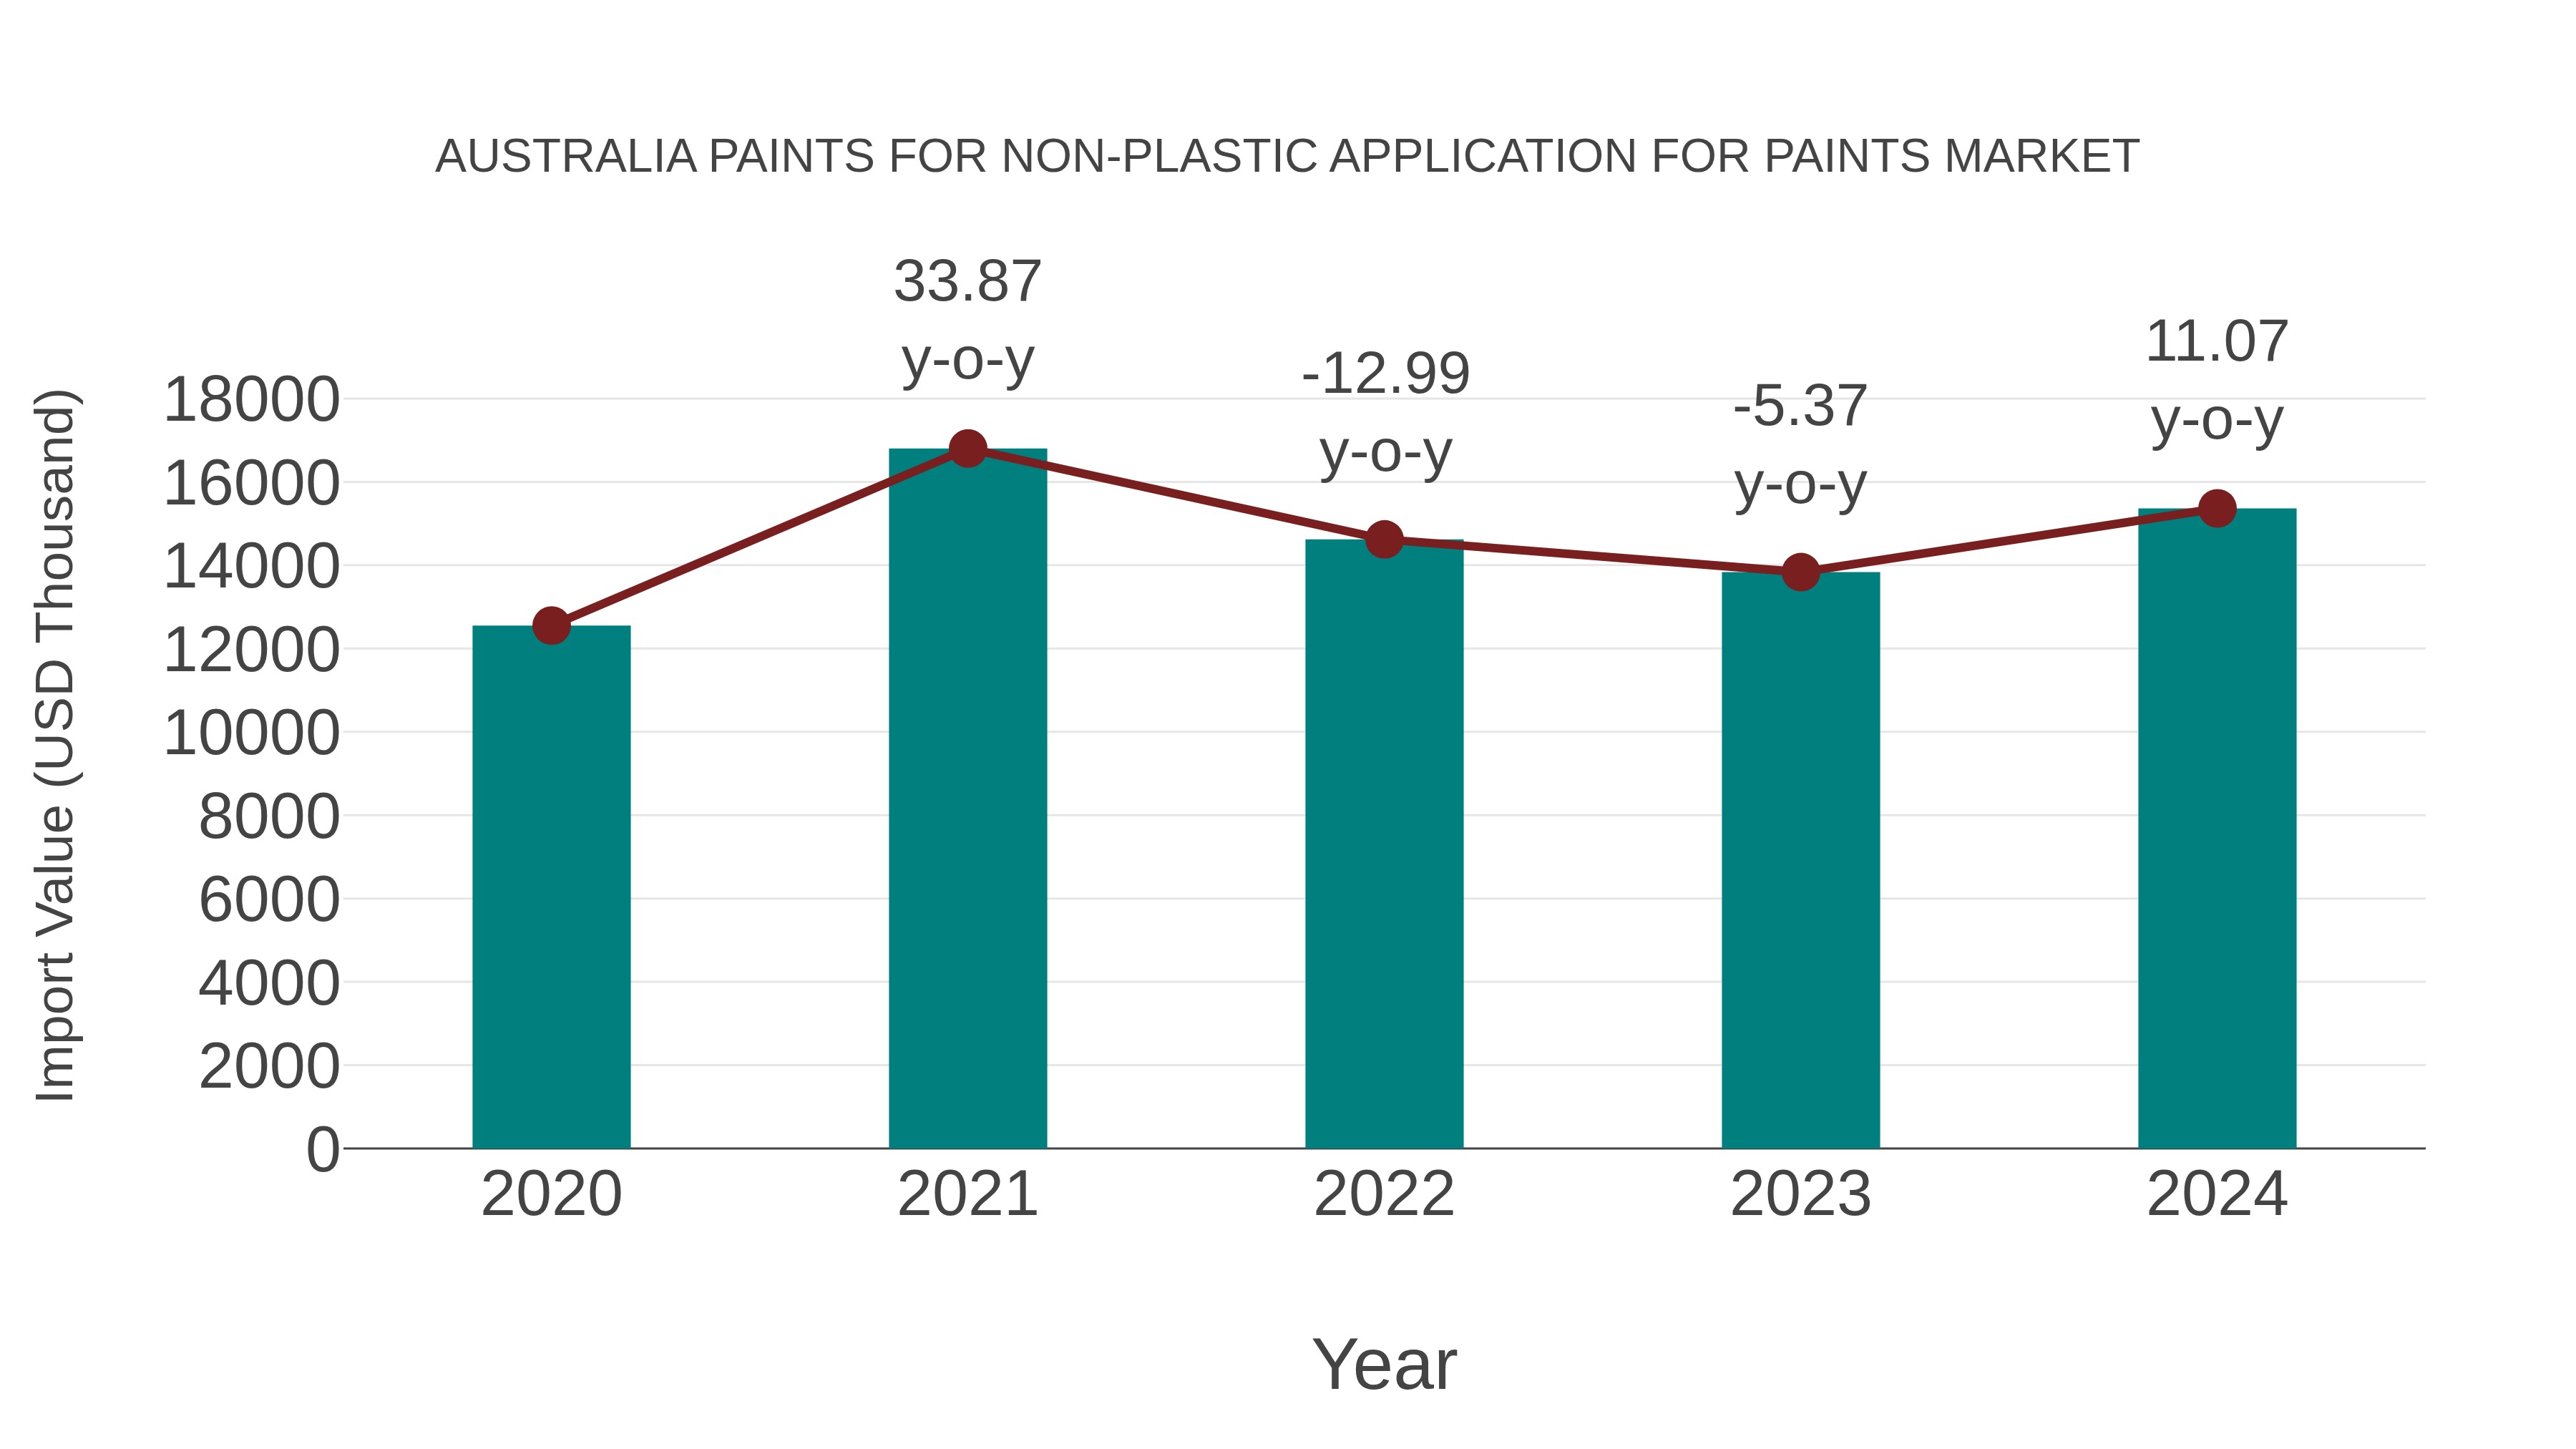
Australia Paints for Non-plastic Application for Paints Market: Import Trend Analysis
Australia`s import trend for non-plastic paints for the paints market saw a growth rate of 11.07% from 2023 to 2024, with a compound annual growth rate (CAGR) of 5.19% from 2020 to 2024. This upward momentum can be attributed to the increasing demand for environmentally friendly paint products in response to stricter regulations on volatile organic compounds in paints.
Australia Paints For Non Plastic Application For Paints Market Overview
This market segment focuses on paints specifically formulated for surfaces other than plastics, such as metals, wood, concrete, and masonry in Australia. These paints cater to industries including construction, infrastructure, and manufacturing, where surface-specific formulations are critical for performance, longevity, and aesthetics. The non-plastic paints market is influenced by factors such as climate conditions, environmental regulations, and the adoption of low-VOC (volatile organic compound) products to reduce environmental impact. Technological advancements in coating technologies, including anti-fungal and anti-corrosive properties, further fuel the demand in this segment.
Trends of the market
In the non-plastic paints segment, there is a rising focus on specialty paints formulated for wood, metal, and concrete surfaces. Innovations emphasize enhanced adhesion, corrosion resistance, and long-lasting protection. The demand for water-based and environmentally safe paint formulations is increasing due to stringent environmental norms and consumer awareness regarding sustainability.
Challenges of the market
In the non-plastic paints application sector, one of the key challenges is the limited compatibility of innovative paint formulations with diverse substrates, especially in construction and automotive industries. Additionally, the regulatory constraints concerning volatile organic compounds (VOCs) demand frequent reformulation, adding to research and development costs. There is also a skills gap in applying specialized paints, impacting the quality and consistency of application in some industrial use cases.
Investment opportunities in the Market
The market for paints designed for non-plastic applications in Australia offers promising investment avenues due to growing preferences for specialty coatings in wood, metal, and concrete surfaces. Rising awareness about protective and decorative coatings in sectors such as building, furniture, and manufacturing enhances demand. Investments in research and development of low-VOC, environmentally safe, and high-performance paints can capture a niche market, addressing stricter regulatory standards and sustainability goals.
Government Policy of the market
Government policies for non-plastic application paints in Australia focus on environmental compliance and safety standards through AICIS and state-level environmental protection authorities. These regulations ensure that paints used on wood, metal, or concrete adhere to sustainability standards. The government also promotes water-based and lead-free formulations via procurement preferences and voluntary green certification programs such as GECA (Good Environmental Choice Australia).
Key Highlights of the Report:
- Australia Paints for Non-Plastic Application for Paints Market Outlook
- Market Size of Australia Paints for Non-Plastic Application for Paints Market, 2025
- Forecast of Australia Paints for Non-Plastic Application for Paints Market, 2032
- Historical Data and Forecast of Australia Paints for Non-Plastic Application for Paints Revenues & Volume for the Period 2022 - 2032F
- Australia Paints for Non-Plastic Application for Paints Market Trend Evolution
- Australia Paints for Non-Plastic Application for Paints Market Drivers and Challenges
- Australia Paints for Non-Plastic Application for Paints Price Trends
- Australia Paints for Non-Plastic Application for Paints Porter's Five Forces
- Australia Paints for Non-Plastic Application for Paints Industry Life Cycle
- Historical Data and Forecast of Australia Paints for Non-Plastic Application for Paints Market Revenues & Volume By Product for the Period 2022 - 2032F
- Historical Data and Forecast of Australia Paints for Non-Plastic Application for Paints Market Revenues & Volume By Acrylic for the Period 2022 - 2032F
- Historical Data and Forecast of Australia Paints for Non-Plastic Application for Paints Market Revenues & Volume By Polyurethanes for the Period 2022 - 2032F
- Historical Data and Forecast of Australia Paints for Non-Plastic Application for Paints Market Revenues & Volume By Polyesters for the Period 2022 - 2032F
- Historical Data and Forecast of Australia Paints for Non-Plastic Application for Paints Market Revenues & Volume By Epoxy for the Period 2022 - 2032F
- Historical Data and Forecast of Australia Paints for Non-Plastic Application for Paints Market Revenues & Volume By Alkyd for the Period 2022 - 2032F
- Historical Data and Forecast of Australia Paints for Non-Plastic Application for Paints Market Revenues & Volume By Wood Colorant for the Period 2022 - 2032F
- Historical Data and Forecast of Australia Paints for Non-Plastic Application for Paints Market Revenues & Volume By Synthetic for the Period 2022 - 2032F
- Historical Data and Forecast of Australia Acrylic Paints for Non-Plastic Application for Paints Market Revenues & Volume By Oil Group for the Period 2022 - 2032F
- Australia Paints for Non-Plastic Application for Paints Import Export Trade Statistics
- Market Opportunity Assessment By Product
- Australia Paints for Non-Plastic Application for Paints Top Companies Market Share
- Australia Paints for Non-Plastic Application for Paints Competitive Benchmarking By Technical and Operational Parameters
- Australia Paints for Non-Plastic Application for Paints Company Profiles
- Australia Paints for Non-Plastic Application for Paints Key Strategic Recommendations
Australia Paints for Non-Plastic Application for Paints Market (2026-2032): FAQs
6Wresearch actively monitors the Australia Paints for Non-Plastic Application for Paints Market and publishes its comprehensive annual report, highlighting emerging trends, growth drivers, revenue analysis, and forecast outlook. Our insights help businesses to make data-backed strategic decisions with ongoing market dynamics. Our analysts track relevent industries related to the Australia Paints for Non-Plastic Application for Paints Market, allowing our clients with actionable intelligence and reliable forecasts tailored to emerging regional needs.
Yes, we provide customisation as per your requirements. To learn more, feel free to contact us on sales@6wresearch.com
1 Executive Summary |
2 Introduction |
2.1 Key Highlights of the Report |
2.2 Report Description |
2.3 Market Scope & Segmentation |
2.4 Research Methodology |
2.5 Assumptions |
3 Australia Paints for Non-Plastic Application for Paints Market Overview |
3.1 Australia Country Macro Economic Indicators |
3.2 Australia Paints for Non-Plastic Application for Paints Market Revenues & Volume, 2022 & 2032F |
3.3 Australia Paints for Non-Plastic Application for Paints Market - Industry Life Cycle |
3.4 Australia Paints for Non-Plastic Application for Paints Market - Porter's Five Forces |
3.5 Australia Paints for Non-Plastic Application for Paints Market Revenues & Volume Share, By Product, 2022 & 2032F |
4 Australia Paints for Non-Plastic Application for Paints Market Dynamics |
4.1 Impact Analysis |
4.2 Market Drivers |
4.2.1 Increasing awareness about environmental impact of plastic paints |
4.2.2 Growing demand for sustainable and eco-friendly products |
4.2.3 Advancements in technology leading to improved performance of non-plastic paints |
4.3 Market Restraints |
4.3.1 Higher initial cost of non-plastic paints compared to traditional plastic paints |
4.3.2 Limited availability of non-plastic paint options in the market |
4.3.3 Resistance from consumers accustomed to using plastic paints |
5 Australia Paints for Non-Plastic Application for Paints Market Trends |
6 Australia Paints for Non-Plastic Application for Paints Market, By Types |
6.1 Australia Paints for Non-Plastic Application for Paints Market, By Product |
6.1.1 Overview and Analysis |
6.1.2 Australia Paints for Non-Plastic Application for Paints Market Revenues & Volume, By Product, 2022 - 2032F |
6.1.3 Australia Paints for Non-Plastic Application for Paints Market Revenues & Volume, By Acrylic, 2022 - 2032F |
6.1.4 Australia Paints for Non-Plastic Application for Paints Market Revenues & Volume, By Polyurethanes, 2022 - 2032F |
6.1.5 Australia Paints for Non-Plastic Application for Paints Market Revenues & Volume, By Polyesters, 2022 - 2032F |
6.1.6 Australia Paints for Non-Plastic Application for Paints Market Revenues & Volume, By Epoxy, 2022 - 2032F |
6.1.7 Australia Paints for Non-Plastic Application for Paints Market Revenues & Volume, By Alkyd, 2022 - 2032F |
6.1.8 Australia Paints for Non-Plastic Application for Paints Market Revenues & Volume, By Wood Colorant, 2022 - 2032F |
6.1.9 Australia Paints for Non-Plastic Application for Paints Market Revenues & Volume, By Oil Group, 2022 - 2032F |
6.1.10 Australia Paints for Non-Plastic Application for Paints Market Revenues & Volume, By Oil Group, 2022 - 2032F |
7 Australia Paints for Non-Plastic Application for Paints Market Import-Export Trade Statistics |
7.1 Australia Paints for Non-Plastic Application for Paints Market Export to Major Countries |
7.2 Australia Paints for Non-Plastic Application for Paints Market Imports from Major Countries |
8 Australia Paints for Non-Plastic Application for Paints Market Key Performance Indicators |
8.1 Percentage increase in demand for non-plastic paints |
8.2 Number of new environmentally conscious customers |
8.3 Rate of adoption of non-plastic paint technology |
8.4 Number of new product innovations in the non-plastic paint segment |
8.5 Customer satisfaction levels with non-plastic paint products |
9 Australia Paints for Non-Plastic Application for Paints Market - Opportunity Assessment |
9.1 Australia Paints for Non-Plastic Application for Paints Market Opportunity Assessment, By Product, 2022 & 2032F |
10 Australia Paints for Non-Plastic Application for Paints Market - Competitive Landscape |
10.1 Australia Paints for Non-Plastic Application for Paints Market Revenue Share, By Companies, 2025 |
10.2 Australia Paints for Non-Plastic Application for Paints Market Competitive Benchmarking, By Operating and Technical Parameters |
11 Company Profiles |
12 Recommendations |
13 Disclaimer |
Export potential assessment - trade Analytics for 2030
Export potential enables firms to identify high-growth global markets with greater confidence by combining advanced trade intelligence with a structured quantitative methodology. The framework analyzes emerging demand trends and country-level import patterns while integrating macroeconomic and trade datasets such as GDP and population forecasts, bilateral import–export flows, tariff structures, elasticity differentials between developed and developing economies, geographic distance, and import demand projections. Using weighted trade values from 2020–2024 as the base period to project country-to-country export potential for 2030, these inputs are operationalized through calculated drivers such as gravity model parameters, tariff impact factors, and projected GDP per-capita growth. Through an analysis of hidden potentials, demand hotspots, and market conditions that are most favorable to success, this method enables firms to focus on target countries, maximize returns, and global expansion with data, backed by accuracy.
By factoring in the projected importer demand gap that is currently unmet and could be potential opportunity, it identifies the potential for the Exporter (Country) among 190 countries, against the general trade analysis, which identifies the biggest importer or exporter.
To discover high-growth global markets and optimize your business strategy:
Click Here
Pricing
- Single User License$ 1,995
- Department License$ 2,400
- Site License$ 3,120
- Global License$ 3,795

Search
Thought Leadership and Analyst Meet


Our Clients
Latest Reports
- Taiwan Food Delivery Platform Market (2026-2032) | Companies, Outlook, Analysis, Trends, Value, Revenue, Segmentation, Share, Forecast, Competitive Landscape, Growth, Size & Forecast
- United Kingdom (UK) Long-term Care Insurance Market (2026-2032) | Growth, Share, Consumer Insights, Drivers, Opportunities, Competition, Pricing Analysis, Segments, Restraints, Companies, Competitive, Value, Outlook, Size, Demand, Analysis, Challenges, Strategic Insights, Investment Trends, Revenue, Trends, Supply, Forecast
- United Kingdom (UK) Long Term Care Market (2026-2032) | Companies, Outlook, Analysis, Trends, Value, Revenue, Segmentation, Share, Forecast, Competitive Landscape, Growth, Size & Forecast
- Iraq Insulation and Waterproofing Market (2026-2032) | Outlook, Drivers, Growth, Size, Share, Industry, Revenue, Trends, Demand, Competitive, Strategic Insights, Opportunities, Segments, Companies, Challenges, Strategy, Consumer Insights, Analysis, Investment Trends, Value, Segmentation, Forecast, Restraints
- India Switchgear Market Outlook (2026-2032) | Size, Share, Trends, Growth, Revenue, Forecast, Analysis, Value, Outlook
- Pakistan Contraceptive Implants Market (2025-2031) | Demand, Growth, Size, Share, Industry, Pricing Analysis, Competitive, Strategic Insights, Strategy, Consumer Insights, Analysis, Investment Trends, Opportunities, Revenue, Segments, Value, Segmentation, Supply, Forecast, Restraints, Outlook, Competition, Drivers, Trends, Companies, Challenges
- Sri Lanka Packaging Market (2026-2032) | Outlook, Competition, Drivers, Trends, Demand, Pricing Analysis, Competitive, Strategic Insights, Companies, Challenges, Strategy, Consumer Insights, Analysis, Investment Trends, Opportunities, Growth, Size, Share, Industry, Revenue, Segments, Value, Segmentation, Supply, Forecast, Restraints
- India Kids Watches Market (2026-2032) | Strategy, Consumer Insights, Analysis, Investment Trends, Opportunities, Growth, Size, Share, Industry, Revenue, Segments, Value, Segmentation, Supply, Forecast, Restraints, Outlook, Competition, Drivers, Trends, Demand, Pricing Analysis, Competitive, Strategic Insights, Companies, Challenges
- Saudi Arabia Core Assurance Service Market (2025-2031) | Strategy, Consumer Insights, Analysis, Investment Trends, Opportunities, Growth, Size, Share, Industry, Revenue, Segments, Value, Segmentation, Supply, Forecast, Restraints, Outlook, Competition, Drivers, Trends, Demand, Pricing Analysis, Competitive, Strategic Insights, Companies, Challenges
- Romania Uninterruptible Power Supply (UPS) Market (2026-2032) | Industry, Analysis, Revenue, Size, Forecast, Outlook, Value, Trends, Share, Growth & Companies
Industry Events and Analyst Meet

India EV Show 2026

EV tech India Expo 2026

Auto Tech Asia 2026

Battery Tech India 2026

Smart Production Solutions Guangzhou 2026
Whitepaper
- Middle East & Africa Commercial Security Market Click here to view more.
- Middle East & Africa Fire Safety Systems & Equipment Market Click here to view more.
- GCC Drone Market Click here to view more.
- Middle East Lighting Fixture Market Click here to view more.
- GCC Physical & Perimeter Security Market Click here to view more.
6WResearch In News
- Doha a strategic location for EV manufacturing hub: IPA Qatar
- Demand for luxury TVs surging in the GCC, says Samsung
- Empowering Growth: The Thriving Journey of Bangladesh’s Cable Industry
- Demand for luxury TVs surging in the GCC, says Samsung
- Video call with a traditional healer? Once unthinkable, it’s now common in South Africa
- Intelligent Buildings To Smooth GCC’s Path To Net Zero