Australia Particle Board Market (2026-2032) | Trends, Companies, Outlook, Size, Growth, COVID-19 IMPACT, Revenue, Industry, Analysis, Share, Value & Forecast
Market Forecast By Type (Standard Chipboard, Melamine Veneered Chipboard, Flooring Grade Chipboard, Wood Veneered Chipboard, Plastic Veneered Chipboard, Other), By Application (Construction, Furniture, Infrastructure, Other) And Competitive Landscape
| Product Code: ETC031735 | Publication Date: Oct 2020 | Updated Date: Mar 2026 | Product Type: Report | |
| Publisher: 6Wresearch | Author: Ravi Bhandari | No. of Pages: 70 | No. of Figures: 35 | No. of Tables: 5 |
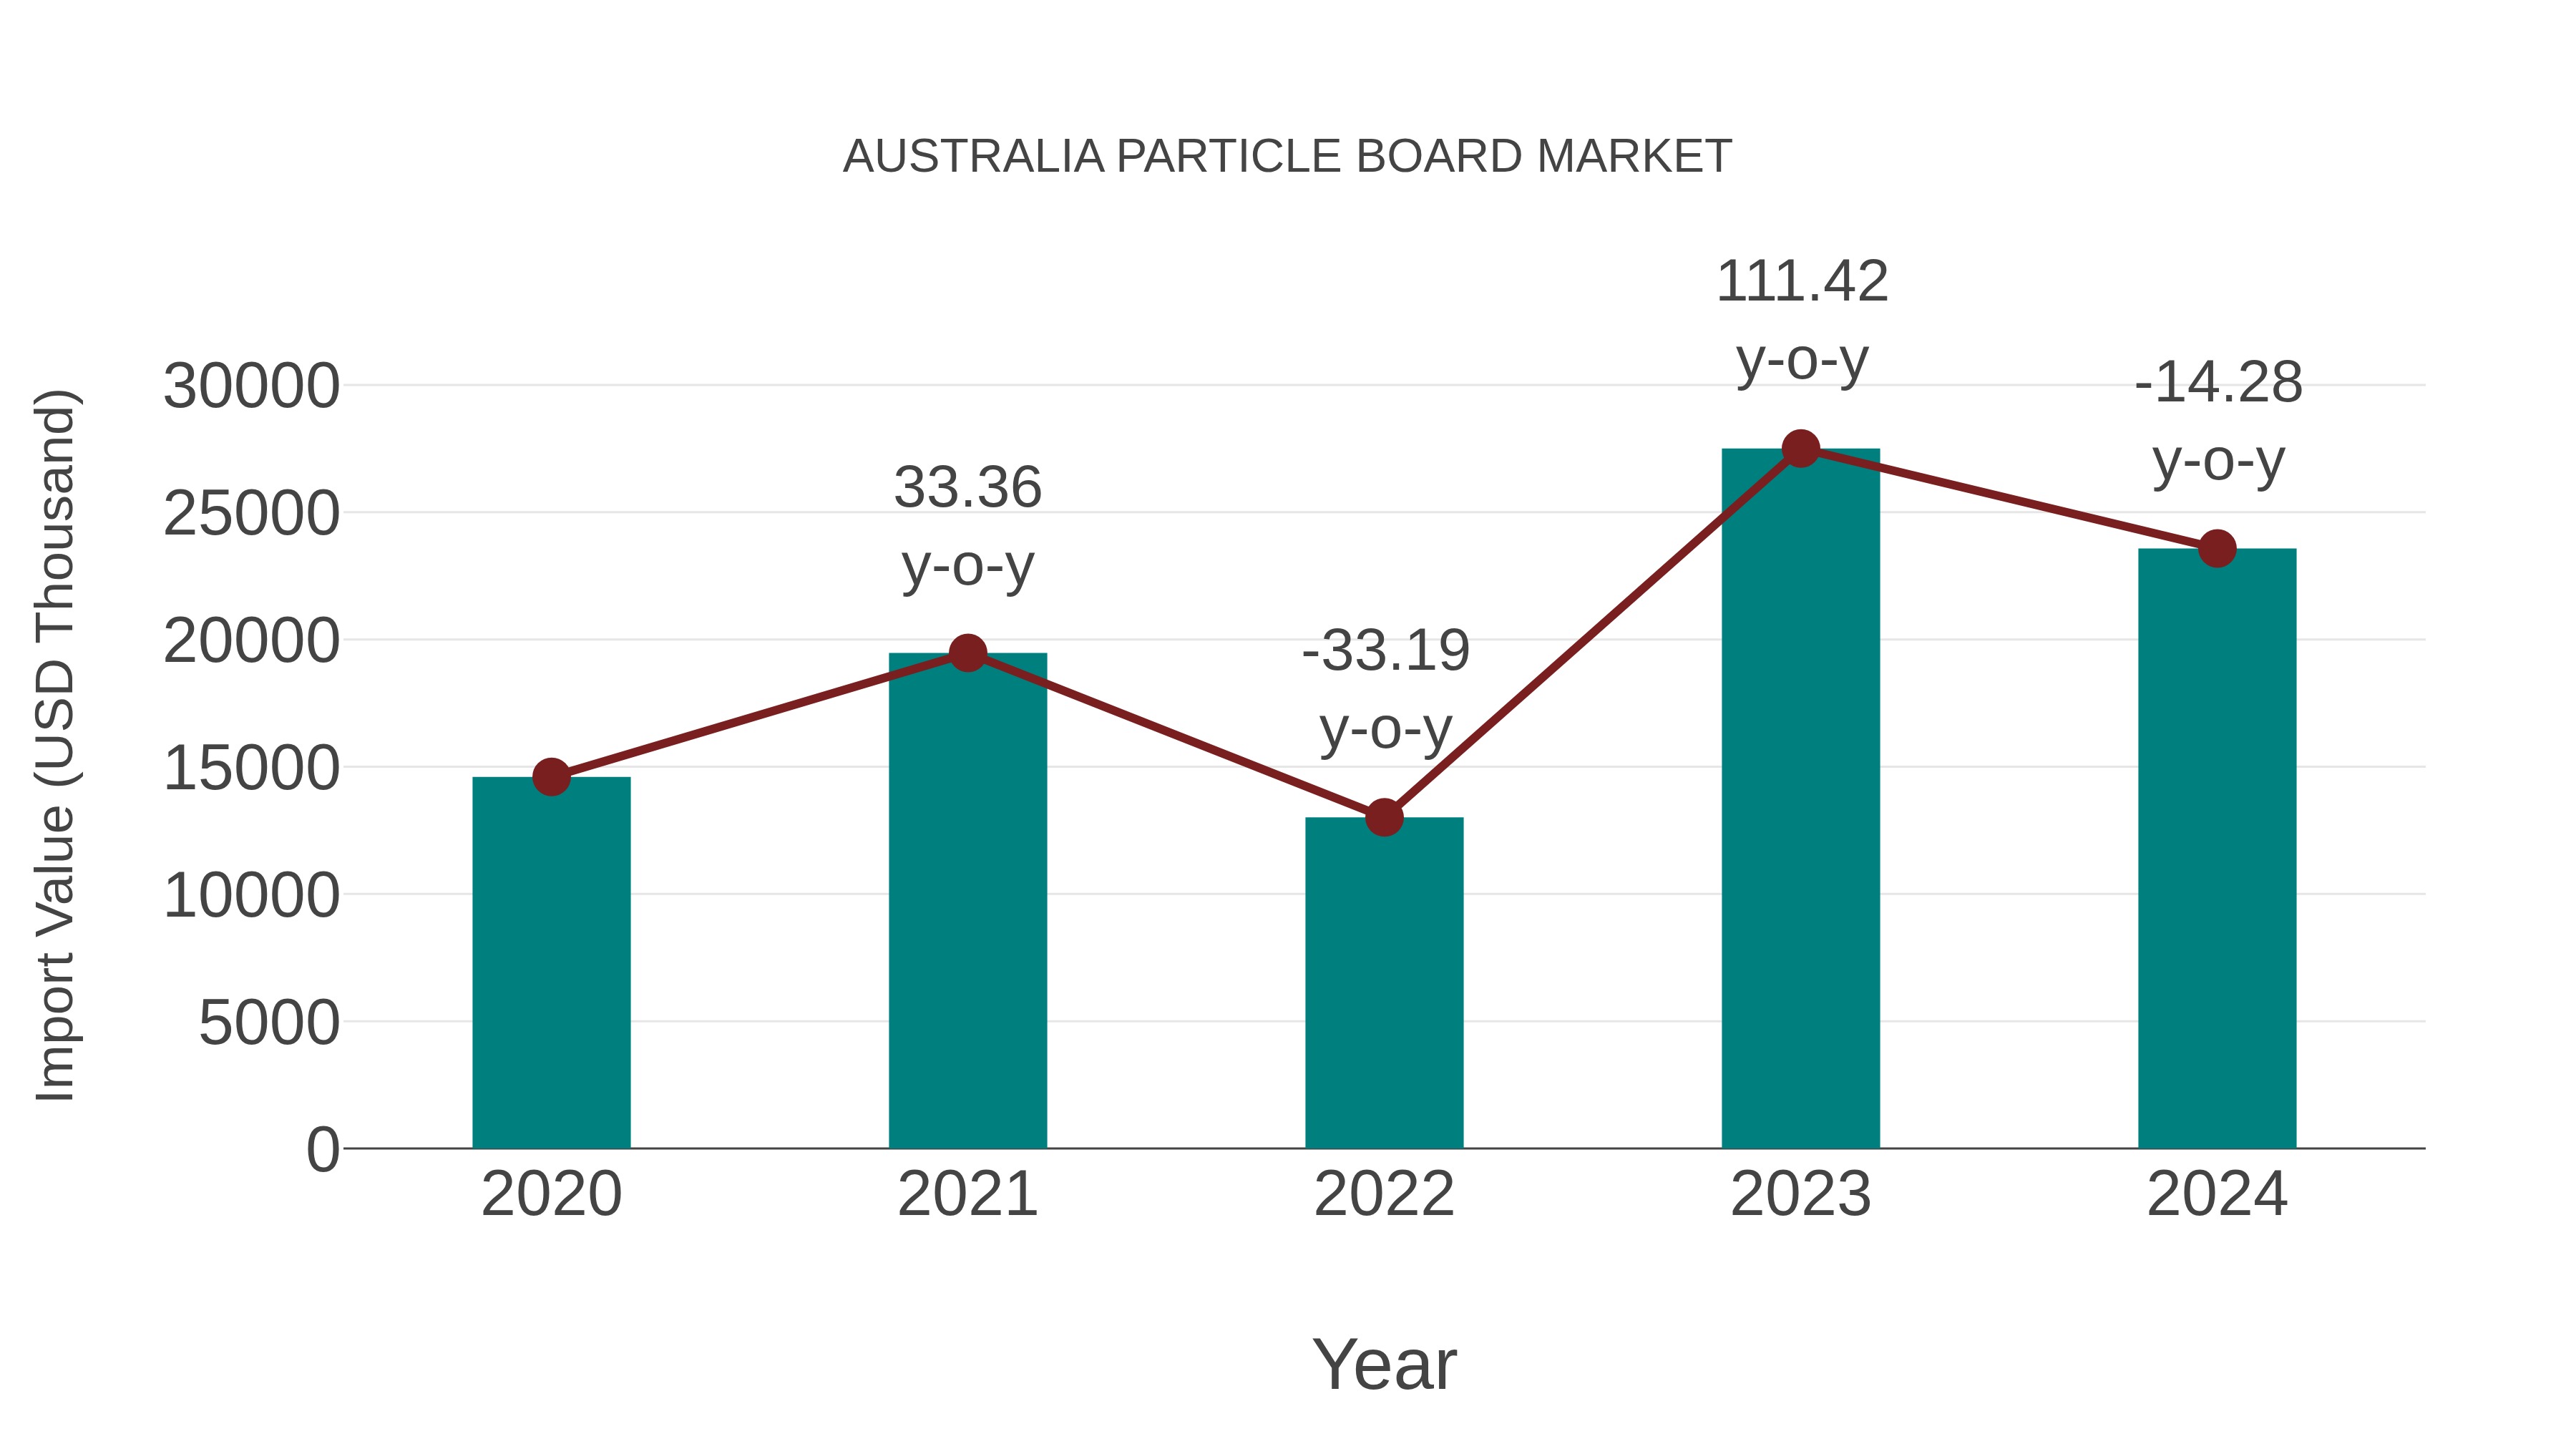
Australia Particle Board Market: Import Trend Analysis
In 2024, Australia`s particle board import trend showed a decline, with a growth rate of -14.28% compared to the previous year. However, the compound annual growth rate (CAGR) for 2020-2024 stood at a positive 12.73%. This negative momentum in import growth could be attributed to shifts in demand dynamics or changes in trade policies affecting the market stability during that period.
Australia Particle Board Market Synopsis
The particle board market in Australia benefits from the booming construction and furniture industries. The demand for cost-effective and lightweight engineered wood products has fueled market growth. Eco-friendly and moisture-resistant particle boards are gaining traction, particularly in cabinetry and interior applications. Imports from Asia supplement local production, with quality and sustainability certifications influencing buyer preferences.
Drivers of the market
The Australian particle board market is driven by the rising demand for cost-effective and eco-friendly construction materials. The increasing preference for engineered wood products in furniture, cabinetry, and interior applications is boosting market growth. Additionally, improvements in production technology are enhancing the durability and moisture resistance of particle boards.
Challenges of the market
The particle board industry is challenged by fluctuations in wood prices and the availability of raw materials. Sustainability concerns push manufacturers to adopt recycled wood sources, which increases processing costs. Moreover, competition from alternative engineered wood products limits market expansion.
Investment opportunities in the Market
The Australian particle board market is benefiting from demand in furniture, construction, and interior décor industries. Investment opportunities exist in high-density, moisture-resistant boards, as well as sustainable manufacturing processes using recycled wood materials. The rise in residential renovations and commercial real estate projects is fueling further growth.
Government Policy of the market
The particle board market is influenced by construction material regulations and sustainability initiatives. The government enforces formaldehyde emission standards to ensure indoor air quality and worker safety. Policies supporting sustainable forestry practices promote the use of responsibly sourced wood in particle board manufacturing. Import controls prevent the sale of non-compliant particle boards.
Key Highlights of the Report:
- Australia Particle Board Market Outlook
- Market Size of Australia Particle Board Market, 2025
- Forecast of Australia Particle Board Market, 2032
- Historical Data and Forecast of Australia Particle Board Revenues & Volume for the Period 2022-2032F
- Australia Particle Board Market Trend Evolution
- Australia Particle Board Market Drivers and Challenges
- Australia Particle Board Price Trends
- Australia Particle Board Porter's Five Forces
- Australia Particle Board Industry Life Cycle
- Historical Data and Forecast of Australia Particle Board Market Revenues & Volume By Type for the Period 2022-2032F
- Historical Data and Forecast of Australia Particle Board Market Revenues & Volume By Standard Chipboard for the Period 2022-2032F
- Historical Data and Forecast of Australia Particle Board Market Revenues & Volume By Melamine Veneered Chipboard for the Period 2022-2032F
- Historical Data and Forecast of Australia Particle Board Market Revenues & Volume By Flooring Grade Chipboard for the Period 2022-2032F
- Historical Data and Forecast of Australia Particle Board Market Revenues & Volume By Wood Veneered Chipboard for the Period 2022-2032F
- Historical Data and Forecast of Australia Particle Board Market Revenues & Volume By Plastic Veneered Chipboard for the Period 2022-2032F
- Historical Data and Forecast of Australia Particle Board Market Revenues & Volume By Other for the Period 2022-2032F
- Historical Data and Forecast of Australia Particle Board Market Revenues & Volume By Application for the Period 2022-2032F
- Historical Data and Forecast of Australia Particle Board Market Revenues & Volume By Construction for the Period 2022-2032F
- Historical Data and Forecast of Australia Particle Board Market Revenues & Volume By Furniture for the Period 2022-2032F
- Historical Data and Forecast of Australia Particle Board Market Revenues & Volume By Infrastructure for the Period 2022-2032F
- Historical Data and Forecast of Australia Particle Board Market Revenues & Volume By Other for the Period 2022-2032F
- Australia Particle Board Import Export Trade Statistics
- Market Opportunity Assessment By Type
- Market Opportunity Assessment By Application
- Australia Particle Board Top Companies Market Share
- Australia Particle Board Competitive Benchmarking By Technical and Operational Parameters
- Australia Particle Board Company Profiles
- Australia Particle Board Key Strategic Recommendations
Australia Particle Board Market (2026-2032): FAQs
6Wresearch actively monitors the Australia Particle Board Market and publishes its comprehensive annual report, highlighting emerging trends, growth drivers, revenue analysis, and forecast outlook. Our insights help businesses to make data-backed strategic decisions with ongoing market dynamics. Our analysts track relevent industries related to the Australia Particle Board Market, allowing our clients with actionable intelligence and reliable forecasts tailored to emerging regional needs.
Yes, we provide customisation as per your requirements. To learn more, feel free to contact us on sales@6wresearch.com
1 Executive Summary |
2 Introduction |
2.1 Key Highlights of the Report |
2.2 Report Description |
2.3 Market Scope & Segmentation |
2.4 Research Methodology |
2.5 Assumptions |
3 Australia Particle Board Market Overview |
3.1 Australia Country Macro Economic Indicators |
3.2 Australia Particle Board Market Revenues & Volume, 2022 & 2032F |
3.3 Australia Particle Board Market - Industry Life Cycle |
3.4 Australia Particle Board Market - Porter's Five Forces |
3.5 Australia Particle Board Market Revenues & Volume Share, By Type, 2022 & 2032F |
3.6 Australia Particle Board Market Revenues & Volume Share, By Application, 2022 & 2032F |
4 Australia Particle Board Market Dynamics |
4.1 Impact Analysis |
4.2 Market Drivers |
4.2.1 Growing demand for sustainable and eco-friendly building materials. |
4.2.2 Increasing construction activities in Australia. |
4.2.3 Innovation in particle board manufacturing technologies. |
4.3 Market Restraints |
4.3.1 Fluctuating prices of raw materials such as wood fibers. |
4.3.2 Regulatory challenges related to environmental standards. |
4.3.3 Competition from alternative materials like MDF and plywood. |
5 Australia Particle Board Market Trends |
6 Australia Particle Board Market, By Types |
6.1 Australia Particle Board Market, By Type |
6.1.1 Overview and Analysis |
6.1.2 Australia Particle Board Market Revenues & Volume, By Type, 2022-2032F |
6.1.3 Australia Particle Board Market Revenues & Volume, By Standard Chipboard, 2022-2032F |
6.1.4 Australia Particle Board Market Revenues & Volume, By Melamine Veneered Chipboard, 2022-2032F |
6.1.5 Australia Particle Board Market Revenues & Volume, By Flooring Grade Chipboard, 2022-2032F |
6.1.6 Australia Particle Board Market Revenues & Volume, By Wood Veneered Chipboard, 2022-2032F |
6.1.7 Australia Particle Board Market Revenues & Volume, By Plastic Veneered Chipboard, 2022-2032F |
6.1.8 Australia Particle Board Market Revenues & Volume, By Other, 2022-2032F |
6.2 Australia Particle Board Market, By Application |
6.2.1 Overview and Analysis |
6.2.2 Australia Particle Board Market Revenues & Volume, By Construction, 2022-2032F |
6.2.3 Australia Particle Board Market Revenues & Volume, By Furniture, 2022-2032F |
6.2.4 Australia Particle Board Market Revenues & Volume, By Infrastructure, 2022-2032F |
6.2.5 Australia Particle Board Market Revenues & Volume, By Other, 2022-2032F |
7 Australia Particle Board Market Import-Export Trade Statistics |
7.1 Australia Particle Board Market Export to Major Countries |
7.2 Australia Particle Board Market Imports from Major Countries |
8 Australia Particle Board Market Key Performance Indicators |
8.1 Percentage of recycled content in particle boards. |
8.2 Number of new construction projects utilizing particle boards. |
8.3 Investment in research and development for particle board technology improvements. |
9 Australia Particle Board Market - Opportunity Assessment |
9.1 Australia Particle Board Market Opportunity Assessment, By Type, 2022 & 2032F |
9.2 Australia Particle Board Market Opportunity Assessment, By Application, 2022 & 2032F |
10 Australia Particle Board Market - Competitive Landscape |
10.1 Australia Particle Board Market Revenue Share, By Companies, 2025 |
10.2 Australia Particle Board Market Competitive Benchmarking, By Operating and Technical Parameters |
11 Company Profiles |
12 Recommendations |
13 Disclaimer |
Global Go To Market Strategy - 2030
Export potential enables firms to identify high-growth global markets with greater confidence by combining advanced trade intelligence with a structured quantitative methodology. The framework analyzes emerging demand trends and country-level import patterns while integrating macroeconomic and trade datasets such as GDP and population forecasts, bilateral import–export flows, tariff structures, elasticity differentials between developed and developing economies, geographic distance, and import demand projections. Using weighted trade values from 2020–2024 as the base period to project country-to-country export potential for 2030, these inputs are operationalized through calculated drivers such as gravity model parameters, tariff impact factors, and projected GDP per-capita growth. Through an analysis of hidden potentials, demand hotspots, and market conditions that are most favorable to success, this method enables firms to focus on target countries, maximize returns, and global expansion with data, backed by accuracy.
By factoring in the projected importer demand gap that is currently unmet and could be potential opportunity, it identifies the potential for the Exporter (Country) among 190 countries, against the general trade analysis, which identifies the biggest importer or exporter.
To discover high-growth global markets and optimize your business strategy:
Click Here
Pricing
- Single User License$ 1,995
- Department License$ 2,400
- Site License$ 3,120
- Global License$ 3,795

Leadership Perspectives from Industry Events
Search
Thought Leadership and Analyst Meet


Our Clients
6WResearch In News
- India Air Conditioner Market Set for Strong Rebound in 2026 After Weather-Led Correction and GST-Driven Recovery: 6Wresearch
- ADAS in India: How Automatic Emergency Braking, Blind Spot Detection & Driver Monitoring are Transforming Road Safety
- Doha a strategic location for EV manufacturing hub: IPA Qatar
- Demand for luxury TVs surging in the GCC, says Samsung
- Empowering Growth: The Thriving Journey of Bangladesh’s Cable Industry
- Demand for luxury TVs surging in the GCC, says Samsung
Latest Reports
- Poland Fire Protection Systems Market (2026-2032)
- Cape Verde Portable Hand-Thrown Extinguisher Market (2026-2032)
- Canada Portable Hand-Thrown Extinguisher Market (2026-2032)
- Cameroon Portable Hand-Thrown Extinguisher Market (2026-2032)
- Burundi Portable Hand-Thrown Extinguisher Market (2026-2032)
- Burkina Faso Portable Hand-Thrown Extinguisher Market (2026-2032)
- Bulgaria Portable Hand-Thrown Extinguisher Market (2026-2032)
- Brunei Portable Hand-Thrown Extinguisher Market (2026-2032)
- Botswana Portable Hand-Thrown Extinguisher Market (2026-2032)
- Bosnia and Herzegovina Portable Hand-Thrown Extinguisher Market (2026-2032)
Industry Events and Analyst Meet

HIMTEX 2026

India Refining Summit 2026

India EV Show 2026

EV tech India Expo 2026

Auto Tech Asia 2026
Whitepaper
- Middle East & Africa Commercial Security Market Click here to view more.
- Middle East & Africa Fire Safety Systems & Equipment Market Click here to view more.
- GCC Drone Market Click here to view more.
- Middle East Lighting Fixture Market Click here to view more.
- GCC Physical & Perimeter Security Market Click here to view more.