Australia Personal Protective Equipment Construction Market (2026-2032) | Drivers, Trends, Strategy, Forecast, Investment Trends, Outlook, Industry, Competitive, Pricing Analysis, Companies, Analysis, Consumer Insights, Size, Strategic Insights, Share, Segments, Segmentation, Competition, Opportunities, Growth, Value, Demand, Restraints, Supply, Challenges, Revenue
Market Forecast By Equipment Type (Hard Hats, Safety Glasses, Hearing Protection, Respirators, Protective Clothing), By Material (Polycarbonate, Polyethylene, Foam, Rubber, High-Visibility Fabric), By User Type (Construction Workers, Engineers, Supervisors, Laborers, Site Managers), By Application (Head Protection, Eye Protection, Noise Reduction, Dust & Fume Protection, Chemical Protection), By Safety Standard (ANSI Certified, OSHA Compliant, NIOSH Approved, CE Certified, EN Standards) And Competitive Landscape
| Product Code: ETC10778750 | Publication Date: Apr 2025 | Updated Date: Feb 2026 | Product Type: Market Research Report | |
| Publisher: 6Wresearch | Author: Ravi Bhandari | No. of Pages: 65 | No. of Figures: 34 | No. of Tables: 19 |
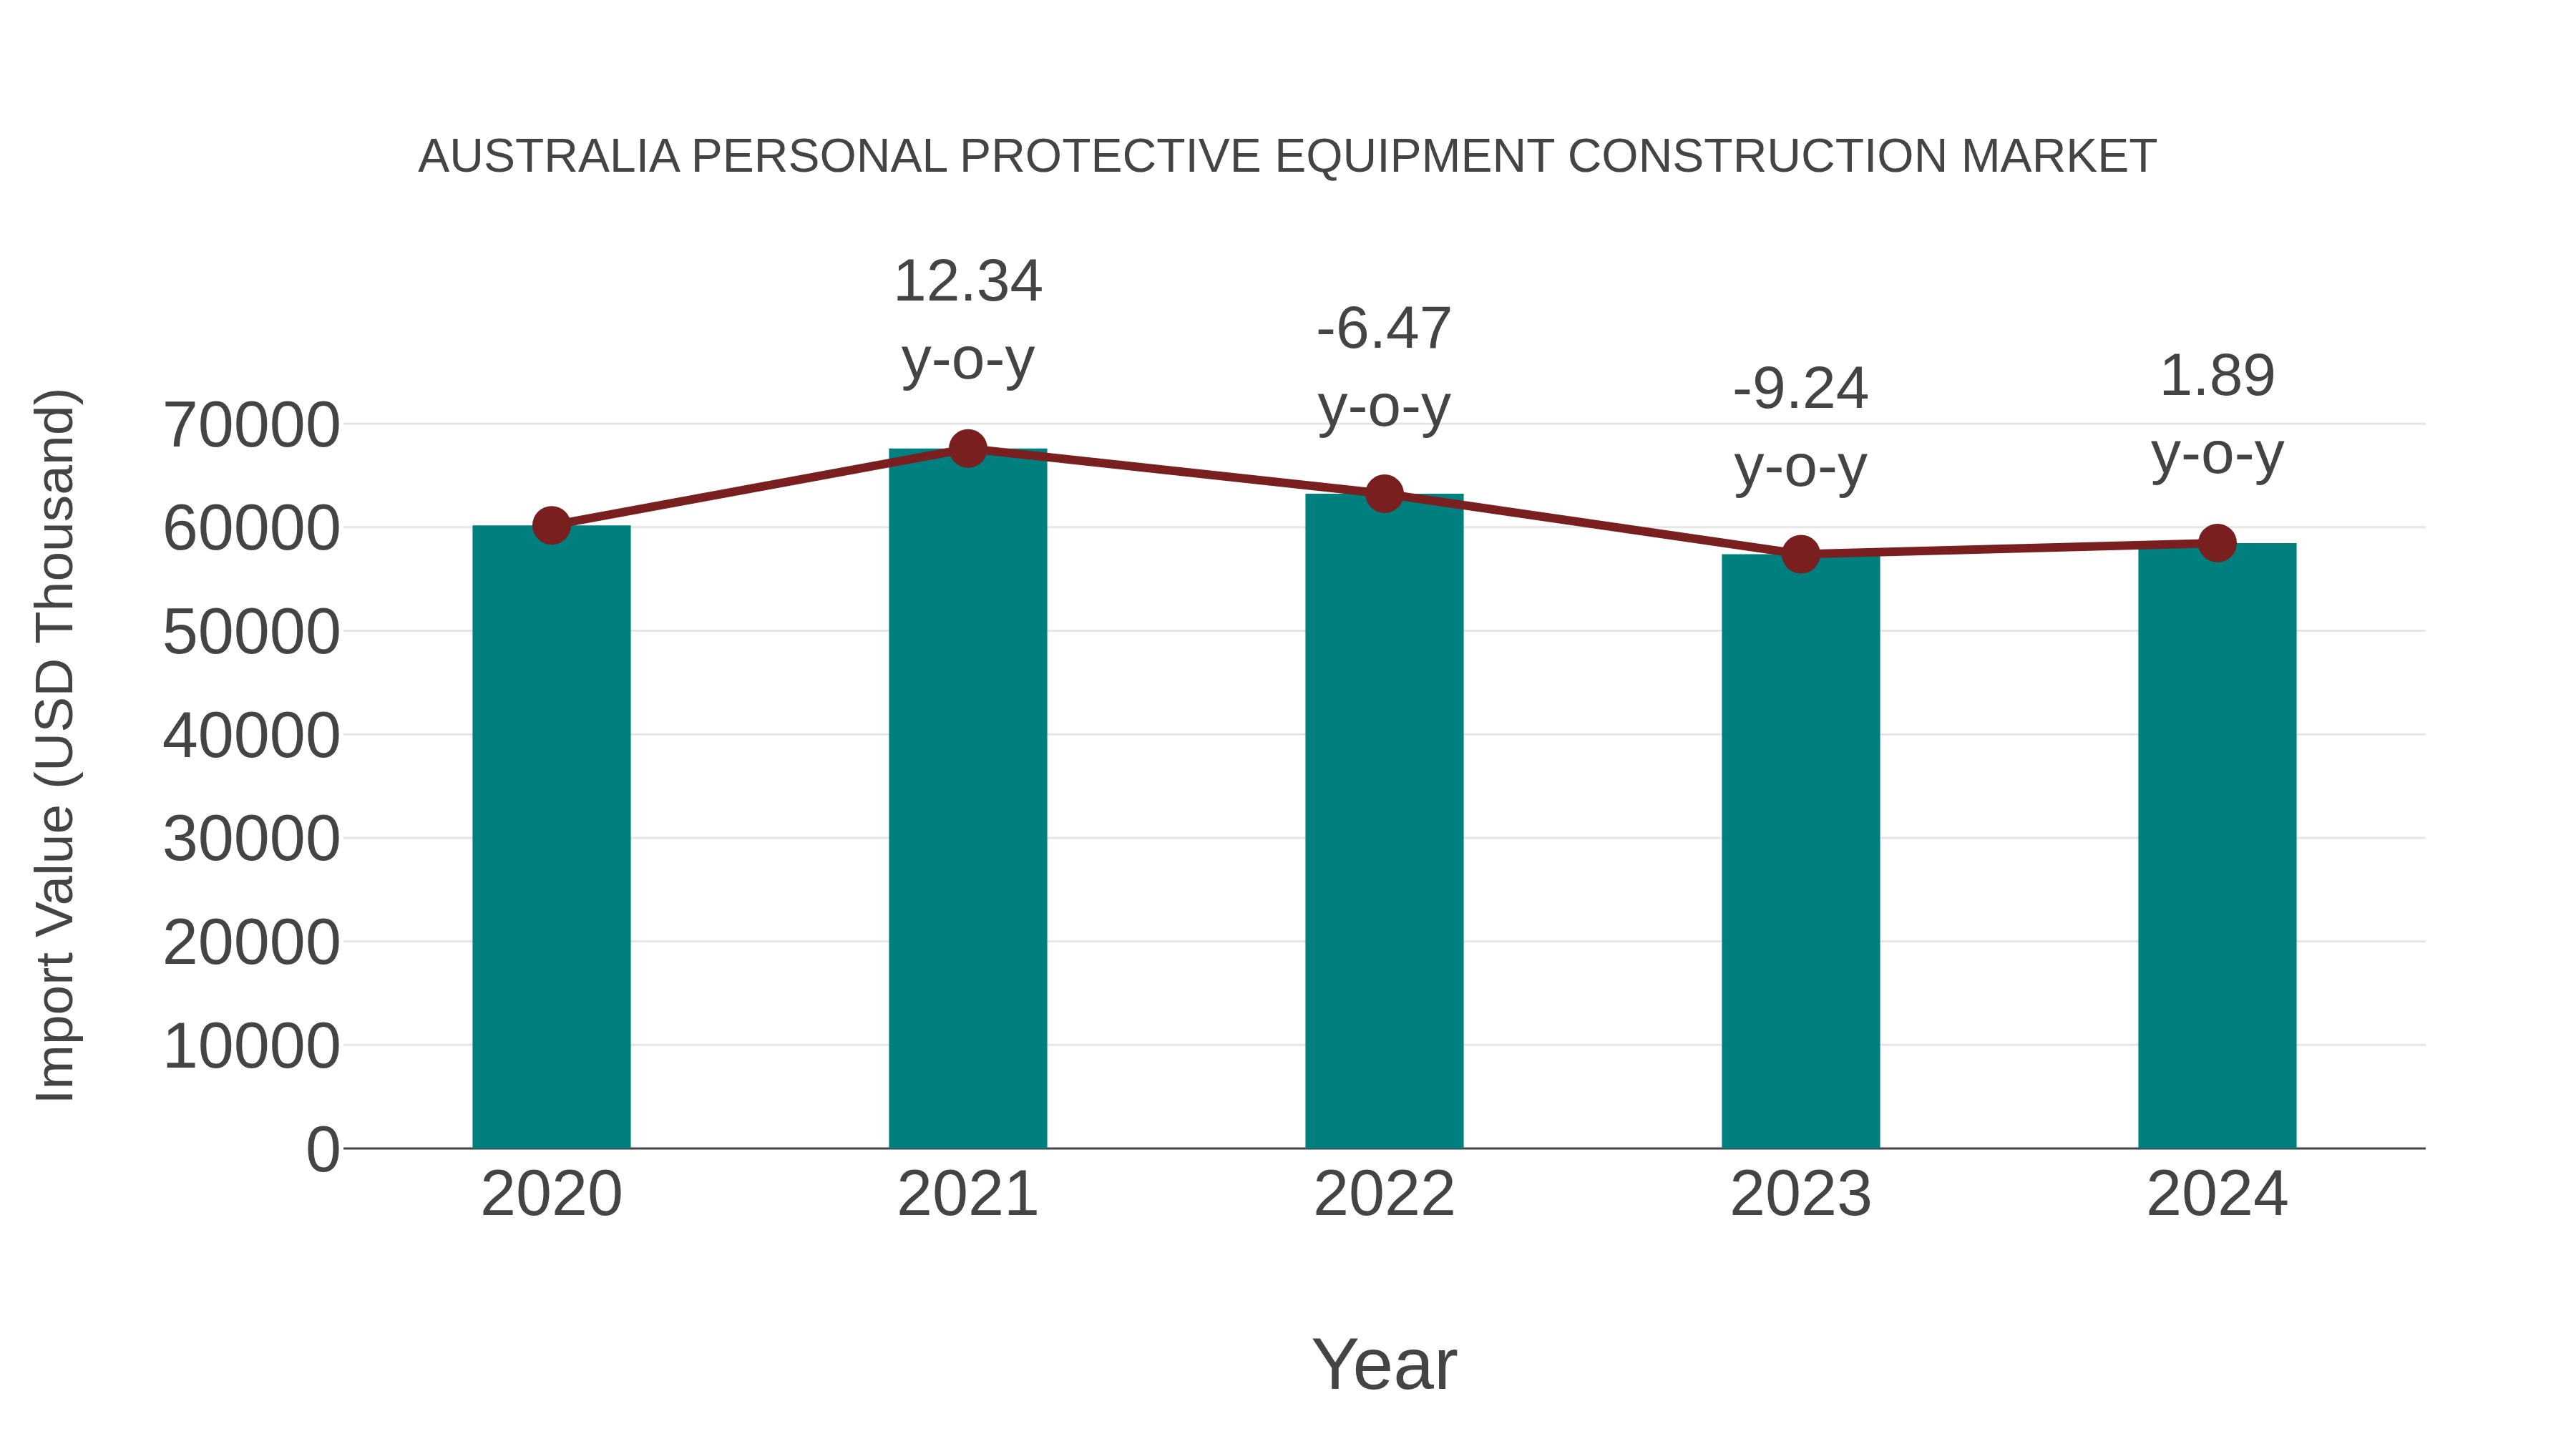
Australia Personal Protective Equipment Construction Market: Import Trend Analysis
Australia`s import trend for personal protective equipment in the construction market showed a growth rate of 1.89% from 2023 to 2024, with a compound annual growth rate (CAGR) of -0.72% from 2020 to 2024. The slight uptick in import momentum in 2024 may be attributed to evolving safety regulations or increased infrastructure projects driving demand.
Key Highlights of the Report:
- Australia Personal Protective Equipment Construction Market Outlook
- Market Size of Australia Personal Protective Equipment Construction Market, 2025
- Forecast of Australia Personal Protective Equipment Construction Market, 2032
- Historical Data and Forecast of Australia Personal Protective Equipment Construction Revenues & Volume for the Period 2022-2032F
- Australia Personal Protective Equipment Construction Market Trend Evolution
- Australia Personal Protective Equipment Construction Market Drivers and Challenges
- Australia Personal Protective Equipment Construction Price Trends
- Australia Personal Protective Equipment Construction Porter's Five Forces
- Australia Personal Protective Equipment Construction Industry Life Cycle
- Historical Data and Forecast of Australia Personal Protective Equipment Construction Market Revenues & Volume By Equipment Type for the Period 2022-2032F
- Historical Data and Forecast of Australia Personal Protective Equipment Construction Market Revenues & Volume By Hard Hats for the Period 2022-2032F
- Historical Data and Forecast of Australia Personal Protective Equipment Construction Market Revenues & Volume By Safety Glasses for the Period 2022-2032F
- Historical Data and Forecast of Australia Personal Protective Equipment Construction Market Revenues & Volume By Hearing Protection for the Period 2022-2032F
- Historical Data and Forecast of Australia Personal Protective Equipment Construction Market Revenues & Volume By Respirators for the Period 2022-2032F
- Historical Data and Forecast of Australia Personal Protective Equipment Construction Market Revenues & Volume By Protective Clothing for the Period 2022 - 2032F
- Historical Data and Forecast of Australia Personal Protective Equipment Construction Market Revenues & Volume By Material for the Period 2022-2032F
- Historical Data and Forecast of Australia Personal Protective Equipment Construction Market Revenues & Volume By Polycarbonate for the Period 2022-2032F
- Historical Data and Forecast of Australia Personal Protective Equipment Construction Market Revenues & Volume By Polyethylene for the Period 2022-2032F
- Historical Data and Forecast of Australia Personal Protective Equipment Construction Market Revenues & Volume By Foam for the Period 2022-2032F
- Historical Data and Forecast of Australia Personal Protective Equipment Construction Market Revenues & Volume By Rubber for the Period 2022-2032F
- Historical Data and Forecast of Australia Personal Protective Equipment Construction Market Revenues & Volume By High-Visibility Fabric for the Period 2022 - 2032F
- Historical Data and Forecast of Australia Personal Protective Equipment Construction Market Revenues & Volume By User Type for the Period 2022-2032F
- Historical Data and Forecast of Australia Personal Protective Equipment Construction Market Revenues & Volume By Construction Workers for the Period 2022-2032F
- Historical Data and Forecast of Australia Personal Protective Equipment Construction Market Revenues & Volume By Engineers for the Period 2022-2032F
- Historical Data and Forecast of Australia Personal Protective Equipment Construction Market Revenues & Volume By Supervisors for the Period 2022-2032F
- Historical Data and Forecast of Australia Personal Protective Equipment Construction Market Revenues & Volume By Laborers for the Period 2022-2032F
- Historical Data and Forecast of Australia Personal Protective Equipment Construction Market Revenues & Volume By Site Managers for the Period 2022 - 2032F
- Historical Data and Forecast of Australia Personal Protective Equipment Construction Market Revenues & Volume By Application for the Period 2022-2032F
- Historical Data and Forecast of Australia Personal Protective Equipment Construction Market Revenues & Volume By Head Protection for the Period 2022-2032F
- Historical Data and Forecast of Australia Personal Protective Equipment Construction Market Revenues & Volume By Eye Protection for the Period 2022-2032F
- Historical Data and Forecast of Australia Personal Protective Equipment Construction Market Revenues & Volume By Noise Reduction for the Period 2022-2032F
- Historical Data and Forecast of Australia Personal Protective Equipment Construction Market Revenues & Volume By Dust & Fume Protection for the Period 2022-2032F
- Historical Data and Forecast of Australia Personal Protective Equipment Construction Market Revenues & Volume By Chemical Protection for the Period 2022 - 2032F
- Historical Data and Forecast of Australia Personal Protective Equipment Construction Market Revenues & Volume By Safety Standard for the Period 2022-2032F
- Historical Data and Forecast of Australia Personal Protective Equipment Construction Market Revenues & Volume By ANSI Certified for the Period 2022-2032F
- Historical Data and Forecast of Australia Personal Protective Equipment Construction Market Revenues & Volume By OSHA Compliant for the Period 2022-2032F
- Historical Data and Forecast of Australia Personal Protective Equipment Construction Market Revenues & Volume By NIOSH Approved for the Period 2022-2032F
- Historical Data and Forecast of Australia Personal Protective Equipment Construction Market Revenues & Volume By CE Certified for the Period 2022 - 2032F
- Historical Data and Forecast of Australia Personal Protective Equipment Construction Market Revenues & Volume By EN Standards for the Period 2022 - 2032F
- Australia Personal Protective Equipment Construction Import Export Trade Statistics
- Market Opportunity Assessment By Equipment Type
- Market Opportunity Assessment By Material
- Market Opportunity Assessment By User Type
- Market Opportunity Assessment By Application
- Market Opportunity Assessment By Safety Standard
- Australia Personal Protective Equipment Construction Top Companies Market Share
- Australia Personal Protective Equipment Construction Competitive Benchmarking By Technical and Operational Parameters
- Australia Personal Protective Equipment Construction Company Profiles
- Australia Personal Protective Equipment Construction Key Strategic Recommendations
Frequently Asked Questions About the Market Study (FAQs):
6Wresearch actively monitors the Australia Personal Protective Equipment Construction Market and publishes its comprehensive annual report, highlighting emerging trends, growth drivers, revenue analysis, and forecast outlook. Our insights help businesses to make data-backed strategic decisions with ongoing market dynamics. Our analysts track relevent industries related to the Australia Personal Protective Equipment Construction Market, allowing our clients with actionable intelligence and reliable forecasts tailored to emerging regional needs.
Yes, we provide customisation as per your requirements. To learn more, feel free to contact us on sales@6wresearch.com
| 1 Executive Summary |
| 2 Introduction |
| 2.1 Key Highlights of the Report |
| 2.2 Report Description |
| 2.3 Market Scope & Segmentation |
| 2.4 Research Methodology |
| 2.5 Assumptions |
| 3 Australia Personal Protective Equipment Construction Market Overview |
| 3.1 Australia Country Macro Economic Indicators |
| 3.2 Australia Personal Protective Equipment Construction Market Revenues & Volume, 2022 & 2032F |
| 3.3 Australia Personal Protective Equipment Construction Market - Industry Life Cycle |
| 3.4 Australia Personal Protective Equipment Construction Market - Porter's Five Forces |
| 3.5 Australia Personal Protective Equipment Construction Market Revenues & Volume Share, By Equipment Type, 2022 & 2032F |
| 3.6 Australia Personal Protective Equipment Construction Market Revenues & Volume Share, By Material, 2022 & 2032F |
| 3.7 Australia Personal Protective Equipment Construction Market Revenues & Volume Share, By User Type, 2022 & 2032F |
| 3.8 Australia Personal Protective Equipment Construction Market Revenues & Volume Share, By Application, 2022 & 2032F |
| 3.9 Australia Personal Protective Equipment Construction Market Revenues & Volume Share, By Safety Standard, 2022 & 2032F |
| 4 Australia Personal Protective Equipment Construction Market Dynamics |
| 4.1 Impact Analysis |
| 4.2 Market Drivers |
| 4.2.1 Stringent safety regulations in the construction industry |
| 4.2.2 Increasing awareness about worker safety and health |
| 4.2.3 Growth in construction activities and infrastructure development in Australia |
| 4.2.1. Construction worker count (000s) |
| 4.2.2. Safety regulation citations/year |
| 4.2.3. Worksite injury rate (%) |
| 4.2.4. PPE import CAGR (%) |
| 4.2.5. Government grants for safety ($) |
| 4.3 Market Restraints |
| 4.3.1 Economic downturn impacting construction spending |
| 4.3.2 Price volatility of raw materials used in personal protective equipment |
| 4.3.3 Lack of skilled labor and training in the construction sector |
| 4.3.1. Units sold/year |
| 4.3.2. Avg. PPE replacement cycle (months) |
| 4.3.3. Compliance rate (%) |
| 4.3.4. Unit cost ($) |
| 4.3.5. Failure incidents per 1000 users |
| 4.4 Market KPIs |
| 4.4.1. High unit cost/imported (%) |
| 4.4.2. Worker discomfort index |
| 4.4.3. Improper usage incidents (%) |
| 4.4.4. Supply chain gaps (days/month) |
| 4.4.5. Local manufacturing share (%) |
| 5 Australia Personal Protective Equipment Construction Market Trends |
| 6 Australia Personal Protective Equipment Construction Market, By Types |
| 6.1 Australia Personal Protective Equipment Construction Market, By Equipment Type |
| 6.1.1 Overview and Analysis |
| 6.1.2 Australia Personal Protective Equipment Construction Market Revenues & Volume, By Equipment Type, 2022 - 2032F |
| 6.1.3 Australia Personal Protective Equipment Construction Market Revenues & Volume, By Hard Hats, 2022 - 2032F |
| 6.1.4 Australia Personal Protective Equipment Construction Market Revenues & Volume, By Safety Glasses, 2022 - 2032F |
| 6.1.5 Australia Personal Protective Equipment Construction Market Revenues & Volume, By Hearing Protection, 2022 - 2032F |
| 6.1.6 Australia Personal Protective Equipment Construction Market Revenues & Volume, By Respirators, 2022 - 2032F |
| 6.1.7 Australia Personal Protective Equipment Construction Market Revenues & Volume, By Protective Clothing, 2022 - 2032F |
| 6.2 Australia Personal Protective Equipment Construction Market, By Material |
| 6.2.1 Overview and Analysis |
| 6.2.2 Australia Personal Protective Equipment Construction Market Revenues & Volume, By Polycarbonate, 2022 - 2032F |
| 6.2.3 Australia Personal Protective Equipment Construction Market Revenues & Volume, By Polyethylene, 2022 - 2032F |
| 6.2.4 Australia Personal Protective Equipment Construction Market Revenues & Volume, By Foam, 2022 - 2032F |
| 6.2.5 Australia Personal Protective Equipment Construction Market Revenues & Volume, By Rubber, 2022 - 2032F |
| 6.2.6 Australia Personal Protective Equipment Construction Market Revenues & Volume, By High-Visibility Fabric, 2022 - 2032F |
| 6.3 Australia Personal Protective Equipment Construction Market, By User Type |
| 6.3.1 Overview and Analysis |
| 6.3.2 Australia Personal Protective Equipment Construction Market Revenues & Volume, By Construction Workers, 2022 - 2032F |
| 6.3.3 Australia Personal Protective Equipment Construction Market Revenues & Volume, By Engineers, 2022 - 2032F |
| 6.3.4 Australia Personal Protective Equipment Construction Market Revenues & Volume, By Supervisors, 2022 - 2032F |
| 6.3.5 Australia Personal Protective Equipment Construction Market Revenues & Volume, By Laborers, 2022 - 2032F |
| 6.3.6 Australia Personal Protective Equipment Construction Market Revenues & Volume, By Site Managers, 2022 - 2032F |
| 6.4 Australia Personal Protective Equipment Construction Market, By Application |
| 6.4.1 Overview and Analysis |
| 6.4.2 Australia Personal Protective Equipment Construction Market Revenues & Volume, By Head Protection, 2022 - 2032F |
| 6.4.3 Australia Personal Protective Equipment Construction Market Revenues & Volume, By Eye Protection, 2022 - 2032F |
| 6.4.4 Australia Personal Protective Equipment Construction Market Revenues & Volume, By Noise Reduction, 2022 - 2032F |
| 6.4.5 Australia Personal Protective Equipment Construction Market Revenues & Volume, By Dust & Fume Protection, 2022 - 2032F |
| 6.4.6 Australia Personal Protective Equipment Construction Market Revenues & Volume, By Chemical Protection, 2022 - 2032F |
| 6.5 Australia Personal Protective Equipment Construction Market, By Safety Standard |
| 6.5.1 Overview and Analysis |
| 6.5.2 Australia Personal Protective Equipment Construction Market Revenues & Volume, By ANSI Certified, 2022 - 2032F |
| 6.5.3 Australia Personal Protective Equipment Construction Market Revenues & Volume, By OSHA Compliant, 2022 - 2032F |
| 6.5.4 Australia Personal Protective Equipment Construction Market Revenues & Volume, By NIOSH Approved, 2022 - 2032F |
| 6.5.5 Australia Personal Protective Equipment Construction Market Revenues & Volume, By CE Certified, 2022 - 2032F |
| 6.5.6 Australia Personal Protective Equipment Construction Market Revenues & Volume, By EN Standards, 2022 - 2032F |
| 7 Australia Personal Protective Equipment Construction Market Import-Export Trade Statistics |
| 7.1 Australia Personal Protective Equipment Construction Market Export to Major Countries |
| 7.2 Australia Personal Protective Equipment Construction Market Imports from Major Countries |
| 8 Australia Personal Protective Equipment Construction Market Key Performance Indicators |
| 8.1 Number of workplace accidents and injuries in the construction industry |
| 8.2 Compliance rate with safety regulations and standards |
| 8.3 Adoption rate of advanced personal protective equipment technologies |
| 8.4 Rate of investment in employee training and safety programs |
| 8.5 Percentage of construction projects incorporating safety as a key criterion |
| 9 Australia Personal Protective Equipment Construction Market - Opportunity Assessment |
| 9.1 Australia Personal Protective Equipment Construction Market Opportunity Assessment, By Equipment Type, 2022 & 2032F |
| 9.2 Australia Personal Protective Equipment Construction Market Opportunity Assessment, By Material, 2022 & 2032F |
| 9.3 Australia Personal Protective Equipment Construction Market Opportunity Assessment, By User Type, 2022 & 2032F |
| 9.4 Australia Personal Protective Equipment Construction Market Opportunity Assessment, By Application, 2022 & 2032F |
| 9.5 Australia Personal Protective Equipment Construction Market Opportunity Assessment, By Safety Standard, 2022 & 2032F |
| 10 Australia Personal Protective Equipment Construction Market - Competitive Landscape |
| 10.1 Australia Personal Protective Equipment Construction Market Revenue Share, By Companies, 2025 |
| 10.2 Australia Personal Protective Equipment Construction Market Competitive Benchmarking, By Operating and Technical Parameters |
| 11 Company Profiles |
| 12 Recommendations |
| 13 Disclaimer |
Export potential assessment - trade Analytics for 2030
Export potential enables firms to identify high-growth global markets with greater confidence by combining advanced trade intelligence with a structured quantitative methodology. The framework analyzes emerging demand trends and country-level import patterns while integrating macroeconomic and trade datasets such as GDP and population forecasts, bilateral import–export flows, tariff structures, elasticity differentials between developed and developing economies, geographic distance, and import demand projections. Using weighted trade values from 2020–2024 as the base period to project country-to-country export potential for 2030, these inputs are operationalized through calculated drivers such as gravity model parameters, tariff impact factors, and projected GDP per-capita growth. Through an analysis of hidden potentials, demand hotspots, and market conditions that are most favorable to success, this method enables firms to focus on target countries, maximize returns, and global expansion with data, backed by accuracy.
By factoring in the projected importer demand gap that is currently unmet and could be potential opportunity, it identifies the potential for the Exporter (Country) among 190 countries, against the general trade analysis, which identifies the biggest importer or exporter.
To discover high-growth global markets and optimize your business strategy:
Click Here
Pricing
- Single User License$ 1,995
- Department License$ 2,400
- Site License$ 3,120
- Global License$ 3,795

Search
Thought Leadership and Analyst Meet


Our Clients
Latest Reports
- India Ultrasonic Smart Water Meter Market (2026-2032) | Outlook, Competition, Drivers, Trends, Demand, Competitive, Strategic Insights, Companies, Challenges, Strategy, Consumer Insights, Analysis, Opportunities, Growth, Size, Share, Industry, Revenue, Segments, Value, Segmentation, Supply, Forecast, Restraints,
- India Electromagnetic Bulk Flow Meter Market (2026-2032) | Analysis, Challenges, Strategic Insights, Supply, Forecast, Growth, Share, Consumer Insights, Competitive, Value, Outlook, Size & Demand,
- India Battery Powered Bulk Flow Meter Market (2026-2032) | Outlook, Analysis, Competitive Landscape, Growth, Size, Trends, Value, Revenue, Companies, Segmentation, Share & Forecast
- Bosnia and Herzegovina Fuel-Efficient Winglets Market (2026-2032) | Growth, Competition, Strategy, Restraints, Trends, Challenges, segmentation, Value, Outlook, Investment Opportunities, Analysis, Revenue, Companies, Insights, Pricing, Size, Drivers, Demand, Share, Forecast
- Canada Cloud CFD Market (2026-2032) | Size & Revenue, Industry, Growth, Competitive Landscape, Forecast, Segmentation, Value, Outlook, Trends, Share, Analysis, Companies
- Taiwan Food Delivery Platform Market (2026-2032) | Companies, Outlook, Analysis, Trends, Value, Revenue, Segmentation, Share, Forecast, Competitive Landscape, Growth, Size & Forecast
- United Kingdom (UK) Long-term Care Insurance Market (2026-2032) | Growth, Share, Consumer Insights, Drivers, Opportunities, Competition, Pricing Analysis, Segments, Restraints, Companies, Competitive, Value, Outlook, Size, Demand, Analysis, Challenges, Strategic Insights, Investment Trends, Revenue, Trends, Supply, Forecast
- United Kingdom (UK) Long Term Care Market (2026-2032) | Companies, Outlook, Analysis, Trends, Value, Revenue, Segmentation, Share, Forecast, Competitive Landscape, Growth, Size & Forecast
- Iraq Insulation and Waterproofing Market (2026-2032) | Outlook, Drivers, Growth, Size, Share, Industry, Revenue, Trends, Demand, Competitive, Strategic Insights, Opportunities, Segments, Companies, Challenges, Strategy, Consumer Insights, Analysis, Investment Trends, Value, Segmentation, Forecast, Restraints
- India Switchgear Market Outlook (2026-2032) | Size, Share, Trends, Growth, Revenue, Forecast, Analysis, Value, Outlook
Industry Events and Analyst Meet

HIMTEX 2026

India Refining Summit 2026

India EV Show 2026

EV tech India Expo 2026

Auto Tech Asia 2026
Whitepaper
- Middle East & Africa Commercial Security Market Click here to view more.
- Middle East & Africa Fire Safety Systems & Equipment Market Click here to view more.
- GCC Drone Market Click here to view more.
- Middle East Lighting Fixture Market Click here to view more.
- GCC Physical & Perimeter Security Market Click here to view more.
6WResearch In News
- Doha a strategic location for EV manufacturing hub: IPA Qatar
- Demand for luxury TVs surging in the GCC, says Samsung
- Empowering Growth: The Thriving Journey of Bangladesh’s Cable Industry
- Demand for luxury TVs surging in the GCC, says Samsung
- Video call with a traditional healer? Once unthinkable, it’s now common in South Africa
- Intelligent Buildings To Smooth GCC’s Path To Net Zero