Australia Power Supply Market (2026-2032) | Forecast, Trends, Share, Size, Value, Growth, Analysis, Industry, Revenue, Outlook & Companies
Market Forecast By Output Power (Power Supply With Low Output (500 W and Below), Power Supply With Medium Output (500–1,000 W), Power Supply With High Output (More Than 1,000 W)), By Type (AC-DC Power Supply, DC-DC Power Supply), By Vertical (Medical & Healthcare, Military & Aerospace, Telecommunications, Consumer Electronics, Transportation, Lighting, Food & Beverages, Industrial) And Competitive Landscape
| Product Code: ETC014215 | Publication Date: Oct 2020 | Updated Date: Jun 2026 | Product Type: Report | |
| Publisher: 6Wresearch | Author: Ravi Bhandari | No. of Pages: 70 | No. of Figures: 35 | No. of Tables: 5 |
Australia Power Supply Market Summary
The australia power supply market was estimated at USD 133 Million in 2025 and is projected to reach USD 155 Million by 2032, growing at a CAGR of 2.4% from 2026 to 2032.
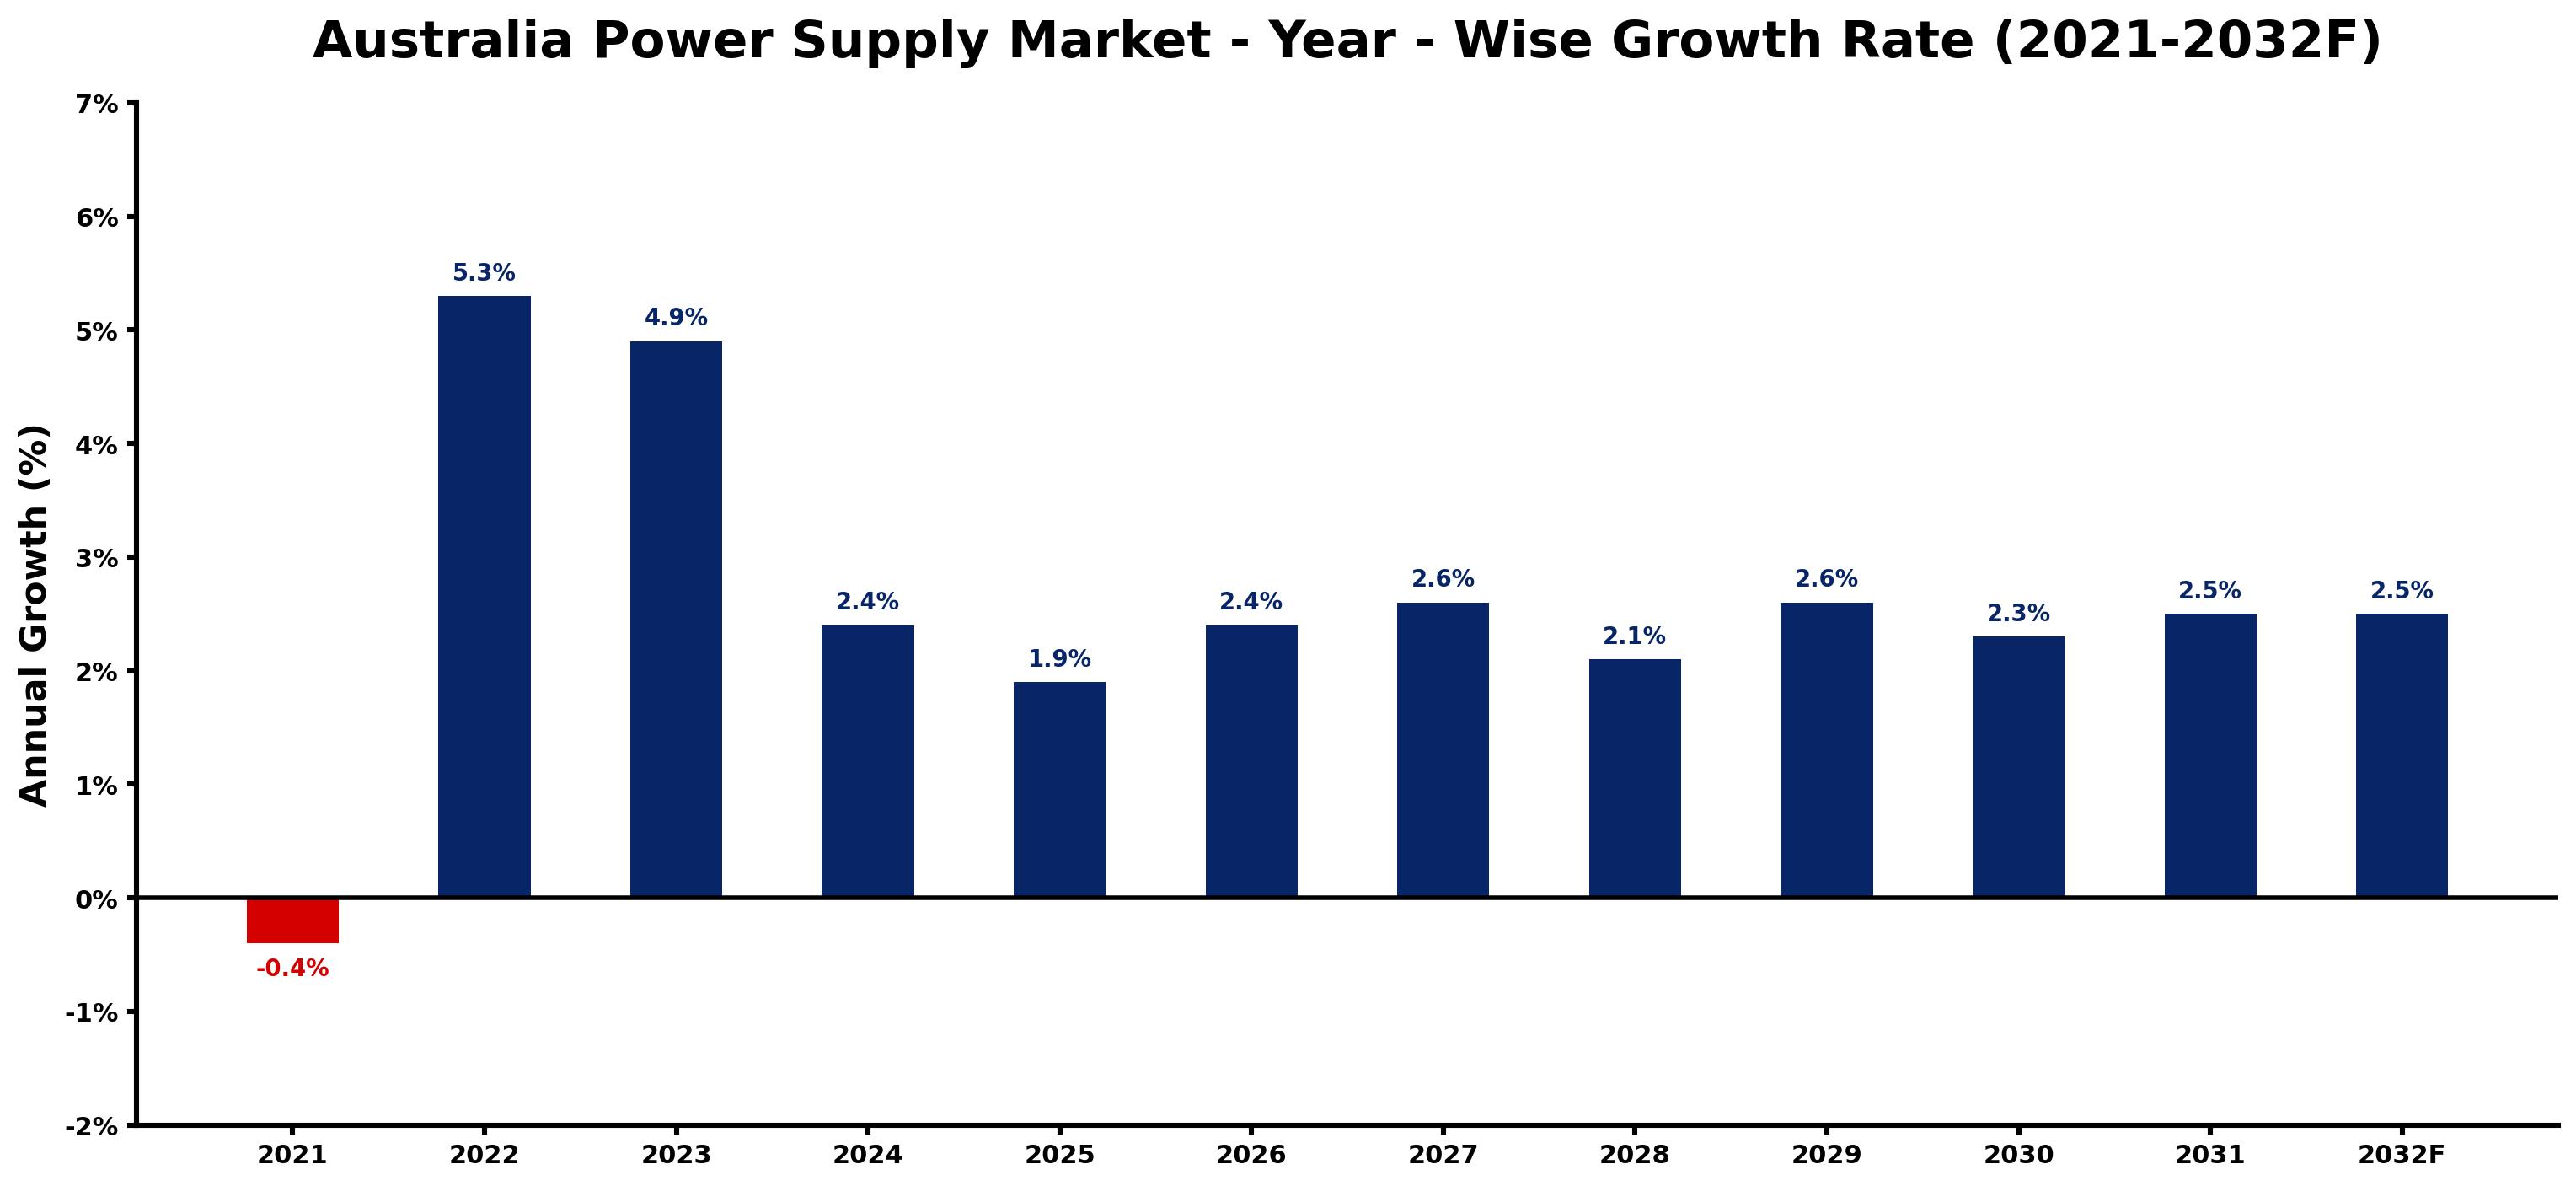
Australia Power Supply Market Growth Rate Analysis (2021-2032)
The power supply market in Australia has shown resilient growth after a challenging period in 2021, when it contracted by 0.4%. Recovery commenced in 2022 with a notable 5.3% increase, driven largely by a surge in consumer demand and significant investments in renewable energy infrastructure. This upward trend continued into 2023, reflecting a 4.9% growth as businesses adapted to evolving energy policies aimed at facilitating the energy transition. While growth rates are projected to moderate, with anticipated increases of around 2.4% to 2.6% through 2026, factors such as technological advancements and a push for digitalization are likely to sustain expansion, ensuring a robust market environment through the coming decade.
Australia Power Supply Market Year-wise Growth Rate and Key Drivers
This graph highlights how the Australia Power Supply Market has steadily grown over the past five years, supported by major growth factors.
The table below presents the year wise growth rates along with the key drivers influencing the market
| Year | Growth Rate | Major Drivers |
| 2021 | -0.4% | Increased competition from renewable energy sources diminished demand for traditional power supply options. |
| 2022 | 5.3% | Transition to renewable sources reshaped energy portfolios across various sectors. |
| 2023 | 4.9% | Technological innovations in energy storage improved grid reliability and efficiency. |
| 2024 | 2.4% | Corporate sustainability goals pushed businesses to invest in green power initiatives. |
| 2025 | 1.9% | Regional energy collaborations opened new avenues for shared resource management. |
| 2026 | 2.4% | Consumer awareness around climate issues fueled interest in solar and wind solutions. |
| 2027 | 2.6% | Urbanization trends drove higher electricity consumption in metropolitan areas. |
| 2028 | 2.1% | Aging infrastructure prompted increased investments in grid modernization projects. |
| 2029 | 2.6% | Emerging technologies in smart meters enhanced energy usage transparency for consumers. |
| 2030 | 2.3% | Corporate energy procurement strategies began focusing on locally sourced power. |
| 2031 | 2.5% | International partnerships facilitated knowledge-sharing on sustainable energy practices. |
| 2032 | 2.5% | Evolving customer preferences prioritized energy efficiency in product offerings. |
Note - Market size estimations and growth projections presented in this report are based on 6Wresearch's advanced forecasting approach, validated with industry datasets as of June 2026.
Australia Power Supply Market Synopsis
The Australia Power Supply Market is projected to reach 2.4% and witness significant growth during the forecast period (2026-2032). The market is transforming in response to escalating demand for renewable energy sources, energy storage solutions, and smart grid technologies. Factors such as increased industrialization, evolving consumer expectations for reliable power sources, and government incentives designed to promote clean energy initiatives are driving this evolution. Market dynamics reflect a balance between opportunity and challenge as stakeholders navigate the complexities of infrastructure enhancements and regulatory compliance.
Australia Power Supply Market Growth Drivers
The drivers propelling the Australia Power Supply Market include:
- Proliferation of Renewable Energy Sources: The shift towards solar and wind power is becoming a critical component of Australia's energy strategy, reflecting both environmental priorities and economic opportunities.
- Industrial Expansion: Growing sectors such as manufacturing and information technology are increasing their energy consumption, necessitating more reliable and efficient power solutions.
- Government Policies Supporting Clean Energy: Initiatives that advocate for the adoption of cleaner energy technologies are accelerating market growth while simultaneously promoting sustainability.
- Technological Advancements in Energy Storage: Innovations in battery storage systems and uninterruptible power supplies (UPS) are enhancing energy reliability for both residential and commercial users.
- Consumer Demand for Energy Efficiency: There is a rising expectation among consumers for efficient power supply solutions, influencing manufacturers to innovate and adapt their offerings.
Australia Power Supply Market Challenges and Restraints
While the Australia Power Supply Market shows promise, several challenges impede its progress, including:
- Infrastructure Limitations: The existing grid infrastructure faces significant constraints arising from the integration of renewable energy sources, leading to potential reliability issues.
- Regulatory Uncertainty: Manufacturers contend with a complex regulatory landscape, where evolving policies may impact operational strategies and market entry.
- Investment Requirements for Modernization: Continuous innovation in energy-efficient technologies demands substantial capital investment, which can be a barrier for smaller players.
- Competition from Alternative Technologies: As new energy technologies emerge, traditional power supply solutions face competition, requiring market players to innovate to stay relevant.
- Public Perception and Buy-In: Achieving widespread consumer acceptance of new energy solutions can be challenging, influencing market adoption rates.
Australia Power Supply Market Investment Opportunities
The evolving landscape presents multiple investment opportunities within the Australia Power Supply Market, driven by:
- Development of Smart Grids: Investments in smart grid technologies are poised to enhance operational efficiency and facilitate the integration of diverse energy sources.
- Data Center Demand: With the rapid rise in digital services, data centers are becoming significant consumers of power, presenting opportunities for tailored solutions.
- Renewable Energy Projects: The government's push for renewable energy projects creates avenues for investments in solar, wind, and other sustainable technologies.
- Energy Efficiency Technologies: The pursuit of energy-efficient power supplies aligns with global sustainability trends, encouraging investment in innovative technologies.
- Partnerships for Innovation: Collaborations between public and private sectors are essential for driving innovation and developing new energy solutions.
Australia Power Supply Market Government Investment and Initiatives
Government investment and initiatives are instrumental in shaping the Australia Power Supply Market. Key elements include:
- Support for Renewable Energy Initiatives: The Australian government actively promotes various subsidies and incentives for renewable energy adoption, aimed at reducing carbon emissions and fostering sustainable growth.
- National Electricity Market (NEM) Regulations: The NEM governs the generation and distribution of electricity, ensuring a structured and reliable framework for market participants.
- Funding for Grid Infrastructure Upgrades: Public funding is allocated toward modernizing grid infrastructure, essential for accommodating increased renewable energy generation.
- Research and Development Grants: The government provides grants to support research and development in energy efficiency, storage technologies, and smart grid innovations.
- Partnerships for Sustainability: The government collaborates with private sector stakeholders to promote clean technology advancements, aimed at enhancing energy reliability.
Australia Power Supply Market Latest Developments (May 2025 - June 2026)
Recent developments in the Australia Power Supply Market from May 2025 to June 2026 reflect ongoing shifts towards renewable energy and grid modernization. Industry stakeholders are increasingly focusing on enhancing energy storage solutions, driven by advancements in battery technology and a growing demand for reliable power. The government has introduced new policies aimed at accelerating the deployment of renewable energy infrastructure while ensuring compliance with stringent environmental regulations. Additionally, investments in smart grid technologies are gaining momentum, supporting effective integration of various energy sources.
Australia Power Supply Market - Key Attractiveness of the Report
- 10 Years of Market Numbers
- Historical Data Starting from 2022 to 2025
- Base Year: 2025
- Forecast Data until 2032
- Key Performance Indicators Impacting the Market
- Major Upcoming Developments and Projects
The market is driven by the increasing adoption of renewable energy sources, government incentives, industrial expansion, and technological advancements in energy storage.
Challenges include infrastructure limitations, regulatory uncertainties, and the high capital investment required for modernization and innovation.
The government supports the market through policies that promote renewable energy adoption, funding for infrastructure upgrades, and incentives for energy-efficient technologies.
Investment opportunities are plentiful in smart grid development, renewable energy projects, energy efficiency technologies, and collaborative innovation initiatives.
Key Highlights of the Report:
- Australia Power Supply Market Outlook
- Market Size of Australia Power Supply Market, 2025
- Forecast of Australia Power Supply Market, 2032
- Historical Data and Forecast of Australia Power Supply Revenues & Volume for the Period 2022-2032F
- Australia Power Supply Market Trend Evolution
- Australia Power Supply Market Drivers and Challenges
- Australia Power Supply Price Trends
- Australia Power Supply Porter's Five Forces
- Australia Power Supply Industry Life Cycle
- Historical Data and Forecast of Australia Power Supply Market Revenues & Volume By Output Power for the Period 2022-2032F
- Historical Data and Forecast of Australia Power Supply Market Revenues & Volume By Power Supply With Low Output (500 W and Below) for the Period 2022-2032F
- Historical Data and Forecast of Australia Power Supply Market Revenues & Volume By Power Supply With Medium Output (500?1,000 W) for the Period 2022-2032F
- Historical Data and Forecast of Australia Power Supply Market Revenues & Volume By Power Supply With High Output (More Than 1,000 W) for the Period 2022-2032F
- Historical Data and Forecast of Australia Power Supply Market Revenues & Volume By Type for the Period 2022-2032F
- Historical Data and Forecast of Australia Power Supply Market Revenues & Volume By AC-DC Power Supply for the Period 2022-2032F
- Historical Data and Forecast of Australia Power Supply Market Revenues & Volume By DC-DC Power Supply for the Period 2022-2032F
- Historical Data and Forecast of Australia Power Supply Market Revenues & Volume By Vertical for the Period 2022-2032F
- Historical Data and Forecast of Australia Power Supply Market Revenues & Volume By Medical & Healthcare for the Period 2022-2032F
- Historical Data and Forecast of Australia Power Supply Market Revenues & Volume By Military & Aerospace for the Period 2022-2032F
- Historical Data and Forecast of Australia Power Supply Market Revenues & Volume By Telecommunications for the Period 2022-2032F
- Historical Data and Forecast of Australia Power Supply Market Revenues & Volume By Consumer Electronics for the Period 2022-2032F
- Historical Data and Forecast of Australia Power Supply Market Revenues & Volume By Transportation for the Period 2022-2032F
- Historical Data and Forecast of Australia Power Supply Market Revenues & Volume By Lighting for the Period 2022-2032F
- Historical Data and Forecast of Australia Power Supply Market Revenues & Volume By Food & Beverages for the Period 2022-2032F
- Historical Data and Forecast of Australia Power Supply Market Revenues & Volume By Industrial for the Period 2022-2032F
- Australia Power Supply Import Export Trade Statistics
- Market Opportunity Assessment By Output Power
- Market Opportunity Assessment By Type
- Market Opportunity Assessment By Vertical
- Australia Power Supply Top Companies Market Share
- Australia Power Supply Competitive Benchmarking By Technical and Operational Parameters
- Australia Power Supply Company Profiles
- Australia Power Supply Key Strategic Recommendations
Frequently Asked Questions About the Market Study (FAQs):
The market is driven by the increasing adoption of renewable energy sources, government incentives, industrial expansion, and technological advancements in energy storage.
Challenges include infrastructure limitations, regulatory uncertainties, and the high capital investment required for modernization and innovation.
The government supports the market through policies that promote renewable energy adoption, funding for infrastructure upgrades, and incentives for energy-efficient technologies.
Investment opportunities are plentiful in smart grid development, renewable energy projects, energy efficiency technologies, and collaborative innovation initiatives.
6Wresearch actively monitors the Australia Power Supply Market and publishes its comprehensive annual report, highlighting emerging trends, growth drivers, revenue analysis, and forecast outlook. Our insights help businesses to make data-backed strategic decisions with ongoing market dynamics. Our analysts track relevent industries related to the Australia Power Supply Market, allowing our clients with actionable intelligence and reliable forecasts tailored to emerging regional needs.
Yes, we provide customisation as per your requirements. To learn more, feel free to contact us on sales@6wresearch.com
1 Executive Summary |
2 Introduction |
2.1 Key Highlights of the Report |
2.2 Report Description |
2.3 Market Scope & Segmentation |
2.4 Research Methodology |
2.5 Assumptions |
3 Australia Power Supply Market Overview |
3.1 Australia Country Macro Economic Indicators |
3.2 Australia Power Supply Market Revenues & Volume, 2022 & 2032F |
3.3 Australia Power Supply Market - Industry Life Cycle |
3.4 Australia Power Supply Market - Porter's Five Forces |
3.5 Australia Power Supply Market Revenues & Volume Share, By Output Power, 2022 & 2032F |
3.6 Australia Power Supply Market Revenues & Volume Share, By Type, 2022 & 2032F |
3.7 Australia Power Supply Market Revenues & Volume Share, By Vertical, 2022 & 2032F |
4 Australia Power Supply Market Dynamics |
4.1 Impact Analysis |
4.2 Market Drivers |
4.2.1 Increasing demand for electricity due to population growth and urbanization in Australia |
4.2.2 Government initiatives to promote renewable energy sources and reduce carbon emissions |
4.2.3 Technological advancements in the power supply sector leading to improved efficiency and reliability |
4.3 Market Restraints |
4.3.1 Aging infrastructure and the need for significant investments in modernization and upgrades |
4.3.2 Regulatory challenges and uncertainties impacting the adoption of new technologies |
4.3.3 Fluctuating prices of fuel sources affecting the overall cost of power generation |
5 Australia Power Supply Market Trends |
6 Australia Power Supply Market, By Types |
6.1 Australia Power Supply Market, By Output Power |
6.1.1 Overview and Analysis |
6.1.2 Australia Power Supply Market Revenues & Volume, By Output Power, 2022-2032F |
6.1.3 Australia Power Supply Market Revenues & Volume, By Power Supply With Low Output (500 W and Below), 2022-2032F |
6.1.4 Australia Power Supply Market Revenues & Volume, By Power Supply With Medium Output (500?1,000 W), 2022-2032F |
6.1.5 Australia Power Supply Market Revenues & Volume, By Power Supply With High Output (More Than 1,000 W), 2022-2032F |
6.2 Australia Power Supply Market, By Type |
6.2.1 Overview and Analysis |
6.2.2 Australia Power Supply Market Revenues & Volume, By AC-DC Power Supply, 2022-2032F |
6.2.3 Australia Power Supply Market Revenues & Volume, By DC-DC Power Supply, 2022-2032F |
6.3 Australia Power Supply Market, By Vertical |
6.3.1 Overview and Analysis |
6.3.2 Australia Power Supply Market Revenues & Volume, By Medical & Healthcare, 2022-2032F |
6.3.3 Australia Power Supply Market Revenues & Volume, By Military & Aerospace, 2022-2032F |
6.3.4 Australia Power Supply Market Revenues & Volume, By Telecommunications, 2022-2032F |
6.3.5 Australia Power Supply Market Revenues & Volume, By Consumer Electronics, 2022-2032F |
6.3.6 Australia Power Supply Market Revenues & Volume, By Transportation, 2022-2032F |
6.3.7 Australia Power Supply Market Revenues & Volume, By Lighting, 2022-2032F |
6.3.8 Australia Power Supply Market Revenues & Volume, By Industrial, 2022-2032F |
6.3.9 Australia Power Supply Market Revenues & Volume, By Industrial, 2022-2032F |
7 Australia Power Supply Market Import-Export Trade Statistics |
7.1 Australia Power Supply Market Export to Major Countries |
7.2 Australia Power Supply Market Imports from Major Countries |
8 Australia Power Supply Market Key Performance Indicators |
8.1 Average capacity utilization rate of power generation facilities |
8.2 Percentage of electricity generated from renewable sources |
8.3 Investment in research and development for new power supply technologies |
9 Australia Power Supply Market - Opportunity Assessment |
9.1 Australia Power Supply Market Opportunity Assessment, By Output Power, 2022 & 2032F |
9.2 Australia Power Supply Market Opportunity Assessment, By Type, 2022 & 2032F |
9.3 Australia Power Supply Market Opportunity Assessment, By Vertical, 2022 & 2032F |
10 Australia Power Supply Market - Competitive Landscape |
10.1 Australia Power Supply Market Revenue Share, By Companies, 2025 |
10.2 Australia Power Supply Market Competitive Benchmarking, By Operating and Technical Parameters |
11 Company Profiles |
12 Recommendations |
13 Disclaimer |
Global Go To Market Strategy - 2030
Export potential enables firms to identify high-growth global markets with greater confidence by combining advanced trade intelligence with a structured quantitative methodology. The framework analyzes emerging demand trends and country-level import patterns while integrating macroeconomic and trade datasets such as GDP and population forecasts, bilateral import–export flows, tariff structures, elasticity differentials between developed and developing economies, geographic distance, and import demand projections. Using weighted trade values from 2020–2024 as the base period to project country-to-country export potential for 2030, these inputs are operationalized through calculated drivers such as gravity model parameters, tariff impact factors, and projected GDP per-capita growth. Through an analysis of hidden potentials, demand hotspots, and market conditions that are most favorable to success, this method enables firms to focus on target countries, maximize returns, and global expansion with data, backed by accuracy.
By factoring in the projected importer demand gap that is currently unmet and could be potential opportunity, it identifies the potential for the Exporter (Country) among 190 countries, against the general trade analysis, which identifies the biggest importer or exporter.
To discover high-growth global markets and optimize your business strategy:
Click Here
Pricing
- Single User License$ 1,995
- Department License$ 2,400
- Site License$ 3,120
- Global License$ 3,795

Leadership Perspectives from Industry Events
Search
Thought Leadership and Analyst Meet


Our Clients
6WResearch In News
- India Air Conditioner Market Set for Strong Rebound in 2026 After Weather-Led Correction and GST-Driven Recovery: 6Wresearch
- ADAS in India: How Automatic Emergency Braking, Blind Spot Detection & Driver Monitoring are Transforming Road Safety
- Doha a strategic location for EV manufacturing hub: IPA Qatar
- Demand for luxury TVs surging in the GCC, says Samsung
- Empowering Growth: The Thriving Journey of Bangladesh’s Cable Industry
- Demand for luxury TVs surging in the GCC, says Samsung
Latest Reports
- Nicaragua RPG Gaming Market (2026-2032)
- New Zealand RPG Gaming Market (2026-2032)
- Netherlands RPG Gaming Market (2026-2032)
- Nauru RPG Gaming Market (2026-2032)
- Namibia RPG Gaming Market (2026-2032)
- Mozambique RPG Gaming Market (2026-2032)
- Montenegro RPG Gaming Market (2026-2032)
- Mongolia RPG Gaming Market (2026-2032)
- Monaco RPG Gaming Market (2026-2032)
- Micronesia RPG Gaming Market (2026-2032)
Industry Events and Analyst Meet

HIMTEX 2026

India Refining Summit 2026

India EV Show 2026

EV tech India Expo 2026

Auto Tech Asia 2026
Whitepaper
- Middle East & Africa Commercial Security Market Click here to view more.
- Middle East & Africa Fire Safety Systems & Equipment Market Click here to view more.
- GCC Drone Market Click here to view more.
- Middle East Lighting Fixture Market Click here to view more.
- GCC Physical & Perimeter Security Market Click here to view more.