Australia Pure Cashmere Market (2026-2032) Outlook | Share, Trends, Value, Revenue, Size, Growth, Analysis, Forecast, Industry & Companies
Market Forecast By Type (White Cashmere, Cyan Cashmere, Purple Cashmere), By End Users (Female, Male, Child), By Applications (Cashmere Clothing, Cashmere Accessory, Cashmere Home Textiles) And Competitive Landscape
| Product Code: ETC236555 | Publication Date: Aug 2022 | Updated Date: Mar 2026 | Product Type: Market Research Report | |
| Publisher: 6Wresearch | Author: Ravi Bhandari | No. of Pages: 75 | No. of Figures: 35 | No. of Tables: 20 |
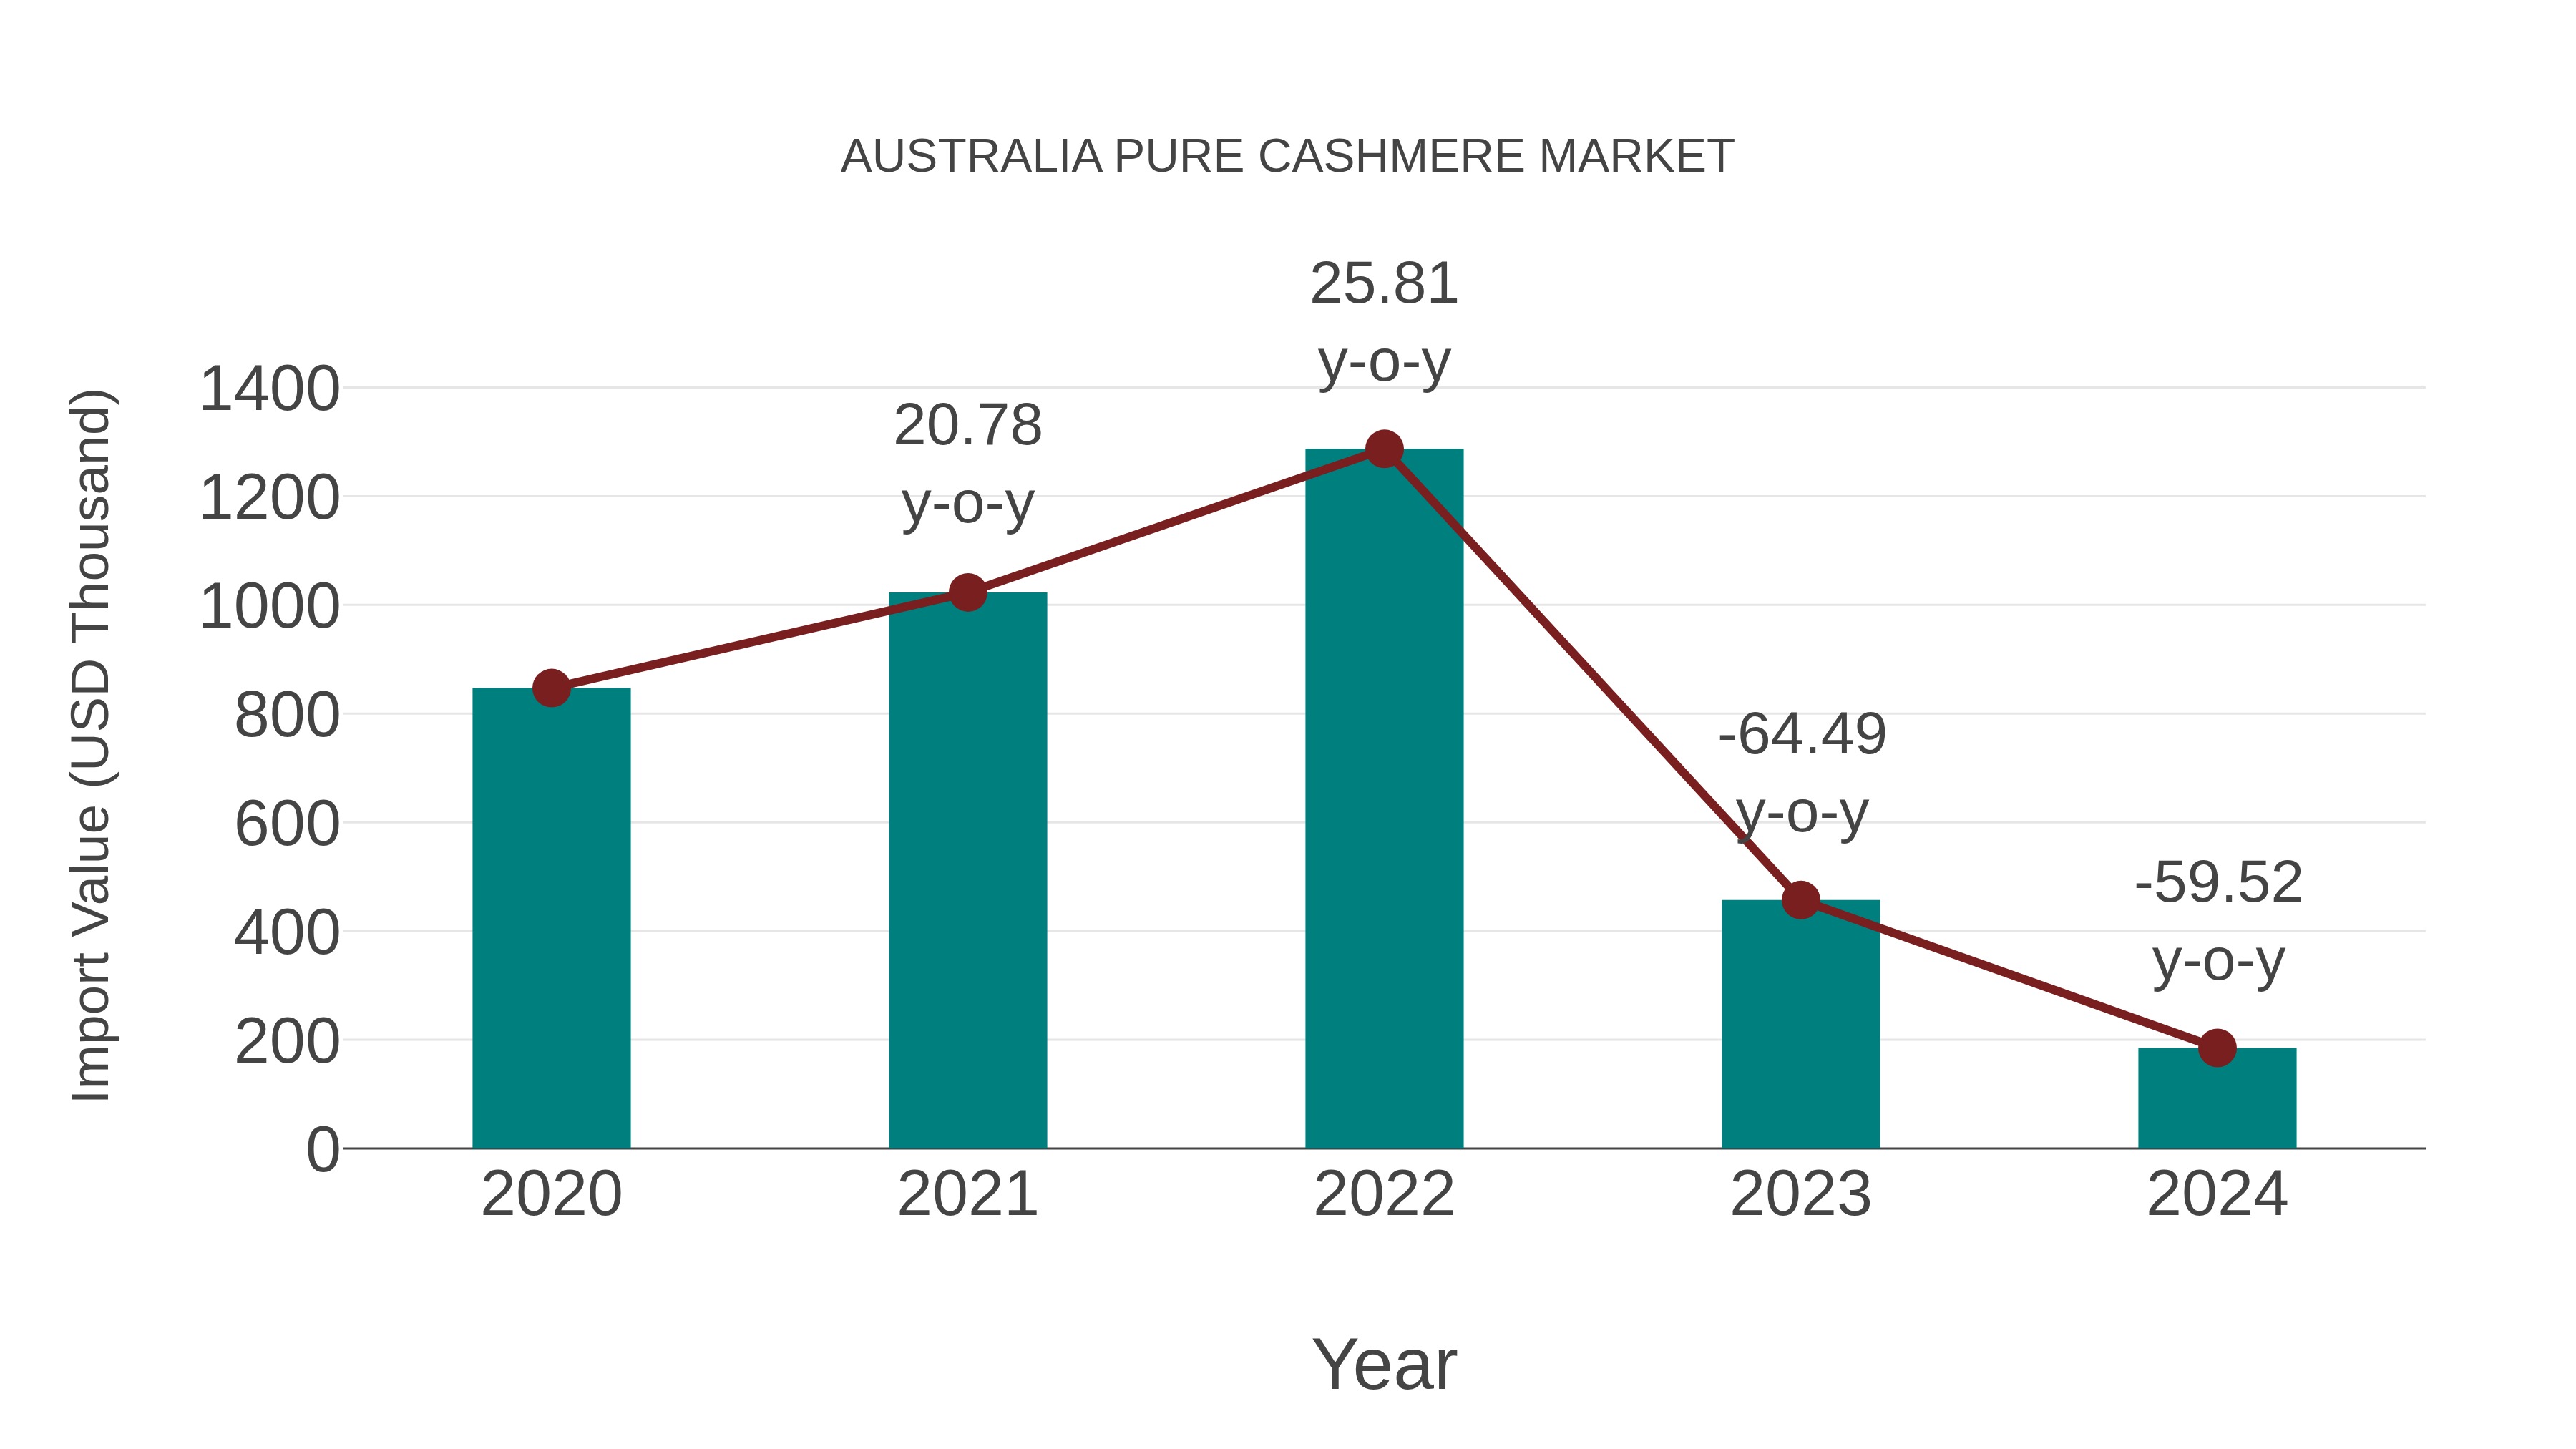
Australia Pure Cashmere Market: Import Trend Analysis
In the Australia pure cashmere market, the import trend experienced a significant decline from 2023 to 2024, with a negative growth rate of -59.52%. The compound annual growth rate (CAGR) for imports during the period 2020-2024 stood at -31.64%. This sharp decrease in import momentum could be attributed to shifting consumer preferences, changes in trade policies, or market instability during that period.
Australia Pure Cashmere Market Synopsis
The pure cashmere market in Australia caters to luxury fashion brands and high-end textile manufacturers. Demand is influenced by premium clothing trends, ethical sourcing concerns, and innovations in sustainable cashmere production.
Drivers of the market
The increasing consumer preference for premium and natural fibers supports the pure cashmere market. High-end fashion brands and luxury apparel manufacturers drive demand. Ethical and sustainable sourcing practices also influence consumer choices.
Challenges of the market
The cashmere market in Australia faces challenges due to ethical concerns over animal welfare and the environmental impact of goat farming. High production costs and competition from synthetic and blended alternatives further impact market growth. Additionally, fluctuating international demand makes pricing unstable.
Investment opportunities in the Market
The growing demand for luxury and sustainable fashion has boosted the pure cashmere market in Australia. Investing in high-quality, ethically sourced cashmere products can attract premium buyers.
Government Policy of the market
The pure cashmere market is subject to textile industry regulations and trade policies. The Australian government enforces labeling standards to prevent the sale of counterfeit or blended cashmere products. Sustainable farming and animal welfare laws regulate the production of cashmere to ensure ethical sourcing. Trade policies promote the export of high-quality Australian cashmere while controlling imports to prevent market saturation with lower-quality alternatives.
Key Highlights of the Report:
- Australia Pure Cashmere Market Outlook
- Market Size of Australia Pure Cashmere Market, 2025
- Forecast of Australia Pure Cashmere Market, 2032
- Historical Data and Forecast of Australia Pure Cashmere Revenues & Volume for the Period 2022-2032F
- Australia Pure Cashmere Market Trend Evolution
- Australia Pure Cashmere Market Drivers and Challenges
- Australia Pure Cashmere Price Trends
- Australia Pure Cashmere Porter's Five Forces
- Australia Pure Cashmere Industry Life Cycle
- Historical Data and Forecast of Australia Pure Cashmere Market Revenues & Volume By Type for the Period 2022-2032F
- Historical Data and Forecast of Australia Pure Cashmere Market Revenues & Volume By White Cashmere for the Period 2022-2032F
- Historical Data and Forecast of Australia Pure Cashmere Market Revenues & Volume By Cyan Cashmere for the Period 2022-2032F
- Historical Data and Forecast of Australia Pure Cashmere Market Revenues & Volume By Purple Cashmere for the Period 2022-2032F
- Historical Data and Forecast of Australia Pure Cashmere Market Revenues & Volume By End Users for the Period 2022-2032F
- Historical Data and Forecast of Australia Pure Cashmere Market Revenues & Volume By Female for the Period 2022-2032F
- Historical Data and Forecast of Australia Pure Cashmere Market Revenues & Volume By Male for the Period 2022-2032F
- Historical Data and Forecast of Australia Pure Cashmere Market Revenues & Volume By Child for the Period 2022-2032F
- Historical Data and Forecast of Australia Pure Cashmere Market Revenues & Volume By Applications for the Period 2022-2032F
- Historical Data and Forecast of Australia Pure Cashmere Market Revenues & Volume By Cashmere Clothing for the Period 2022-2032F
- Historical Data and Forecast of Australia Pure Cashmere Market Revenues & Volume By Cashmere Accessory for the Period 2022-2032F
- Historical Data and Forecast of Australia Pure Cashmere Market Revenues & Volume By Cashmere Home Textiles for the Period 2022-2032F
- Australia Pure Cashmere Import Export Trade Statistics
- Market Opportunity Assessment By Type
- Market Opportunity Assessment By End Users
- Market Opportunity Assessment By Applications
- Australia Pure Cashmere Top Companies Market Share
- Australia Pure Cashmere Competitive Benchmarking By Technical and Operational Parameters
- Australia Pure Cashmere Company Profiles
- Australia Pure Cashmere Key Strategic Recommendations
Australia Pure Cashmere Market (2026-2032): FAQs
6Wresearch actively monitors the Australia Pure Cashmere Market and publishes its comprehensive annual report, highlighting emerging trends, growth drivers, revenue analysis, and forecast outlook. Our insights help businesses to make data-backed strategic decisions with ongoing market dynamics. Our analysts track relevent industries related to the Australia Pure Cashmere Market, allowing our clients with actionable intelligence and reliable forecasts tailored to emerging regional needs.
Yes, we provide customisation as per your requirements. To learn more, feel free to contact us on sales@6wresearch.com
1 Executive Summary |
2 Introduction |
2.1 Key Highlights of the Report |
2.2 Report Description |
2.3 Market Scope & Segmentation |
2.4 Research Methodology |
2.5 Assumptions |
3 Australia Pure Cashmere Market Overview |
3.1 Australia Country Macro Economic Indicators |
3.2 Australia Pure Cashmere Market Revenues & Volume, 2022 & 2032F |
3.3 Australia Pure Cashmere Market - Industry Life Cycle |
3.4 Australia Pure Cashmere Market - Porter's Five Forces |
3.5 Australia Pure Cashmere Market Revenues & Volume Share, By Type, 2022 & 2032F |
3.6 Australia Pure Cashmere Market Revenues & Volume Share, By End Users, 2022 & 2032F |
3.7 Australia Pure Cashmere Market Revenues & Volume Share, By Applications, 2022 & 2032F |
4 Australia Pure Cashmere Market Dynamics |
4.1 Impact Analysis |
4.2 Market Drivers |
4.2.1 Increasing demand for premium, sustainable, and luxury products in the fashion industry |
4.2.2 Growing awareness and appreciation for the quality and softness of cashmere among Australian consumers |
4.2.3 Rising disposable income levels and changing lifestyle preferences favoring high-quality and durable clothing |
4.3 Market Restraints |
4.3.1 Fluctuations in cashmere prices due to factors like supply chain disruptions, weather conditions affecting cashmere goat herding, and global economic uncertainties |
4.3.2 Competition from alternative luxury materials or synthetic fibers that offer similar benefits at lower costs |
5 Australia Pure Cashmere Market Trends |
6 Australia Pure Cashmere Market, By Types |
6.1 Australia Pure Cashmere Market, By Type |
6.1.1 Overview and Analysis |
6.1.2 Australia Pure Cashmere Market Revenues & Volume, By Type, 2022-2032F |
6.1.3 Australia Pure Cashmere Market Revenues & Volume, By White Cashmere, 2022-2032F |
6.1.4 Australia Pure Cashmere Market Revenues & Volume, By Cyan Cashmere, 2022-2032F |
6.1.5 Australia Pure Cashmere Market Revenues & Volume, By Purple Cashmere, 2022-2032F |
6.2 Australia Pure Cashmere Market, By End Users |
6.2.1 Overview and Analysis |
6.2.2 Australia Pure Cashmere Market Revenues & Volume, By Female, 2022-2032F |
6.2.3 Australia Pure Cashmere Market Revenues & Volume, By Male, 2022-2032F |
6.2.4 Australia Pure Cashmere Market Revenues & Volume, By Child, 2022-2032F |
6.3 Australia Pure Cashmere Market, By Applications |
6.3.1 Overview and Analysis |
6.3.2 Australia Pure Cashmere Market Revenues & Volume, By Cashmere Clothing, 2022-2032F |
6.3.3 Australia Pure Cashmere Market Revenues & Volume, By Cashmere Accessory, 2022-2032F |
6.3.4 Australia Pure Cashmere Market Revenues & Volume, By Cashmere Home Textiles, 2022-2032F |
7 Australia Pure Cashmere Market Import-Export Trade Statistics |
7.1 Australia Pure Cashmere Market Export to Major Countries |
7.2 Australia Pure Cashmere Market Imports from Major Countries |
8 Australia Pure Cashmere Market Key Performance Indicators |
8.1 Average retail price of pure cashmere products in Australia |
8.2 Number of new entrants or brands entering the Australian pure cashmere market |
8.3 Consumer sentiment towards sustainable and ethical fashion practices in relation to cashmere products |
8.4 Percentage of Australian consumers willing to pay a premium for authentic and high-quality pure cashmere products |
8.5 Adoption rate of sustainable practices within the Australian cashmere supply chain |
9 Australia Pure Cashmere Market - Opportunity Assessment |
9.1 Australia Pure Cashmere Market Opportunity Assessment, By Type, 2022 & 2032F |
9.2 Australia Pure Cashmere Market Opportunity Assessment, By End Users, 2022 & 2032F |
9.3 Australia Pure Cashmere Market Opportunity Assessment, By Applications, 2022 & 2032F |
10 Australia Pure Cashmere Market - Competitive Landscape |
10.1 Australia Pure Cashmere Market Revenue Share, By Companies, 2025 |
10.2 Australia Pure Cashmere Market Competitive Benchmarking, By Operating and Technical Parameters |
11 Company Profiles |
12 Recommendations |
13 Disclaimer |
Global Go To Market Strategy - 2030
Export potential enables firms to identify high-growth global markets with greater confidence by combining advanced trade intelligence with a structured quantitative methodology. The framework analyzes emerging demand trends and country-level import patterns while integrating macroeconomic and trade datasets such as GDP and population forecasts, bilateral import–export flows, tariff structures, elasticity differentials between developed and developing economies, geographic distance, and import demand projections. Using weighted trade values from 2020–2024 as the base period to project country-to-country export potential for 2030, these inputs are operationalized through calculated drivers such as gravity model parameters, tariff impact factors, and projected GDP per-capita growth. Through an analysis of hidden potentials, demand hotspots, and market conditions that are most favorable to success, this method enables firms to focus on target countries, maximize returns, and global expansion with data, backed by accuracy.
By factoring in the projected importer demand gap that is currently unmet and could be potential opportunity, it identifies the potential for the Exporter (Country) among 190 countries, against the general trade analysis, which identifies the biggest importer or exporter.
To discover high-growth global markets and optimize your business strategy:
Click Here
Pricing
- Single User License$ 1,995
- Department License$ 2,400
- Site License$ 3,120
- Global License$ 3,795

Leadership Perspectives from Industry Events
Search
Thought Leadership and Analyst Meet


Our Clients
6WResearch In News
- India Air Conditioner Market Set for Strong Rebound in 2026 After Weather-Led Correction and GST-Driven Recovery: 6Wresearch
- ADAS in India: How Automatic Emergency Braking, Blind Spot Detection & Driver Monitoring are Transforming Road Safety
- Doha a strategic location for EV manufacturing hub: IPA Qatar
- Demand for luxury TVs surging in the GCC, says Samsung
- Empowering Growth: The Thriving Journey of Bangladesh’s Cable Industry
- Demand for luxury TVs surging in the GCC, says Samsung
Latest Reports
- Nicaragua RPG Gaming Market (2026-2032)
- New Zealand RPG Gaming Market (2026-2032)
- Netherlands RPG Gaming Market (2026-2032)
- Nauru RPG Gaming Market (2026-2032)
- Namibia RPG Gaming Market (2026-2032)
- Mozambique RPG Gaming Market (2026-2032)
- Montenegro RPG Gaming Market (2026-2032)
- Mongolia RPG Gaming Market (2026-2032)
- Monaco RPG Gaming Market (2026-2032)
- Micronesia RPG Gaming Market (2026-2032)
Industry Events and Analyst Meet

HIMTEX 2026

India Refining Summit 2026

India EV Show 2026

EV tech India Expo 2026

Auto Tech Asia 2026
Whitepaper
- Middle East & Africa Commercial Security Market Click here to view more.
- Middle East & Africa Fire Safety Systems & Equipment Market Click here to view more.
- GCC Drone Market Click here to view more.
- Middle East Lighting Fixture Market Click here to view more.
- GCC Physical & Perimeter Security Market Click here to view more.