Australia Shaft Couplings Market (2026-2032) | Size, Growth, Industry, Analysis, Companies, Forecast, Share, Trends, Outlook, Revenue & Value
Market Forecast By Type (Flexible Couplings, Disc Rigid Couplings), By Application (Power and Energy, Automotive Industry, Steel Industry) And Competitive Landscape
| Product Code: ETC043275 | Publication Date: Jan 2021 | Updated Date: Jun 2026 | Product Type: Report | |
| Publisher: 6Wresearch | Author: Ravi Bhandari | No. of Pages: 70 | No. of Figures: 35 | No. of Tables: 5 |
Australia Shaft Couplings Market Summary
The australia shaft couplings market was estimated at USD 129 Million in 2025 and is projected to reach USD 151 Million by 2032, growing at a CAGR of 2.4% from 2026 to 2032.
Australia Shaft Couplings Market Growth Rate Analysis (2021-2032)
The Australia Shaft Couplings market has experienced a notable rebound since 2021, recovering from a slight decline of -0.7% that year to achieve a robust growth of 5.5% in 2022. This upward trend has been driven by increased investments in infrastructure projects and the energy sector, coupled with rising consumer demand for efficient mechanical solutions. Growth rates stabilized around 5.1% in 2023, before gradually moderating to 2.1% by 2028. Contributing factors include advancements in technology, the shift towards digitalization, and supportive government policies favoring industrial innovation. As the market evolves, steady demand for high-performance couplings remains critical, with further potential for growth in the coming years.
Australia Shaft Couplings Market Year-wise Growth Rate and Key Drivers
This graph highlights how the Australia Shaft Couplings Market has steadily grown over the past five years, supported by major growth factors.
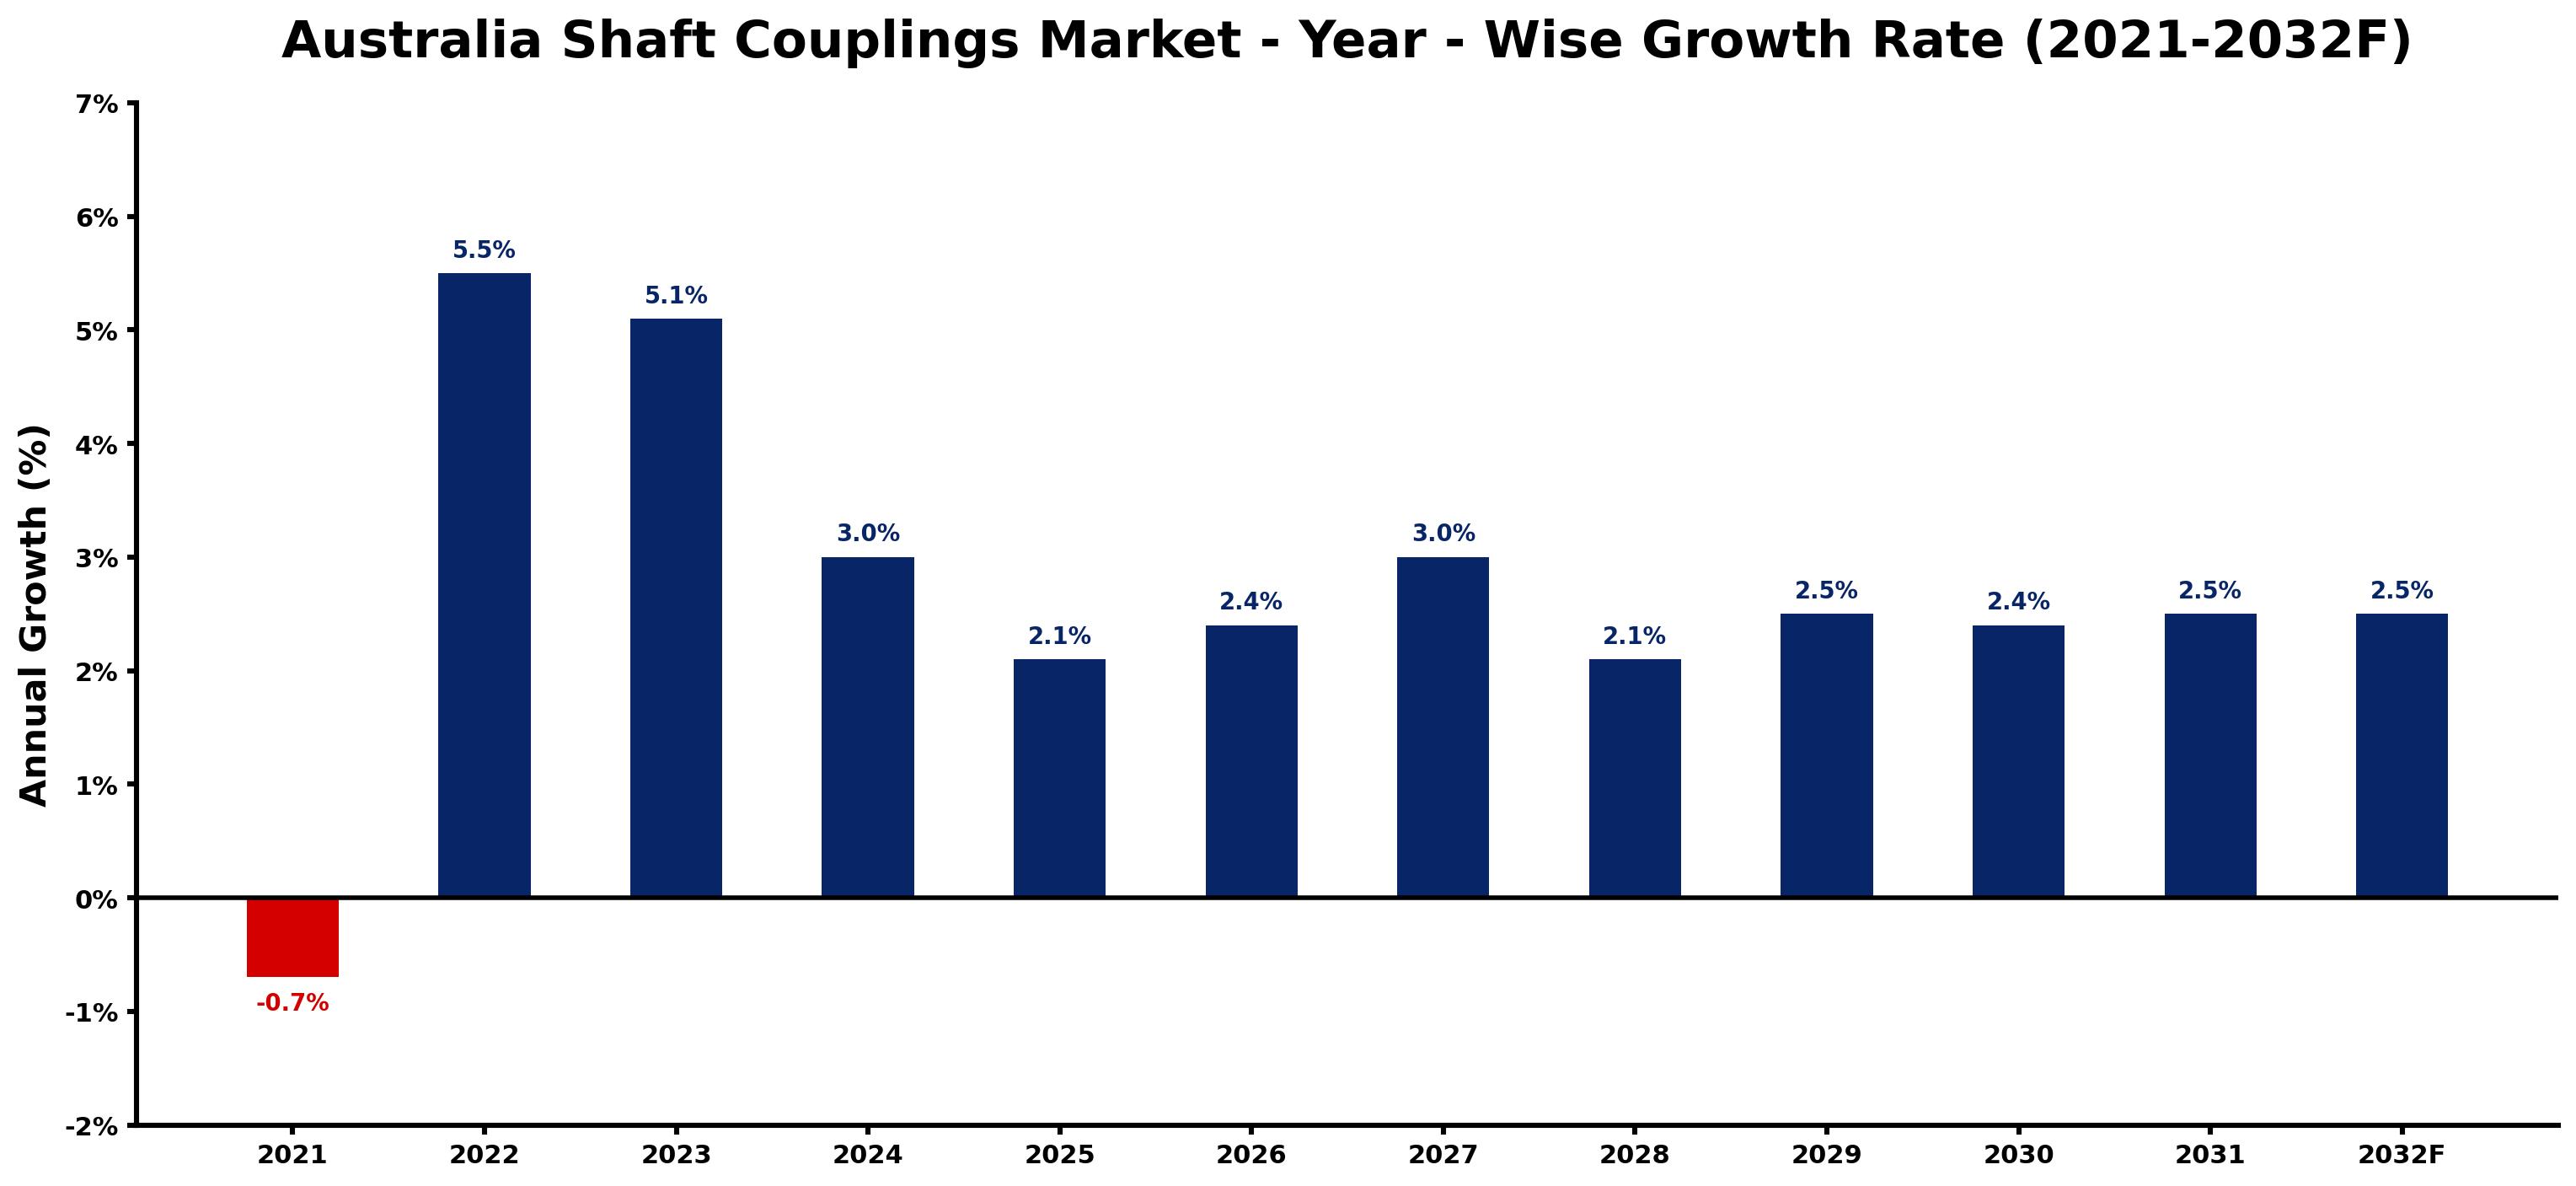
The table below presents the year wise growth rates along with the key drivers influencing the market
| Year | Growth Rate | Major Drivers |
| 2021 | -0.7% | Supply chain disruptions led to extended delivery times, negatively impacting construction and machinery sector investments. |
| 2022 | 5.5% | Increased construction activities in infrastructure projects boosted the demand for reliable couplings. |
| 2023 | 5.1% | Emerging technologies in automation fostered higher precision requirements for mechanical components. |
| 2024 | 3.0% | A shift towards more sustainable energy sources influenced coupling material innovation and production. |
| 2025 | 2.1% | Manufacturers sought partnerships with local suppliers to enhance agility and reduce lead times. |
| 2026 | 2.4% | Industry 4.0 initiatives prompted investments in smart systems integrating shaft couplings. |
| 2027 | 3.0% | Growing focus on maintenance efficiency encouraged predictive analytics for coupling usage. |
| 2028 | 2.1% | Emerging sectors like renewable energy necessitated specialized couplings for wind and solar applications. |
| 2029 | 2.5% | Rising urbanization trends spurred demand for transportation infrastructure and related components. |
| 2030 | 2.4% | Economic recovery post-pandemic fueled industrial growth and reliance on coupling technology. |
| 2031 | 2.5% | Technological advancements in materials science led to stronger, lighter coupling options in the market. |
| 2032 | 2.5% | The global shift towards less carbon-intensive operations created opportunities for innovative coupling solutions. |
Note - Market size estimations and growth projections presented in this report are based on 6Wresearch's advanced forecasting approach, validated with industry datasets as of June 2026.
Australia Shaft Couplings Market Synopsis
The Australia Shaft Couplings Market is projected to reach 2.4% and witness significant growth during the forecast period (2026-2032). This market is essential in the field of mechanical engineering and industrial applications, where the role of shaft couplings is paramount for connecting rotating shafts to efficiently transmit power. With a rising emphasis on durability and high performance, the Australia Shaft Couplings market underscores the necessity for reliable coupling solutions across a multitude of industries.
Australia Shaft Couplings Market Growth Drivers
The Australia Shaft Couplings market is experiencing robust growth, primarily fueled by advancements in the industrial and manufacturing sectors. Key drivers include:
- The burgeoning automotive sector necessitates reliable coupling solutions to enhance vehicle performance, thereby significantly boosting the demand for shaft couplings.
- An increase in renewable energy projects, particularly in wind and solar energy, has led to a surge in demand for efficient power transmission devices, including shaft couplings.
- The machinery manufacturing industry continues to expand, creating a necessity for durable coupling systems that can withstand high operating loads and improve overall machinery efficiency.
- As industries focus on enhancing operational efficiency and minimizing downtime, the demand for advanced shaft coupling technologies is set to rise, further propelling market growth.
- The shift towards automation in industrial applications is demanding more sophisticated coupling solutions, thus driving innovation and growth in the Australia Shaft Couplings market.
Australia Shaft Couplings Market Challenges and Restraints
Despite its growth potential, the Australia Shaft Couplings market faces several challenges that could impede its progress:
- Precision engineering demands and the necessity for high-quality material selection are critical in producing effective shaft couplings, presenting a challenge for manufacturers.
- Addressing issues related to misalignment in machinery can complicate the design and implementation of shaft couplings, impacting performance and reliability.
- Vibration management in rotating systems requires advanced engineering solutions, adding to the complexity of coupling design.
- Maintaining compatibility across different machinery types poses significant engineering hurdles that need to be overcome continually.
- Staying abreast of evolving industry standards and technological advancements is essential for manufacturers, yet it can also be resource-intensive.
Australia Shaft Couplings Market Regional Analysis
The regional dynamics of the Australia Shaft Couplings market are influenced by a diverse industrial landscape. Various sectors, including automotive, manufacturing, and energy generation, present unique opportunities and challenges:
- Eastern Australia, with its concentration of manufacturing activities, is likely to be a key market for shaft couplings, driven by sustained industrial growth in this region.
- Western Australia's increasing investments in renewable energy initiatives could result in heightened demand for shaft couplings designed for energy generation and transmission.
- The central regions of Australia, while less industrialized, may witness growth through the development of new manufacturing hubs and technology parks.
- Increased collaborations between industry players and government entities are anticipated to foster innovation in coupling technologies across the nation.
- Overall, the regional landscape reflects a combination of established industrial bases and emerging sectors, positioning the Australia Shaft Couplings market for sustained growth.
Australia Shaft Couplings Market Government Investment and Initiatives
The role of government policy in shaping the Australia Shaft Couplings market is significant. Various initiatives aim to encourage innovation, safety, and standardization in this critical sector:
- The Australian government is focused on enhancing manufacturing capabilities, with policies designed to foster research and development in advanced materials and engineering solutions.
- Public investments in infrastructure projects, particularly in transport and energy sectors, often necessitate advanced coupling technologies, providing a boost to the market.
- Incentives for sustainable practices are encouraging manufacturers to develop eco-friendly coupling solutions, aligning with global environmental goals.
- Regulatory frameworks established to ensure safety and reliability in machinery applications provide a stable environment for the growth of the shaft couplings market.
- Collaboration between government and industry stakeholders is crucial for addressing emerging challenges and facilitating technological advancements in shaft coupling systems.
Australia Shaft Couplings Market Latest Developments (May 2025 - June 2026)
In the period spanning May 2025 to June 2026, the Australia Shaft Couplings market has seen notable developments as industries adapt to emerging technologies and evolving demands:
- A significant trend has emerged within the industry focused on the development of lightweight, high-strength materials that enhance the performance of shaft couplings.
- Growing interest in predictive maintenance technologies has led to innovations that integrate advanced sensors with coupling systems, improving operational efficiency.
- Collaborative research initiatives among universities and industries are aimed at fostering innovative coupling designs that can meet the specific needs of various applications.
- The push towards automation in industrial processes is leading to an increase in demand for smart coupling systems that provide real-time monitoring and diagnostics.
- Overall, the period has been characterized by a strong focus on innovation and adaptation, aligning with the broader trends of digital transformation and sustainability.
Australia Shaft Couplings Market - Key Attractiveness of the Report
- 10 Years of Market Numbers
- Historical Data Starting from 2022 to 2025
- Base Year: 2025
- Forecast Data until 2032
- Key Performance Indicators Impacting the Market
- Major Upcoming Developments and Projects
Key Highlights of the Report:
- Australia Shaft Couplings Market Outlook
- Market Size of Australia Shaft Couplings Market, 2025
- Forecast of Australia Shaft Couplings Market, 2032
- Historical Data and Forecast of Australia Shaft Couplings Revenues & Volume for the Period 2022-2032F
- Australia Shaft Couplings Market Trend Evolution
- Australia Shaft Couplings Market Drivers and Challenges
- Australia Shaft Couplings Price Trends
- Australia Shaft Couplings Porter's Five Forces
- Australia Shaft Couplings Industry Life Cycle
- Historical Data and Forecast of Australia Shaft Couplings Market Revenues & Volume By Type for the Period 2022-2032F
- Historical Data and Forecast of Australia Shaft Couplings Market Revenues & Volume By Flexible Couplings for the Period 2022-2032F
- Historical Data and Forecast of Australia Shaft Couplings Market Revenues & Volume By Disc Rigid Couplings for the Period 2022-2032F
- Historical Data and Forecast of Australia Shaft Couplings Market Revenues & Volume By Application for the Period 2022-2032F
- Historical Data and Forecast of Australia Shaft Couplings Market Revenues & Volume By Power and Energy for the Period 2022-2032F
- Historical Data and Forecast of Australia Shaft Couplings Market Revenues & Volume By Automotive Industry for the Period 2022-2032F
- Historical Data and Forecast of Australia Shaft Couplings Market Revenues & Volume By Steel Industry for the Period 2022-2032F
- Australia Shaft Couplings Import Export Trade Statistics
- Market Opportunity Assessment By Type
- Market Opportunity Assessment By Application
- Australia Shaft Couplings Top Companies Market Share
- Australia Shaft Couplings Competitive Benchmarking By Technical and Operational Parameters
- Australia Shaft Couplings Company Profiles
- Australia Shaft Couplings Key Strategic Recommendations
Frequently Asked Questions About the Market Study (FAQs):
Shaft couplings are primarily used in industries such as automotive, energy generation, and machinery manufacturing for efficient power transmission and mechanical connection.
Government policies influence the market through initiatives that promote innovation, standardization, and safety in manufacturing, facilitating growth and development in the sector.
Key challenges include precision engineering requirements, material selection, and the need for compatibility across diverse machinery applications, all of which demand high levels of expertise.
Trends are focusing on the development of lightweight materials, integration of smart technologies, and sustainability initiatives that drive innovation and efficiency within the market.
6Wresearch actively monitors the Australia Shaft Couplings Market and publishes its comprehensive annual report, highlighting emerging trends, growth drivers, revenue analysis, and forecast outlook. Our insights help businesses to make data-backed strategic decisions with ongoing market dynamics. Our analysts track relevent industries related to the Australia Shaft Couplings Market, allowing our clients with actionable intelligence and reliable forecasts tailored to emerging regional needs.
Yes, we provide customisation as per your requirements. To learn more, feel free to contact us on sales@6wresearch.com
1 Executive Summary |
2 Introduction |
2.1 Key Highlights of the Report |
2.2 Report Description |
2.3 Market Scope & Segmentation |
2.4 Research Methodology |
2.5 Assumptions |
3 Australia Shaft Couplings Market Overview |
3.1 Australia Country Macro Economic Indicators |
3.2 Australia Shaft Couplings Market Revenues & Volume, 2022 & 2032F |
3.3 Australia Shaft Couplings Market - Industry Life Cycle |
3.4 Australia Shaft Couplings Market - Porter's Five Forces |
3.5 Australia Shaft Couplings Market Revenues & Volume Share, By Type, 2022 & 2032F |
3.6 Australia Shaft Couplings Market Revenues & Volume Share, By Application, 2022 & 2032F |
4 Australia Shaft Couplings Market Dynamics |
4.1 Impact Analysis |
4.2 Market Drivers |
4.2.1 Increasing industrial automation and machinery manufacturing in Australia |
4.2.2 Growing demand for energy-efficient and high-performance machinery |
4.2.3 Technological advancements leading to the development of innovative shaft couplings |
4.3 Market Restraints |
4.3.1 Volatility in raw material prices affecting manufacturing costs |
4.3.2 Impact of economic downturns on industrial investments and machinery purchases |
5 Australia Shaft Couplings Market Trends |
6 Australia Shaft Couplings Market, By Types |
6.1 Australia Shaft Couplings Market, By Type |
6.1.1 Overview and Analysis |
6.1.2 Australia Shaft Couplings Market Revenues & Volume, By Type, 2022-2032F |
6.1.3 Australia Shaft Couplings Market Revenues & Volume, By Flexible Couplings, 2022-2032F |
6.1.4 Australia Shaft Couplings Market Revenues & Volume, By Disc Rigid Couplings, 2022-2032F |
6.2 Australia Shaft Couplings Market, By Application |
6.2.1 Overview and Analysis |
6.2.2 Australia Shaft Couplings Market Revenues & Volume, By Power and Energy, 2022-2032F |
6.2.3 Australia Shaft Couplings Market Revenues & Volume, By Automotive Industry, 2022-2032F |
6.2.4 Australia Shaft Couplings Market Revenues & Volume, By Steel Industry, 2022-2032F |
7 Australia Shaft Couplings Market Import-Export Trade Statistics |
7.1 Australia Shaft Couplings Market Export to Major Countries |
7.2 Australia Shaft Couplings Market Imports from Major Countries |
8 Australia Shaft Couplings Market Key Performance Indicators |
8.1 Adoption rate of advanced shaft coupling technologies in key industries |
8.2 Number of partnerships and collaborations in the shaft couplings market |
8.3 Percentage of RD investment in developing new shaft coupling products |
8.4 Rate of growth in the Australian industrial machinery sector |
8.5 Number of patents filed for shaft coupling innovations |
9 Australia Shaft Couplings Market - Opportunity Assessment |
9.1 Australia Shaft Couplings Market Opportunity Assessment, By Type, 2022 & 2032F |
9.2 Australia Shaft Couplings Market Opportunity Assessment, By Application, 2022 & 2032F |
10 Australia Shaft Couplings Market - Competitive Landscape |
10.1 Australia Shaft Couplings Market Revenue Share, By Companies, 2025 |
10.2 Australia Shaft Couplings Market Competitive Benchmarking, By Operating and Technical Parameters |
11 Company Profiles |
12 Recommendations |
13 Disclaimer |
Global Go To Market Strategy - 2030
Export potential enables firms to identify high-growth global markets with greater confidence by combining advanced trade intelligence with a structured quantitative methodology. The framework analyzes emerging demand trends and country-level import patterns while integrating macroeconomic and trade datasets such as GDP and population forecasts, bilateral import–export flows, tariff structures, elasticity differentials between developed and developing economies, geographic distance, and import demand projections. Using weighted trade values from 2020–2024 as the base period to project country-to-country export potential for 2030, these inputs are operationalized through calculated drivers such as gravity model parameters, tariff impact factors, and projected GDP per-capita growth. Through an analysis of hidden potentials, demand hotspots, and market conditions that are most favorable to success, this method enables firms to focus on target countries, maximize returns, and global expansion with data, backed by accuracy.
By factoring in the projected importer demand gap that is currently unmet and could be potential opportunity, it identifies the potential for the Exporter (Country) among 190 countries, against the general trade analysis, which identifies the biggest importer or exporter.
To discover high-growth global markets and optimize your business strategy:
Click Here
Pricing
- Single User License$ 1,995
- Department License$ 2,400
- Site License$ 3,120
- Global License$ 3,795

Leadership Perspectives from Industry Events
Search
Thought Leadership and Analyst Meet


Our Clients
6WResearch In News
- India Air Conditioner Market Set for Strong Rebound in 2026 After Weather-Led Correction and GST-Driven Recovery: 6Wresearch
- ADAS in India: How Automatic Emergency Braking, Blind Spot Detection & Driver Monitoring are Transforming Road Safety
- Doha a strategic location for EV manufacturing hub: IPA Qatar
- Demand for luxury TVs surging in the GCC, says Samsung
- Empowering Growth: The Thriving Journey of Bangladesh’s Cable Industry
- Demand for luxury TVs surging in the GCC, says Samsung
Latest Reports
- Nicaragua RPG Gaming Market (2026-2032)
- New Zealand RPG Gaming Market (2026-2032)
- Netherlands RPG Gaming Market (2026-2032)
- Nauru RPG Gaming Market (2026-2032)
- Namibia RPG Gaming Market (2026-2032)
- Mozambique RPG Gaming Market (2026-2032)
- Montenegro RPG Gaming Market (2026-2032)
- Mongolia RPG Gaming Market (2026-2032)
- Monaco RPG Gaming Market (2026-2032)
- Micronesia RPG Gaming Market (2026-2032)
Industry Events and Analyst Meet

HIMTEX 2026

India Refining Summit 2026

India EV Show 2026

EV tech India Expo 2026

Auto Tech Asia 2026
Whitepaper
- Middle East & Africa Commercial Security Market Click here to view more.
- Middle East & Africa Fire Safety Systems & Equipment Market Click here to view more.
- GCC Drone Market Click here to view more.
- Middle East Lighting Fixture Market Click here to view more.
- GCC Physical & Perimeter Security Market Click here to view more.