Australia Silico Manganese Market (2026-2032) Outlook | Value, Analysis, Companies, Size, Share, Revenue, Industry, Growth, Trends & Forecast
Market Forecast By Product (High-Carbon Silico Manganese, Low-Carbon Silico Manganese, Medium-Carbon Silico Manganese), By Application (Automobile Bodies, Road Rails, Dairy Equipment, Hand Railings, Cutlery, Others) And Competitive Landscape
| Product Code: ETC100914 | Publication Date: Jun 2021 | Updated Date: Mar 2026 | Product Type: Report | |
| Publisher: 6Wresearch | Author: Ravi Bhandari | No. of Pages: 70 | No. of Figures: 35 | No. of Tables: 5 |
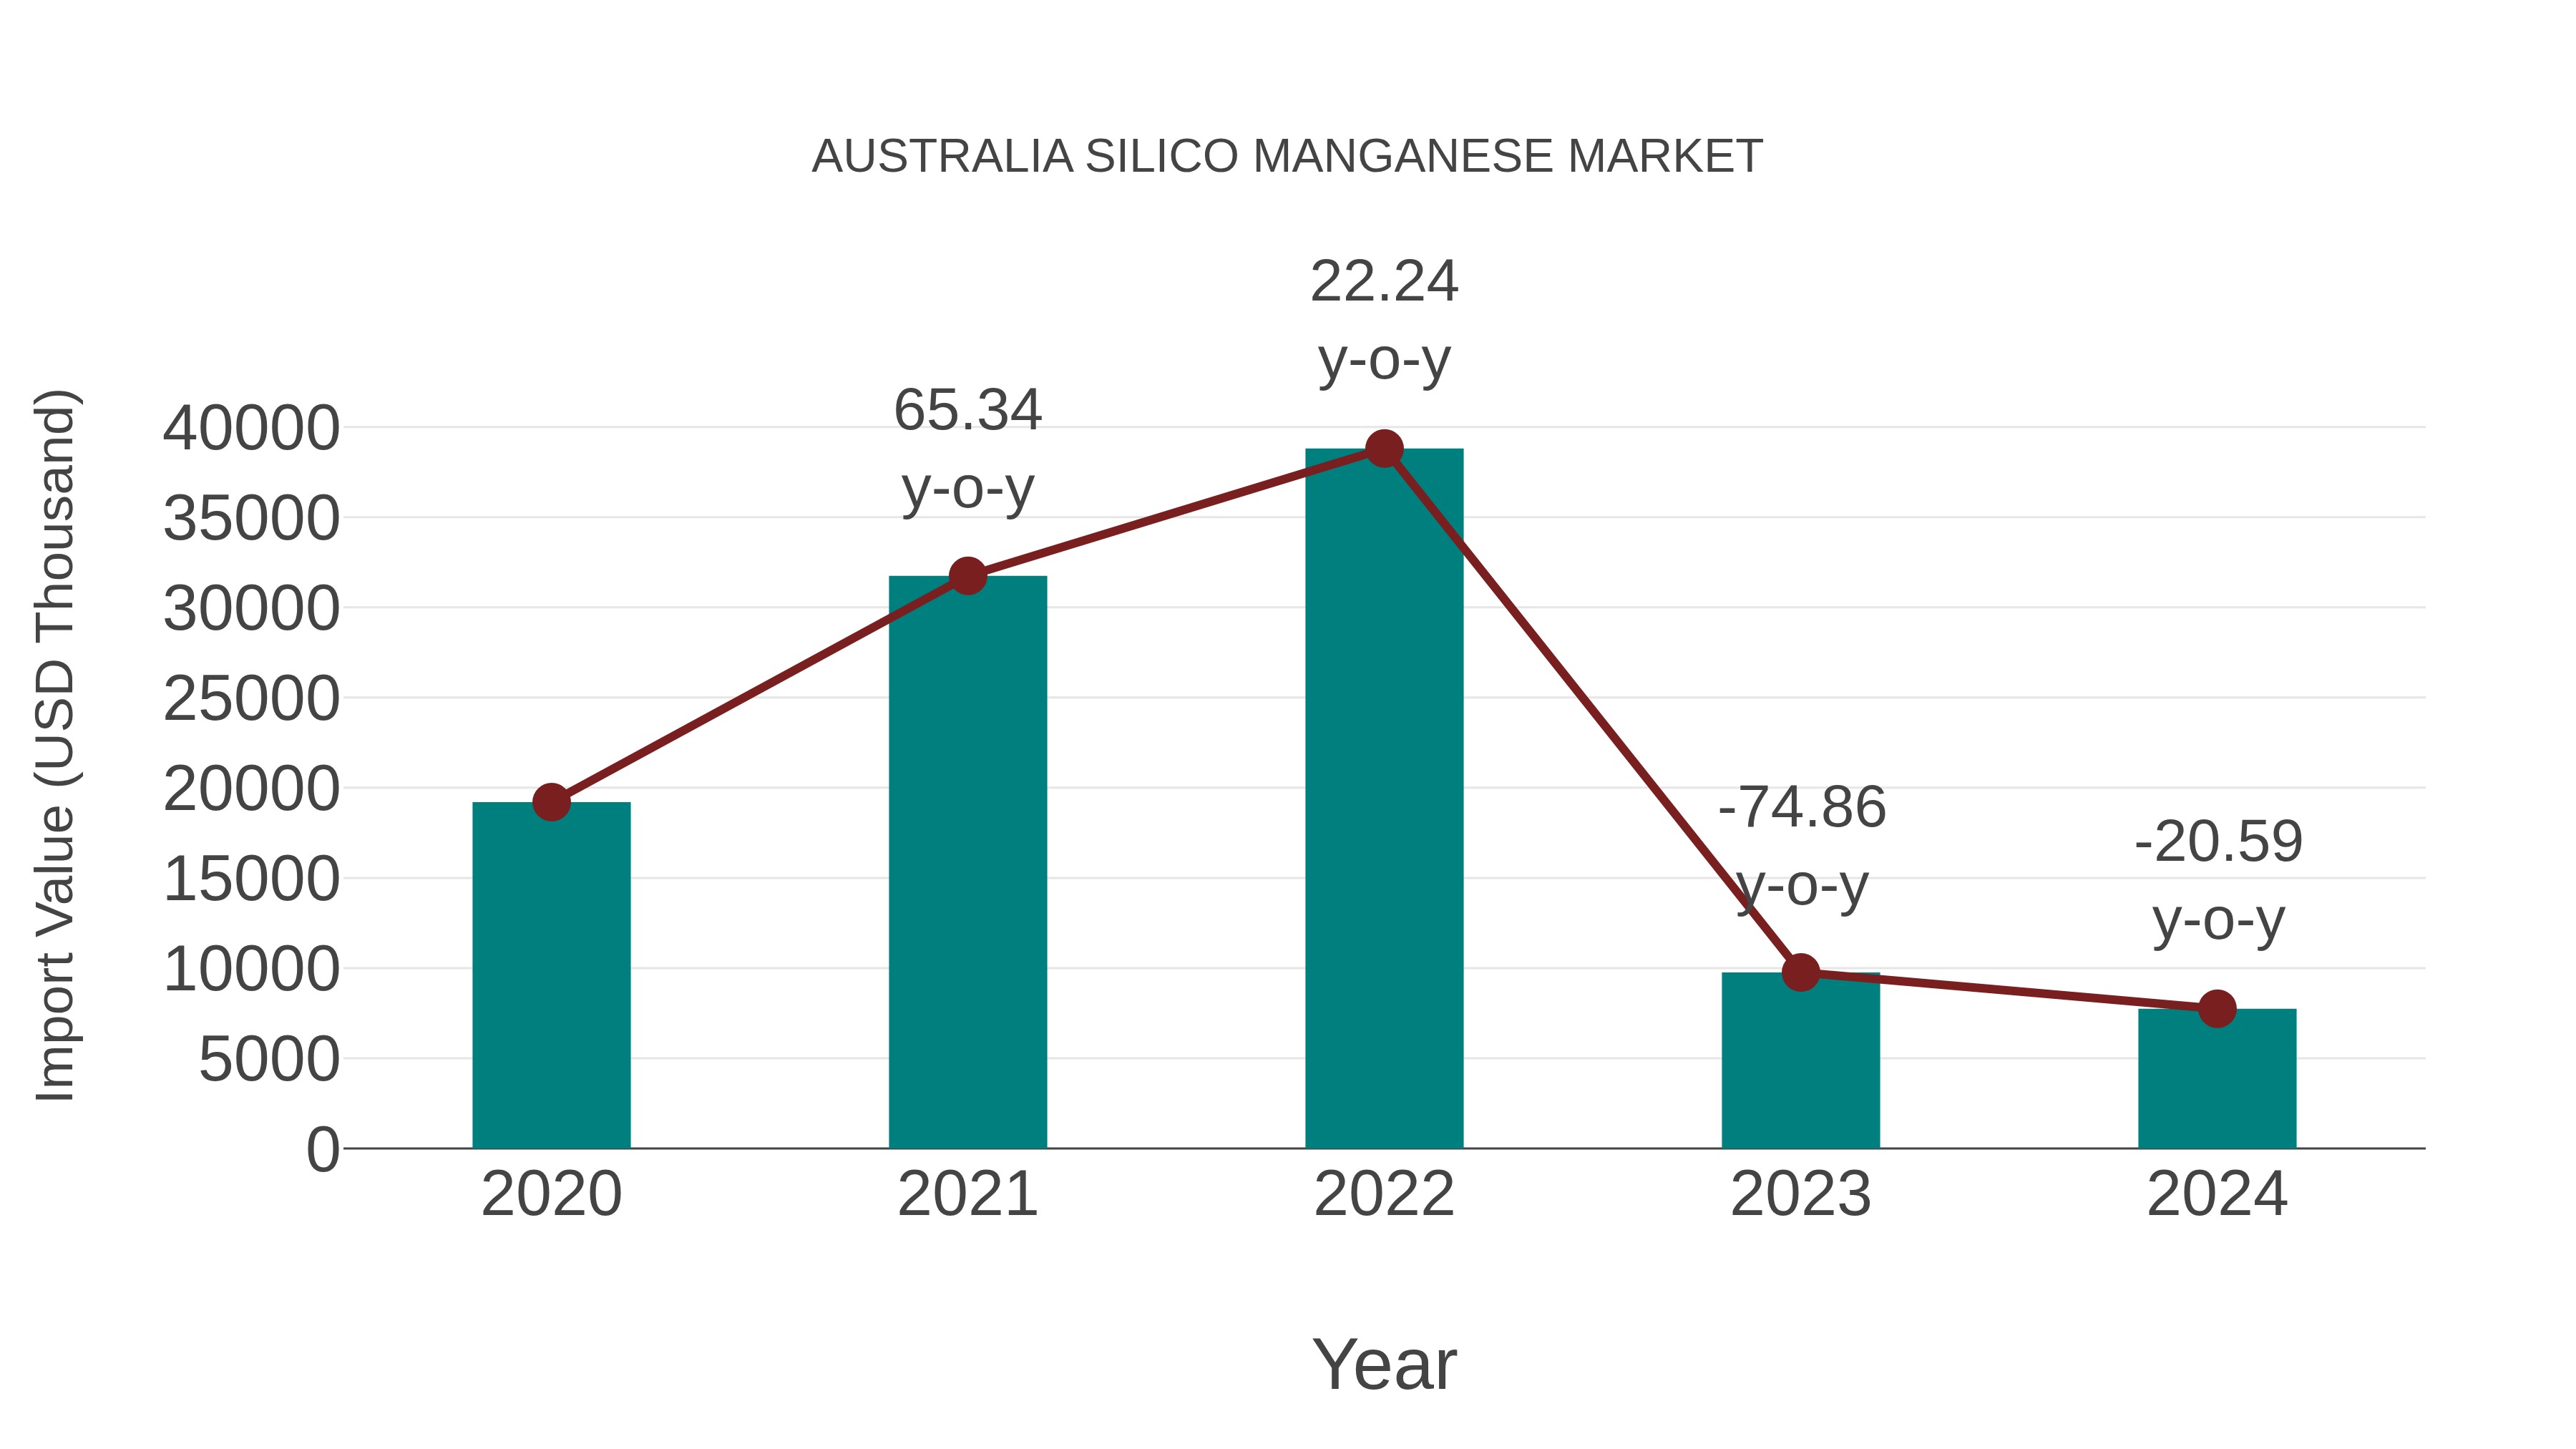
Australia Silico Manganese Market: Import Trend Analysis
Australia`s import trend for the silico manganese market showed a decline from 2023 to 2024, with a growth rate of -20.59% during that period. The compound annual growth rate (CAGR) for imports from 2020 to 2024 was -20.3%. This negative trend could be attributed to shifts in demand dynamics or changes in trade policies impacting market stability.
Australia Silico Manganese Market Overview
In the realm of metallurgy, the silico manganese market in Australia is a key player. Silico manganese, an alloy of manganese, silicon, and iron, finds applications in steel production. As the steel industry evolves and adopts advanced technologies, the demand for high-performance alloys like silico manganese is on the rise, driving market growth.
Drivers of the market
The silico manganese market in Australia is driven by the steel industry`s demand for alloying elements that enhance steel properties. Silico manganese, composed of silicon, manganese, and iron, is utilized in steel production to improve strength, hardness, and resistance to corrosion. As the construction and automotive sectors drive steel consumption, the market for silico manganese experiences growth. Ongoing research and development initiatives focus on optimizing alloy compositions to meet the evolving requirements of the steel industry, ensuring the market`s continued relevance.
Challenges of the market
The Australia Silico Manganese market faces challenges in balancing alloy composition to meet diverse industrial requirements. As the demand for steel alloys fluctuates, manufacturers must navigate the complexities of alloy formulation to ensure optimal strength, durability, and cost-effectiveness. Adapting to market dynamics and technological advancements is crucial for success in the silico manganese industry.
Government Policy of the market
In the context of the Australia silico manganese market, government policies play a pivotal role in ensuring the responsible production and utilization of this essential alloy. Environmental sustainability remains a key concern, prompting the formulation of regulations governing emissions, waste disposal, and resource management in silico manganese production. The government actively promotes the adoption of clean and energy-efficient technologies within the industry. Furthermore, there are initiatives to incentivize investments in research and development, encouraging innovation that aligns with global environmental standards.
Key Highlights of the Report:
- Australia Silico Manganese Market Outlook
- Market Size of Australia Silico Manganese Market, 2025
- Forecast of Australia Silico Manganese Market, 2032
- Historical Data and Forecast of Australia Silico Manganese Revenues & Volume for the Period 2022-2032F
- Australia Silico Manganese Market Trend Evolution
- Australia Silico Manganese Market Drivers and Challenges
- Australia Silico Manganese Price Trends
- Australia Silico Manganese Porter's Five Forces
- Australia Silico Manganese Industry Life Cycle
- Historical Data and Forecast of Australia Silico Manganese Market Revenues & Volume By Product for the Period 2022-2032F
- Historical Data and Forecast of Australia Silico Manganese Market Revenues & Volume By High-Carbon Silico Manganese for the Period 2022-2032F
- Historical Data and Forecast of Australia Silico Manganese Market Revenues & Volume By Low-Carbon Silico Manganese for the Period 2022-2032F
- Historical Data and Forecast of Australia Silico Manganese Market Revenues & Volume By Medium-Carbon Silico Manganese for the Period 2022-2032F
- Historical Data and Forecast of Australia Silico Manganese Market Revenues & Volume By Application for the Period 2022-2032F
- Historical Data and Forecast of Australia Silico Manganese Market Revenues & Volume By Automobile Bodies for the Period 2022-2032F
- Historical Data and Forecast of Australia Silico Manganese Market Revenues & Volume By Road Rails for the Period 2022-2032F
- Historical Data and Forecast of Australia Silico Manganese Market Revenues & Volume By Dairy Equipment for the Period 2022-2032F
- Historical Data and Forecast of Australia Silico Manganese Market Revenues & Volume By Hand Railings for the Period 2022-2032F
- Historical Data and Forecast of Australia Silico Manganese Market Revenues & Volume By Cutlery for the Period 2022-2032F
- Historical Data and Forecast of Australia Silico Manganese Market Revenues & Volume By Others for the Period 2022-2032F
- Australia Silico Manganese Import Export Trade Statistics
- Market Opportunity Assessment By Product
- Market Opportunity Assessment By Application
- Australia Silico Manganese Top Companies Market Share
- Australia Silico Manganese Competitive Benchmarking By Technical and Operational Parameters
- Australia Silico Manganese Company Profiles
- Australia Silico Manganese Key Strategic Recommendations
Australia Silico Manganese Market (2026-2032): FAQs
6Wresearch actively monitors the Australia Silico Manganese Market and publishes its comprehensive annual report, highlighting emerging trends, growth drivers, revenue analysis, and forecast outlook. Our insights help businesses to make data-backed strategic decisions with ongoing market dynamics. Our analysts track relevent industries related to the Australia Silico Manganese Market, allowing our clients with actionable intelligence and reliable forecasts tailored to emerging regional needs.
Yes, we provide customisation as per your requirements. To learn more, feel free to contact us on sales@6wresearch.com
1 Executive Summary |
2 Introduction |
2.1 Key Highlights of the Report |
2.2 Report Description |
2.3 Market Scope & Segmentation |
2.4 Research Methodology |
2.5 Assumptions |
3 Australia Silico Manganese Market Overview |
3.1 Australia Country Macro Economic Indicators |
3.2 Australia Silico Manganese Market Revenues & Volume, 2022 & 2032F |
3.3 Australia Silico Manganese Market - Industry Life Cycle |
3.4 Australia Silico Manganese Market - Porter's Five Forces |
3.5 Australia Silico Manganese Market Revenues & Volume Share, By Form, 2022 & 2032F |
3.6 Australia Silico Manganese Market Revenues & Volume Share, By Form, 2022 & 2032F |
4 Australia Silico Manganese Market Dynamics |
4.1 Impact Analysis |
4.2 Market Drivers |
4.2.1 Growing demand for steel production in Australia |
4.2.2 Increasing infrastructure development projects in the country |
4.2.3 Rising use of silico manganese in the manufacturing sector |
4.3 Market Restraints |
4.3.1 Fluctuating prices of raw materials such as manganese ore and silicon |
4.3.2 Environmental regulations impacting production processes |
4.3.3 Competition from substitute materials in steel production |
5 Australia Silico Manganese Market Trends |
6 Australia Silico Manganese Market, By Types |
6.1 Australia Silico Manganese Market, By Product |
6.1.1 Overview and Analysis |
6.1.2 Australia Silico Manganese Market Revenues & Volume, By Product, 2022-2032F |
6.1.3 Australia Silico Manganese Market Revenues & Volume, By High-Carbon Silico Manganese, 2022-2032F |
6.1.4 Australia Silico Manganese Market Revenues & Volume, By Low-Carbon Silico Manganese, 2022-2032F |
6.1.5 Australia Silico Manganese Market Revenues & Volume, By Medium-Carbon Silico Manganese, 2022-2032F |
6.2 Australia Silico Manganese Market, By Application |
6.2.1 Overview and Analysis |
6.2.2 Australia Silico Manganese Market Revenues & Volume, By Automobile Bodies, 2022-2032F |
6.2.3 Australia Silico Manganese Market Revenues & Volume, By Road Rails, 2022-2032F |
6.2.4 Australia Silico Manganese Market Revenues & Volume, By Dairy Equipment, 2022-2032F |
6.2.5 Australia Silico Manganese Market Revenues & Volume, By Hand Railings, 2022-2032F |
6.2.6 Australia Silico Manganese Market Revenues & Volume, By Cutlery, 2022-2032F |
6.2.7 Australia Silico Manganese Market Revenues & Volume, By Others, 2022-2032F |
7 Australia Silico Manganese Market Import-Export Trade Statistics |
7.1 Australia Silico Manganese Market Export to Major Countries |
7.2 Australia Silico Manganese Market Imports from Major Countries |
8 Australia Silico Manganese Market Key Performance Indicators |
8.1 Average selling price of silico manganese |
8.2 Capacity utilization rate of silico manganese production facilities |
8.3 Number of infrastructure projects utilizing silico manganese in Australia |
9 Australia Silico Manganese Market - Opportunity Assessment |
9.1 Australia Silico Manganese Market Opportunity Assessment, By Product, 2022 & 2032F |
9.2 Australia Silico Manganese Market Opportunity Assessment, By Application, 2022 & 2032F |
10 Australia Silico Manganese Market - Competitive Landscape |
10.1 Australia Silico Manganese Market Revenue Share, By Companies, 2025 |
10.2 Australia Silico Manganese Market Competitive Benchmarking, By Operating and Technical Parameters |
11 Company Profiles |
12 Recommendations |
13 Disclaimer |
Global Go To Market Strategy - 2030
Export potential enables firms to identify high-growth global markets with greater confidence by combining advanced trade intelligence with a structured quantitative methodology. The framework analyzes emerging demand trends and country-level import patterns while integrating macroeconomic and trade datasets such as GDP and population forecasts, bilateral import–export flows, tariff structures, elasticity differentials between developed and developing economies, geographic distance, and import demand projections. Using weighted trade values from 2020–2024 as the base period to project country-to-country export potential for 2030, these inputs are operationalized through calculated drivers such as gravity model parameters, tariff impact factors, and projected GDP per-capita growth. Through an analysis of hidden potentials, demand hotspots, and market conditions that are most favorable to success, this method enables firms to focus on target countries, maximize returns, and global expansion with data, backed by accuracy.
By factoring in the projected importer demand gap that is currently unmet and could be potential opportunity, it identifies the potential for the Exporter (Country) among 190 countries, against the general trade analysis, which identifies the biggest importer or exporter.
To discover high-growth global markets and optimize your business strategy:
Click Here
Pricing
- Single User License$ 1,995
- Department License$ 2,400
- Site License$ 3,120
- Global License$ 3,795

Leadership Perspectives from Industry Events
Search
Thought Leadership and Analyst Meet


Our Clients
6WResearch In News
- India Air Conditioner Market Set for Strong Rebound in 2026 After Weather-Led Correction and GST-Driven Recovery: 6Wresearch
- ADAS in India: How Automatic Emergency Braking, Blind Spot Detection & Driver Monitoring are Transforming Road Safety
- Doha a strategic location for EV manufacturing hub: IPA Qatar
- Demand for luxury TVs surging in the GCC, says Samsung
- Empowering Growth: The Thriving Journey of Bangladesh’s Cable Industry
- Demand for luxury TVs surging in the GCC, says Samsung
Latest Reports
- Nicaragua RPG Gaming Market (2026-2032)
- New Zealand RPG Gaming Market (2026-2032)
- Netherlands RPG Gaming Market (2026-2032)
- Nauru RPG Gaming Market (2026-2032)
- Namibia RPG Gaming Market (2026-2032)
- Mozambique RPG Gaming Market (2026-2032)
- Montenegro RPG Gaming Market (2026-2032)
- Mongolia RPG Gaming Market (2026-2032)
- Monaco RPG Gaming Market (2026-2032)
- Micronesia RPG Gaming Market (2026-2032)
Industry Events and Analyst Meet

HIMTEX 2026

India Refining Summit 2026

India EV Show 2026

EV tech India Expo 2026

Auto Tech Asia 2026
Whitepaper
- Middle East & Africa Commercial Security Market Click here to view more.
- Middle East & Africa Fire Safety Systems & Equipment Market Click here to view more.
- GCC Drone Market Click here to view more.
- Middle East Lighting Fixture Market Click here to view more.
- GCC Physical & Perimeter Security Market Click here to view more.