Brazil Silico Manganese Market Outlook | Revenue, Size, Forecast, Value, Companies, Industry, Trends, Share, Analysis, COVID-19 IMPACT & Growth
Market Forecast By Product (High-Carbon Silico Manganese, Low-Carbon Silico Manganese, Medium-Carbon Silico Manganese), By Application (Automobile Bodies, Road Rails, Dairy Equipment, Hand Railings, Cutlery, Others) And Competitive Landscape
| Product Code: ETC100881 | Publication Date: Jun 2021 | Updated Date: Oct 2025 | Product Type: Report | |
| Publisher: 6Wresearch | Author: Ravi Bhandari | No. of Pages: 70 | No. of Figures: 35 | No. of Tables: 5 |
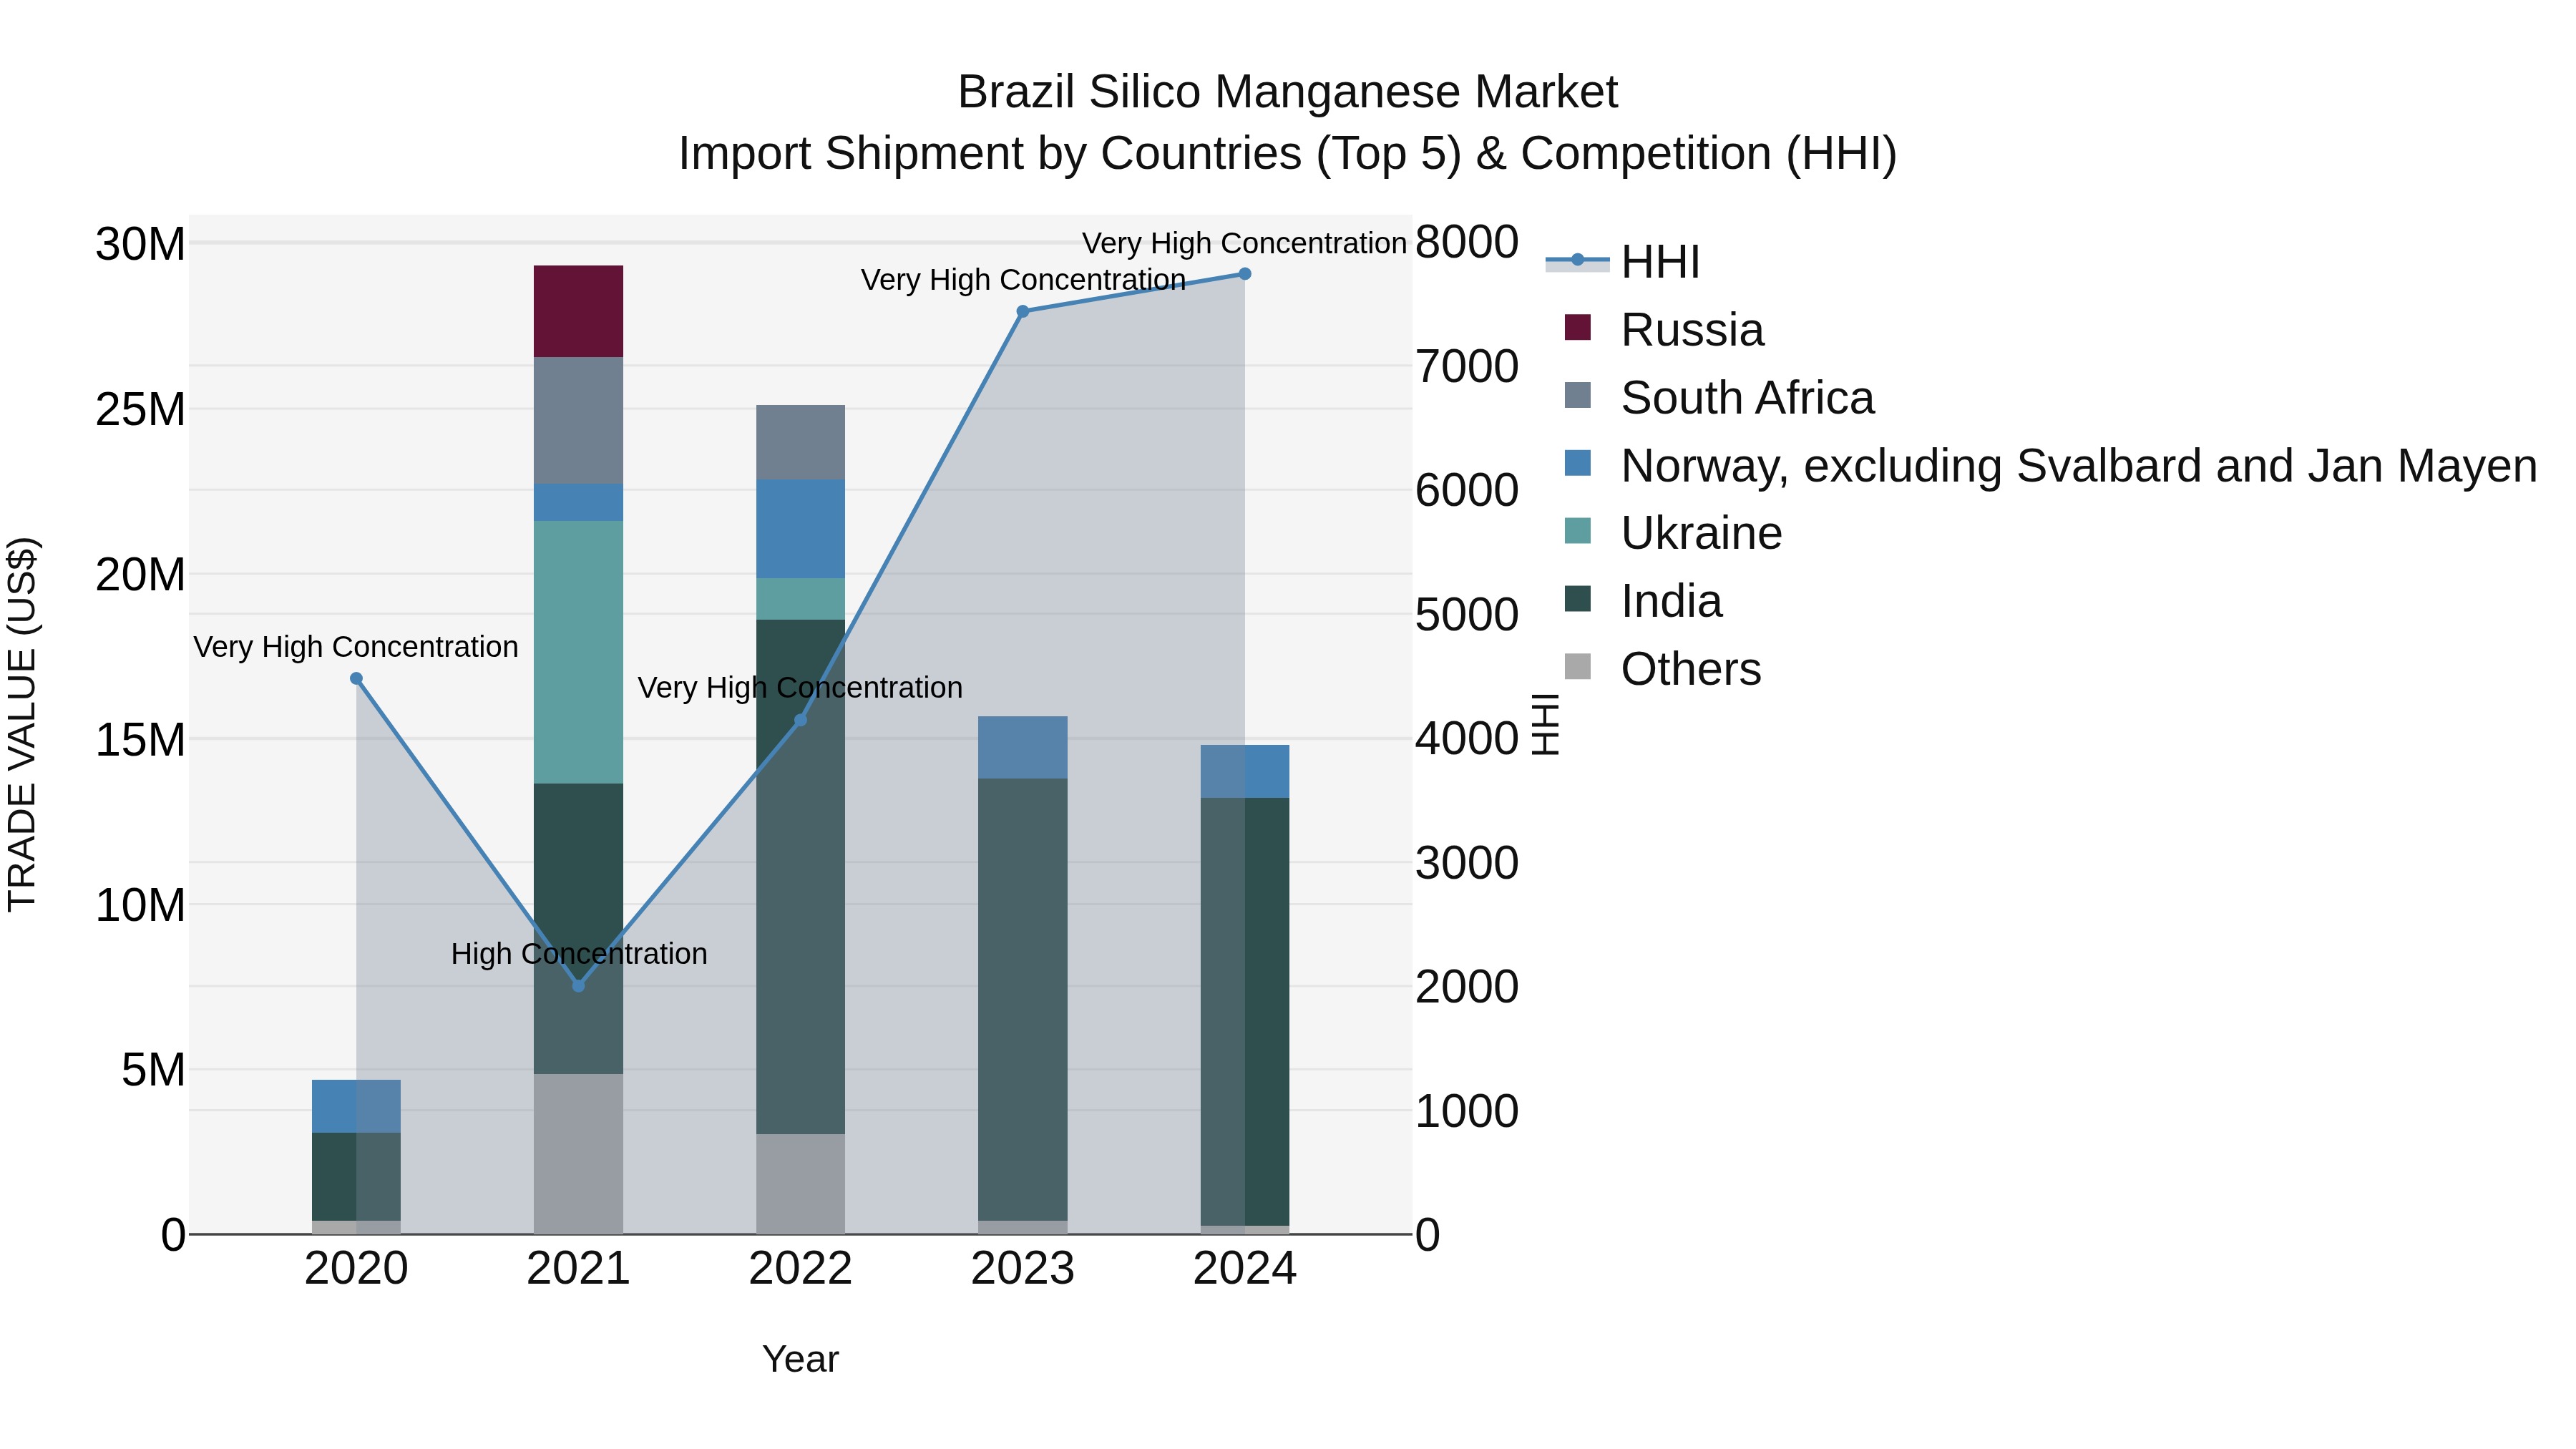
Brazil Silico Manganese Market Top 5 Importing Countries and Market Competition (HHI) Analysis
In 2024, Brazil continued to heavily rely on imports of silico manganese, with top exporting countries including India, Norway, Metropolitan France, Netherlands, and China. Despite a slight decline in growth rate from 2023 to 2024, the compound annual growth rate (CAGR) for the period 2020-2024 remained impressive at 33.44%. The High Herfindahl-Hirschman Index (HHI) indicates a high level of market concentration, highlighting the dominance of key players in the silico manganese import market in Brazil.
Brazil Silico Manganese Market Overview
The Brazil Silico Manganese market is integral to the steelmaking industry, with its alloy used as a deoxidizing agent and alloying element. Market challenges include fluctuations in global steel prices, competition from alternative alloys, and environmental concerns associated with manganese mining and processing. Strategic planning and collaboration with the steel industry are essential for sustained growth in the silico manganese market.
Drivers of the market
The Brazil Silico Manganese market is driven by its use as a deoxidizing agent in the steelmaking process. The growth of the construction and automotive industries fuels the demand for steel, thereby boosting the market for silico manganese. The alloy`s ability to enhance the strength and quality of steel makes it a crucial component in the metallurgical sector, contributing to the market`s positive trajectory.
Challenges of the market
The Brazil Silico Manganese market, driven by its applications in steel production, faces challenges such as raw material availability, energy costs, and global market dynamics. Fluctuations in steel demand and evolving environmental regulations further contribute to market uncertainties. Strategic planning, sustainable sourcing, and adapting to market trends are essential for sustained growth in this sector.
Government Policy of the market
Government policies in the Brazil Silico Manganese market include regulations on mining, environmental impact assessments, and export/import restrictions. Compliance with these policies is crucial for mining companies and manufacturers to operate sustainably. Adapting to changing regulations, implementing responsible mining practices, and contributing to local communities are essential considerations for long-term success.
Key Highlights of the Report:
- Brazil Silico Manganese Market Outlook
- Market Size of Brazil Silico Manganese Market, 2020
- Forecast of Brazil Silico Manganese Market, 2027
- Historical Data and Forecast of Brazil Silico Manganese Revenues & Volume for the Period 2018 - 2027
- Brazil Silico Manganese Market Trend Evolution
- Brazil Silico Manganese Market Drivers and Challenges
- Brazil Silico Manganese Price Trends
- Brazil Silico Manganese Porter's Five Forces
- Brazil Silico Manganese Industry Life Cycle
- Historical Data and Forecast of Brazil Silico Manganese Market Revenues & Volume By Product for the Period 2018 - 2027
- Historical Data and Forecast of Brazil Silico Manganese Market Revenues & Volume By High-Carbon Silico Manganese for the Period 2018 - 2027
- Historical Data and Forecast of Brazil Silico Manganese Market Revenues & Volume By Low-Carbon Silico Manganese for the Period 2018 - 2027
- Historical Data and Forecast of Brazil Silico Manganese Market Revenues & Volume By Medium-Carbon Silico Manganese for the Period 2018 - 2027
- Historical Data and Forecast of Brazil Silico Manganese Market Revenues & Volume By Application for the Period 2018 - 2027
- Historical Data and Forecast of Brazil Silico Manganese Market Revenues & Volume By Automobile Bodies for the Period 2018 - 2027
- Historical Data and Forecast of Brazil Silico Manganese Market Revenues & Volume By Road Rails for the Period 2018 - 2027
- Historical Data and Forecast of Brazil Silico Manganese Market Revenues & Volume By Dairy Equipment for the Period 2018 - 2027
- Historical Data and Forecast of Brazil Silico Manganese Market Revenues & Volume By Hand Railings for the Period 2018 - 2027
- Historical Data and Forecast of Brazil Silico Manganese Market Revenues & Volume By Cutlery for the Period 2018 - 2027
- Historical Data and Forecast of Brazil Silico Manganese Market Revenues & Volume By Others for the Period 2018 - 2027
- Brazil Silico Manganese Import Export Trade Statistics
- Market Opportunity Assessment By Product
- Market Opportunity Assessment By Application
- Brazil Silico Manganese Top Companies Market Share
- Brazil Silico Manganese Competitive Benchmarking By Technical and Operational Parameters
- Brazil Silico Manganese Company Profiles
- Brazil Silico Manganese Key Strategic Recommendations
Frequently Asked Questions About the Market Study (FAQs):
6Wresearch actively monitors the Brazil Silico Manganese Market and publishes its comprehensive annual report, highlighting emerging trends, growth drivers, revenue analysis, and forecast outlook. Our insights help businesses to make data-backed strategic decisions with ongoing market dynamics. Our analysts track relevent industries related to the Brazil Silico Manganese Market, allowing our clients with actionable intelligence and reliable forecasts tailored to emerging regional needs.
Yes, we provide customisation as per your requirements. To learn more, feel free to contact us on sales@6wresearch.com
1 Executive Summary |
2 Introduction |
2.1 Key Highlights of the Report |
2.2 Report Description |
2.3 Market Scope & Segmentation |
2.4 Research Methodology |
2.5 Assumptions |
3 Brazil Silico Manganese Market Overview |
3.1 Brazil Country Macro Economic Indicators |
3.2 Brazil Silico Manganese Market Revenues & Volume, 2020 & 2027F |
3.3 Brazil Silico Manganese Market - Industry Life Cycle |
3.4 Brazil Silico Manganese Market - Porter's Five Forces |
3.5 Brazil Silico Manganese Market Revenues & Volume Share, By Product, 2020 & 2027F |
3.6 Brazil Silico Manganese Market Revenues & Volume Share, By Application, 2020 & 2027F |
4 Brazil Silico Manganese Market Dynamics |
4.1 Impact Analysis |
4.2 Market Drivers |
4.2.1 Growing demand for steel production in Brazil |
4.2.2 Increasing investments in infrastructure projects |
4.2.3 Favorable government policies supporting the mining and metallurgy industry |
4.3 Market Restraints |
4.3.1 Fluctuating prices of raw materials like manganese ore |
4.3.2 Environmental regulations impacting production processes |
4.3.3 Competition from alternative materials in steel manufacturing |
5 Brazil Silico Manganese Market Trends |
6 Brazil Silico Manganese Market, By Types |
6.1 Brazil Silico Manganese Market, By Product |
6.1.1 Overview and Analysis |
6.1.2 Brazil Silico Manganese Market Revenues & Volume, By Product, 2018 - 2027F |
6.1.3 Brazil Silico Manganese Market Revenues & Volume, By High-Carbon Silico Manganese, 2018 - 2027F |
6.1.4 Brazil Silico Manganese Market Revenues & Volume, By Low-Carbon Silico Manganese, 2018 - 2027F |
6.1.5 Brazil Silico Manganese Market Revenues & Volume, By Medium-Carbon Silico Manganese, 2018 - 2027F |
6.2 Brazil Silico Manganese Market, By Application |
6.2.1 Overview and Analysis |
6.2.2 Brazil Silico Manganese Market Revenues & Volume, By Automobile Bodies, 2018 - 2027F |
6.2.3 Brazil Silico Manganese Market Revenues & Volume, By Road Rails, 2018 - 2027F |
6.2.4 Brazil Silico Manganese Market Revenues & Volume, By Dairy Equipment, 2018 - 2027F |
6.2.5 Brazil Silico Manganese Market Revenues & Volume, By Hand Railings, 2018 - 2027F |
6.2.6 Brazil Silico Manganese Market Revenues & Volume, By Cutlery, 2018 - 2027F |
6.2.7 Brazil Silico Manganese Market Revenues & Volume, By Others, 2018 - 2027F |
7 Brazil Silico Manganese Market Import-Export Trade Statistics |
7.1 Brazil Silico Manganese Market Export to Major Countries |
7.2 Brazil Silico Manganese Market Imports from Major Countries |
8 Brazil Silico Manganese Market Key Performance Indicators |
8.1 Average selling price of silico manganese |
8.2 Capacity utilization rate of silico manganese plants |
8.3 Percentage of steel production in Brazil that uses silico manganese |
9 Brazil Silico Manganese Market - Opportunity Assessment |
9.1 Brazil Silico Manganese Market Opportunity Assessment, By Product, 2020 & 2027F |
9.2 Brazil Silico Manganese Market Opportunity Assessment, By Application, 2020 & 2027F |
10 Brazil Silico Manganese Market - Competitive Landscape |
10.1 Brazil Silico Manganese Market Revenue Share, By Companies, 2020 |
10.2 Brazil Silico Manganese Market Competitive Benchmarking, By Operating and Technical Parameters |
11 Company Profiles |
12 Recommendations |
13 Disclaimer |
Global Go To Market Strategy - 2030
Export potential enables firms to identify high-growth global markets with greater confidence by combining advanced trade intelligence with a structured quantitative methodology. The framework analyzes emerging demand trends and country-level import patterns while integrating macroeconomic and trade datasets such as GDP and population forecasts, bilateral import–export flows, tariff structures, elasticity differentials between developed and developing economies, geographic distance, and import demand projections. Using weighted trade values from 2020–2024 as the base period to project country-to-country export potential for 2030, these inputs are operationalized through calculated drivers such as gravity model parameters, tariff impact factors, and projected GDP per-capita growth. Through an analysis of hidden potentials, demand hotspots, and market conditions that are most favorable to success, this method enables firms to focus on target countries, maximize returns, and global expansion with data, backed by accuracy.
By factoring in the projected importer demand gap that is currently unmet and could be potential opportunity, it identifies the potential for the Exporter (Country) among 190 countries, against the general trade analysis, which identifies the biggest importer or exporter.
To discover high-growth global markets and optimize your business strategy:
Click Here
Pricing
- Single User License$ 1,995
- Department License$ 2,400
- Site License$ 3,120
- Global License$ 3,795

Leadership Perspectives from Industry Events
Search
Thought Leadership and Analyst Meet


Our Clients
6WResearch In News
- India Air Conditioner Market Set for Strong Rebound in 2026 After Weather-Led Correction and GST-Driven Recovery: 6Wresearch
- ADAS in India: How Automatic Emergency Braking, Blind Spot Detection & Driver Monitoring are Transforming Road Safety
- Doha a strategic location for EV manufacturing hub: IPA Qatar
- Demand for luxury TVs surging in the GCC, says Samsung
- Empowering Growth: The Thriving Journey of Bangladesh’s Cable Industry
- Demand for luxury TVs surging in the GCC, says Samsung
Latest Reports
- Nicaragua RPG Gaming Market (2026-2032)
- New Zealand RPG Gaming Market (2026-2032)
- Netherlands RPG Gaming Market (2026-2032)
- Nauru RPG Gaming Market (2026-2032)
- Namibia RPG Gaming Market (2026-2032)
- Mozambique RPG Gaming Market (2026-2032)
- Montenegro RPG Gaming Market (2026-2032)
- Mongolia RPG Gaming Market (2026-2032)
- Monaco RPG Gaming Market (2026-2032)
- Micronesia RPG Gaming Market (2026-2032)
Industry Events and Analyst Meet

HIMTEX 2026

India Refining Summit 2026

India EV Show 2026

EV tech India Expo 2026

Auto Tech Asia 2026
Whitepaper
- Middle East & Africa Commercial Security Market Click here to view more.
- Middle East & Africa Fire Safety Systems & Equipment Market Click here to view more.
- GCC Drone Market Click here to view more.
- Middle East Lighting Fixture Market Click here to view more.
- GCC Physical & Perimeter Security Market Click here to view more.