Australia Spunbond Market (2026-2032) | Trends, Companies, Analysis, Outlook, Forecast, Growth, Competitive Landscape, Share, Industry, Segmentation, Value, Size & Revenue
Market Forecast By Type (Fine Denier PET, Nylon, Nylon Raw Material, Adipic Acid, Caprolactam), By Application (Automotive, Filtration, Rubber Belting/Hoses, Rubber Transfer Molding, Embroidery/Apparel), By Composites (Carpet/Rugs, Agriculture, Electrical and Electronics, Textile, Home Furnishing, Tapes/Adhesives) And Competitive Landscape
| Product Code: ETC6191822 | Publication Date: Sep 2024 | Updated Date: Mar 2026 | Product Type: Market Research Report | |
| Publisher: 6Wresearch | Author: Vasudha | No. of Pages: 75 | No. of Figures: 35 | No. of Tables: 20 |
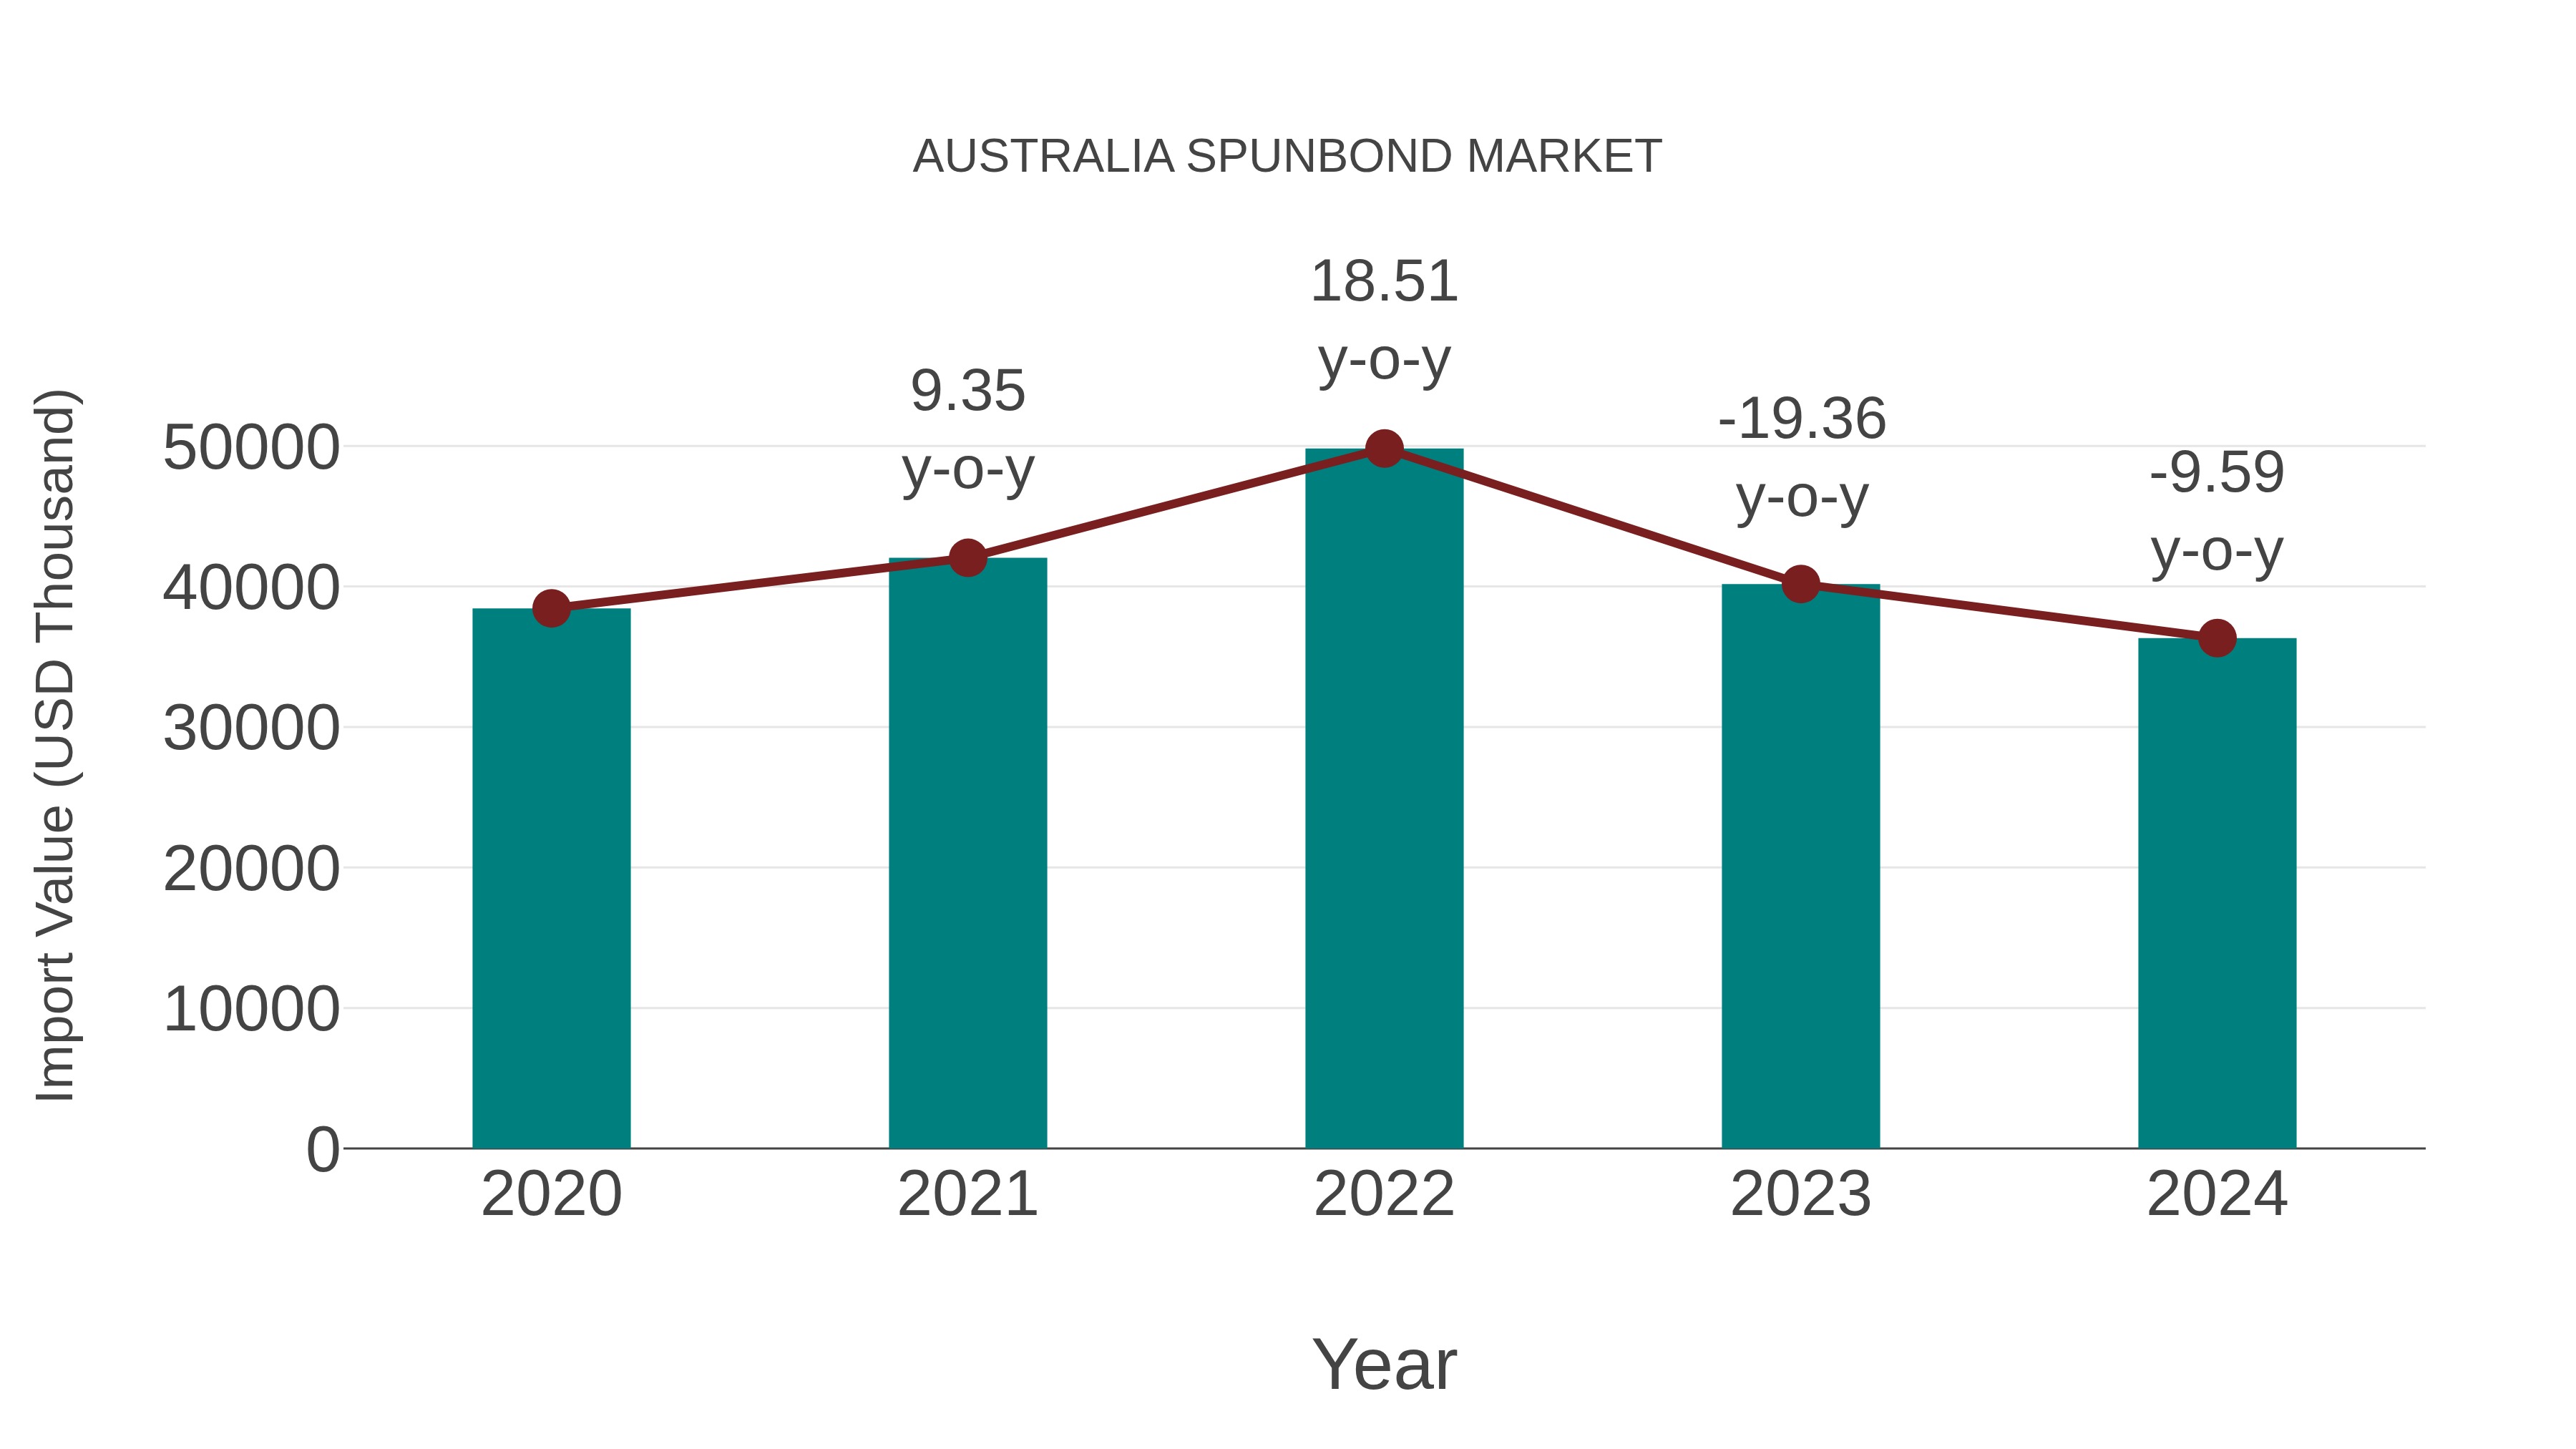
Australia Spunbond Market: Import Trend Analysis
Australia`s import trend for the spunbond market experienced a decline in growth rate from 2023 to 2024, with a decrease of -9.59%. The compound annual growth rate (CAGR) for imports from 2020 to 2024 stood at -1.41%. This negative import momentum may be attributed to shifts in demand dynamics or changes in trade policies impacting market stability.
Australia Spunbond Market Overview
The spunbond market in Australia is growing due to its applications in hygiene products, medical textiles, agriculture, and geotextiles. Local manufacturers and importers supply polypropylene spunbond nonwovens that are used in products ranging from diapers to weed barriers. Sustainability and cost-effectiveness remain central to market evolution.
Drivers of the market
The spunbond market is expanding due to growing applications in hygiene, medical, agricultural, and industrial sectors. Rising demand for disposable products and nonwoven fabrics post-COVID has bolstered the sector. Lightweight, breathable, and eco-friendly materials are at the forefront of product development.
Challenges of the market
The spunbond market is heavily dependent on petroleum-based polypropylene, making it vulnerable to crude oil price volatility. Increasing demand for eco-friendly, biodegradable alternatives also puts pressure on manufacturers to invest in sustainable R&D. Global supply chain disruptions can also affect raw material availability.
Investment opportunities in the Market
The Australian spunbond market is gaining traction due to applications in hygiene, agriculture, and industrial sectors. Investments in high-speed production lines, recyclable and bio-based spunbond fabrics, and R&D for advanced functionalities (such as anti-bacterial and UV-resistant properties) could yield strong returns. Export potential to Southeast Asia further boosts its attractiveness.
Government Policy of the market
Australias textile and manufacturing strategies, particularly those promoting local production and sustainability, influence the spunbond market. Government support through the Manufacturing Modernisation Fund and Clean Energy initiatives encourages companies to invest in nonwoven production using recycled and eco-friendly polymers. Import tariffs and trade agreements also affect raw material pricing and availability.
Key Highlights of the Report:
- Australia Spunbond Market Outlook
- Market Size of Australia Spunbond Market, 2025
- Forecast of Australia Spunbond Market, 2032
- Historical Data and Forecast of Australia Spunbond Revenues & Volume for the Period 2022 - 2032F
- Australia Spunbond Market Trend Evolution
- Australia Spunbond Market Drivers and Challenges
- Australia Spunbond Price Trends
- Australia Spunbond Porter's Five Forces
- Australia Spunbond Industry Life Cycle
- Historical Data and Forecast of Australia Spunbond Market Revenues & Volume By Type for the Period 2022 - 2032F
- Historical Data and Forecast of Australia Spunbond Market Revenues & Volume By Fine Denier PET for the Period 2022 - 2032F
- Historical Data and Forecast of Australia Spunbond Market Revenues & Volume By Nylon for the Period 2022 - 2032F
- Historical Data and Forecast of Australia Spunbond Market Revenues & Volume By Nylon Raw Material for the Period 2022 - 2032F
- Historical Data and Forecast of Australia Spunbond Market Revenues & Volume By Adipic Acid for the Period 2022 - 2032F
- Historical Data and Forecast of Australia Spunbond Market Revenues & Volume By Caprolactam for the Period 2022 - 2032F
- Historical Data and Forecast of Australia Spunbond Market Revenues & Volume By Application for the Period 2022 - 2032F
- Historical Data and Forecast of Australia Spunbond Market Revenues & Volume By Automotive for the Period 2022 - 2032F
- Historical Data and Forecast of Australia Spunbond Market Revenues & Volume By Filtration for the Period 2022 - 2032F
- Historical Data and Forecast of Australia Spunbond Market Revenues & Volume By Rubber Belting/Hoses for the Period 2022 - 2032F
- Historical Data and Forecast of Australia Spunbond Market Revenues & Volume By Rubber Transfer Molding for the Period 2022 - 2032F
- Historical Data and Forecast of Australia Spunbond Market Revenues & Volume By Embroidery/Apparel for the Period 2022 - 2032F
- Historical Data and Forecast of Australia Spunbond Market Revenues & Volume By Composites for the Period 2022 - 2032F
- Historical Data and Forecast of Australia Spunbond Market Revenues & Volume By Carpet/Rugs for the Period 2022 - 2032F
- Historical Data and Forecast of Australia Spunbond Market Revenues & Volume By Agriculture for the Period 2022 - 2032F
- Historical Data and Forecast of Australia Spunbond Market Revenues & Volume By Electrical and Electronics for the Period 2022 - 2032F
- Historical Data and Forecast of Australia Spunbond Market Revenues & Volume By Textile for the Period 2022 - 2032F
- Historical Data and Forecast of Australia Spunbond Market Revenues & Volume By Home Furnishing for the Period 2022 - 2032F
- Historical Data and Forecast of Australia Spunbond Market Revenues & Volume By Tapes/Adhesives for the Period 2022 - 2032F
- Australia Spunbond Import Export Trade Statistics
- Market Opportunity Assessment By Type
- Market Opportunity Assessment By Application
- Market Opportunity Assessment By Composites
- Australia Spunbond Top Companies Market Share
- Australia Spunbond Competitive Benchmarking By Technical and Operational Parameters
- Australia Spunbond Company Profiles
- Australia Spunbond Key Strategic Recommendations
Australia Spunbond Market (2026-2032): FAQs
6Wresearch actively monitors the Australia Spunbond Market and publishes its comprehensive annual report, highlighting emerging trends, growth drivers, revenue analysis, and forecast outlook. Our insights help businesses to make data-backed strategic decisions with ongoing market dynamics. Our analysts track relevent industries related to the Australia Spunbond Market, allowing our clients with actionable intelligence and reliable forecasts tailored to emerging regional needs.
Yes, we provide customisation as per your requirements. To learn more, feel free to contact us on sales@6wresearch.com
1 Executive Summary |
2 Introduction |
2.1 Key Highlights of the Report |
2.2 Report Description |
2.3 Market Scope & Segmentation |
2.4 Research Methodology |
2.5 Assumptions |
3 Australia Spunbond Market Overview |
3.1 Australia Country Macro Economic Indicators |
3.2 Australia Spunbond Market Revenues & Volume, 2022 & 2032F |
3.3 Australia Spunbond Market - Industry Life Cycle |
3.4 Australia Spunbond Market - Porter's Five Forces |
3.5 Australia Spunbond Market Revenues & Volume Share, By Type, 2022 & 2032F |
3.6 Australia Spunbond Market Revenues & Volume Share, By Application, 2022 & 2032F |
3.7 Australia Spunbond Market Revenues & Volume Share, By Composites, 2022 & 2032F |
4 Australia Spunbond Market Dynamics |
4.1 Impact Analysis |
4.2 Market Drivers |
4.2.1 Increasing demand for non-woven fabrics in various end-use industries such as healthcare, automotive, and agriculture. |
4.2.2 Growing awareness and preference for sustainable and eco-friendly materials. |
4.2.3 Technological advancements leading to improved quality and performance of spunbond materials. |
4.3 Market Restraints |
4.3.1 Volatility in raw material prices, such as polypropylene, impacting production costs. |
4.3.2 Intense competition from substitute materials like woven fabrics or other non-woven technologies. |
4.3.3 Regulatory challenges related to environmental concerns and waste management. |
5 Australia Spunbond Market Trends |
6 Australia Spunbond Market, By Types |
6.1 Australia Spunbond Market, By Type |
6.1.1 Overview and Analysis |
6.1.2 Australia Spunbond Market Revenues & Volume, By Type, 2022 - 2032F |
6.1.3 Australia Spunbond Market Revenues & Volume, By Fine Denier PET, 2022 - 2032F |
6.1.4 Australia Spunbond Market Revenues & Volume, By Nylon, 2022 - 2032F |
6.1.5 Australia Spunbond Market Revenues & Volume, By Nylon Raw Material, 2022 - 2032F |
6.1.6 Australia Spunbond Market Revenues & Volume, By Adipic Acid, 2022 - 2032F |
6.1.7 Australia Spunbond Market Revenues & Volume, By Caprolactam, 2022 - 2032F |
6.2 Australia Spunbond Market, By Application |
6.2.1 Overview and Analysis |
6.2.2 Australia Spunbond Market Revenues & Volume, By Automotive, 2022 - 2032F |
6.2.3 Australia Spunbond Market Revenues & Volume, By Filtration, 2022 - 2032F |
6.2.4 Australia Spunbond Market Revenues & Volume, By Rubber Belting/Hoses, 2022 - 2032F |
6.2.5 Australia Spunbond Market Revenues & Volume, By Rubber Transfer Molding, 2022 - 2032F |
6.2.6 Australia Spunbond Market Revenues & Volume, By Embroidery/Apparel, 2022 - 2032F |
6.3 Australia Spunbond Market, By Composites |
6.3.1 Overview and Analysis |
6.3.2 Australia Spunbond Market Revenues & Volume, By Carpet/Rugs, 2022 - 2032F |
6.3.3 Australia Spunbond Market Revenues & Volume, By Agriculture, 2022 - 2032F |
6.3.4 Australia Spunbond Market Revenues & Volume, By Electrical and Electronics, 2022 - 2032F |
6.3.5 Australia Spunbond Market Revenues & Volume, By Textile, 2022 - 2032F |
6.3.6 Australia Spunbond Market Revenues & Volume, By Home Furnishing, 2022 - 2032F |
6.3.7 Australia Spunbond Market Revenues & Volume, By Tapes/Adhesives, 2022 - 2032F |
7 Australia Spunbond Market Import-Export Trade Statistics |
7.1 Australia Spunbond Market Export to Major Countries |
7.2 Australia Spunbond Market Imports from Major Countries |
8 Australia Spunbond Market Key Performance Indicators |
8.1 Percentage increase in the adoption of spunbond materials in key industries. |
8.2 Research and development investment in new applications and product innovations. |
8.3 Environmental sustainability metrics such as recycling rates and carbon footprint reduction initiatives. |
8.4 Supplier performance metrics related to quality control and on-time delivery. |
8.5 Customer satisfaction scores and feedback on product performance and reliability. |
9 Australia Spunbond Market - Opportunity Assessment |
9.1 Australia Spunbond Market Opportunity Assessment, By Type, 2022 & 2032F |
9.2 Australia Spunbond Market Opportunity Assessment, By Application, 2022 & 2032F |
9.3 Australia Spunbond Market Opportunity Assessment, By Composites, 2022 & 2032F |
10 Australia Spunbond Market - Competitive Landscape |
10.1 Australia Spunbond Market Revenue Share, By Companies, 2025 |
10.2 Australia Spunbond Market Competitive Benchmarking, By Operating and Technical Parameters |
11 Company Profiles |
12 Recommendations |
13 Disclaimer |
Global Go To Market Strategy - 2030
Export potential enables firms to identify high-growth global markets with greater confidence by combining advanced trade intelligence with a structured quantitative methodology. The framework analyzes emerging demand trends and country-level import patterns while integrating macroeconomic and trade datasets such as GDP and population forecasts, bilateral import–export flows, tariff structures, elasticity differentials between developed and developing economies, geographic distance, and import demand projections. Using weighted trade values from 2020–2024 as the base period to project country-to-country export potential for 2030, these inputs are operationalized through calculated drivers such as gravity model parameters, tariff impact factors, and projected GDP per-capita growth. Through an analysis of hidden potentials, demand hotspots, and market conditions that are most favorable to success, this method enables firms to focus on target countries, maximize returns, and global expansion with data, backed by accuracy.
By factoring in the projected importer demand gap that is currently unmet and could be potential opportunity, it identifies the potential for the Exporter (Country) among 190 countries, against the general trade analysis, which identifies the biggest importer or exporter.
To discover high-growth global markets and optimize your business strategy:
Click Here
Pricing
- Single User License$ 1,995
- Department License$ 2,400
- Site License$ 3,120
- Global License$ 3,795

Leadership Perspectives from Industry Events
Search
Thought Leadership and Analyst Meet


Our Clients
6WResearch In News
- India Air Conditioner Market Set for Strong Rebound in 2026 After Weather-Led Correction and GST-Driven Recovery: 6Wresearch
- ADAS in India: How Automatic Emergency Braking, Blind Spot Detection & Driver Monitoring are Transforming Road Safety
- Doha a strategic location for EV manufacturing hub: IPA Qatar
- Demand for luxury TVs surging in the GCC, says Samsung
- Empowering Growth: The Thriving Journey of Bangladesh’s Cable Industry
- Demand for luxury TVs surging in the GCC, says Samsung
Latest Reports
- Poland Fire Protection Systems Market (2026-2032)
- Cape Verde Portable Hand-Thrown Extinguisher Market (2026-2032)
- Canada Portable Hand-Thrown Extinguisher Market (2026-2032)
- Cameroon Portable Hand-Thrown Extinguisher Market (2026-2032)
- Burundi Portable Hand-Thrown Extinguisher Market (2026-2032)
- Burkina Faso Portable Hand-Thrown Extinguisher Market (2026-2032)
- Bulgaria Portable Hand-Thrown Extinguisher Market (2026-2032)
- Brunei Portable Hand-Thrown Extinguisher Market (2026-2032)
- Botswana Portable Hand-Thrown Extinguisher Market (2026-2032)
- Bosnia and Herzegovina Portable Hand-Thrown Extinguisher Market (2026-2032)
Industry Events and Analyst Meet

HIMTEX 2026

India Refining Summit 2026

India EV Show 2026

EV tech India Expo 2026

Auto Tech Asia 2026
Whitepaper
- Middle East & Africa Commercial Security Market Click here to view more.
- Middle East & Africa Fire Safety Systems & Equipment Market Click here to view more.
- GCC Drone Market Click here to view more.
- Middle East Lighting Fixture Market Click here to view more.
- GCC Physical & Perimeter Security Market Click here to view more.