Australia Stannic Chloride Market (2026-2032) | Forecast, Competitive Landscape, Analysis, Share, Size & Revenue, Companies, Growth, Trends, Segmentation, Outlook, Value, Industry
Market Forecast By Product Form (Liquid, Solid), By Purity of Product (0.99, Others), By Applications (Electronics, Tinplate, Float Glass, Brass & Bronze), By End-User Industry (Polymers, Agriculture, Pharmaceuticals, Electrical & Electronics, Chemical, Other Industrial), By Product (Stannic Chloride Anhydrate, Stannic Chloride Pentahydrate) And Competitive Landscape
| Product Code: ETC6191872 | Publication Date: Sep 2024 | Updated Date: Mar 2026 | Product Type: Market Research Report | |
| Publisher: 6Wresearch | Author: Shubham Padhi | No. of Pages: 75 | No. of Figures: 35 | No. of Tables: 20 |
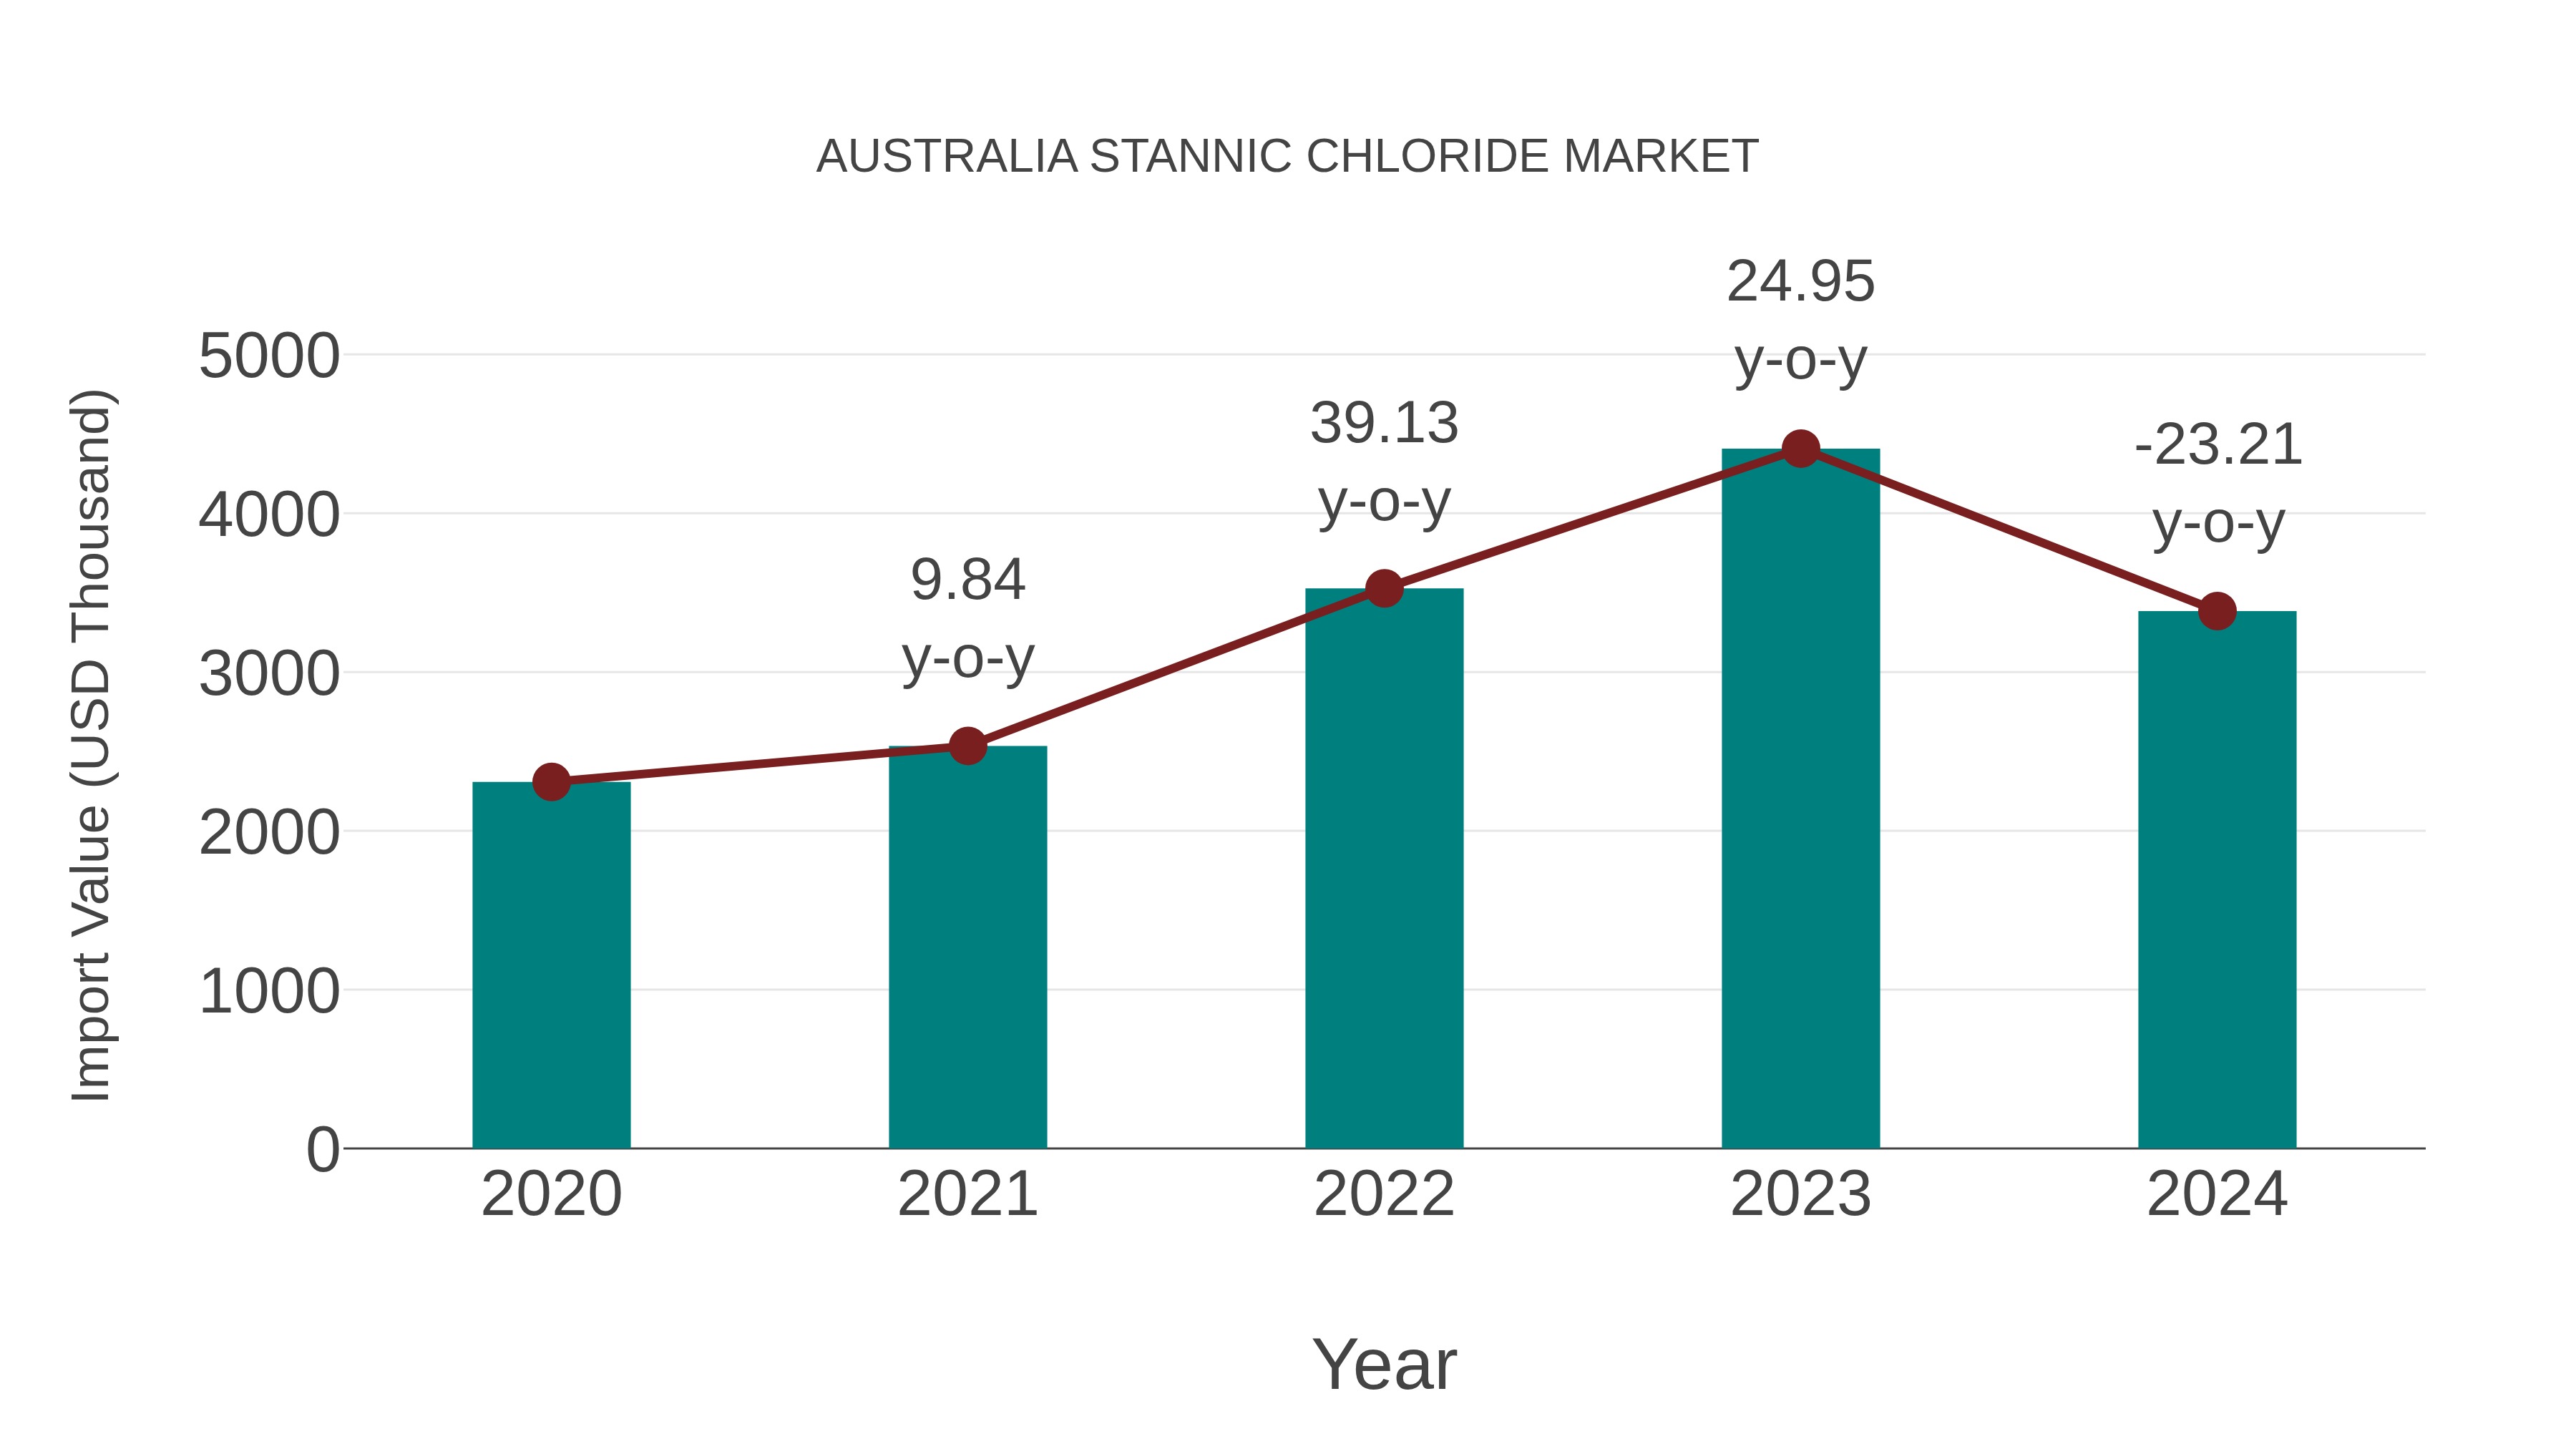
Australia Stannic Chloride Market: Import Trend Analysis
Australia`s import trend for stannic chloride in 2024 experienced a decline of -23.21% compared to 2023, with a compound annual growth rate (CAGR) of 10.04% for the period 2020-2024. This decline in import momentum could be attributed to shifting market demands or changes in trade policies impacting the stannic chloride market.
Australia Stannic Chloride Market Overview
The stannic chloride market in Australia is driven by its applications as a catalyst, mordant, and intermediate in organic synthesis. It is used in pharmaceuticals, dyes, and polymers. Industrial demand, especially in research and chemical manufacturing, is supporting market activity. However, regulatory scrutiny on chemical handling and imports plays a role in market performance.
Drivers of the market
Australias stannic chloride market is impacted by its role as a precursor in manufacturing catalysts, glass coatings, and tin plating. The market is stable with moderate growth as industrial demand persists, particularly in the chemical and electronics sectors. Research into more sustainable production processes and recycling methods for tin compounds is influencing market dynamics.
Challenges of the market
The Australian Stannic Chloride Market faces regulatory challenges due to the chemicals hazardous nature and the need for careful handling and storage. Environmental and safety compliance increases operational costs. The market is also impacted by fluctuating demand in sectors such as catalysts and electronics, creating uncertainty in production planning. Import reliance and price volatility in tin derivatives pose additional challenges.
Investment opportunities in the Market
Stannic chloride`s use in glass coating, dyeing, and pharmaceutical manufacturing positions it as a valuable specialty chemical. Investment opportunities include developing high-purity variants and integrating waste reduction technologies in production. Theres also potential in partnering with research institutions for expanding applications in nanotechnology.
Government Policy of the market
Stannic chloride is regulated as a hazardous chemical under Australian workplace safety laws. The government requires strict adherence to storage, transport, and handling guidelines under the Globally Harmonized System (GHS). AICIS oversees its industrial application registration, and environmental agencies enforce policies concerning emissions and waste disposal related to its use.
Key Highlights of the Report:
- Australia Stannic Chloride Market Outlook
- Market Size of Australia Stannic Chloride Market, 2025
- Forecast of Australia Stannic Chloride Market, 2032
- Historical Data and Forecast of Australia Stannic Chloride Revenues & Volume for the Period 2022 - 2032F
- Australia Stannic Chloride Market Trend Evolution
- Australia Stannic Chloride Market Drivers and Challenges
- Australia Stannic Chloride Price Trends
- Australia Stannic Chloride Porter's Five Forces
- Australia Stannic Chloride Industry Life Cycle
- Historical Data and Forecast of Australia Stannic Chloride Market Revenues & Volume By Product Form for the Period 2022 - 2032F
- Historical Data and Forecast of Australia Stannic Chloride Market Revenues & Volume By Liquid for the Period 2022 - 2032F
- Historical Data and Forecast of Australia Stannic Chloride Market Revenues & Volume By Solid for the Period 2022 - 2032F
- Historical Data and Forecast of Australia Stannic Chloride Market Revenues & Volume By Purity of Product for the Period 2022 - 2032F
- Historical Data and Forecast of Australia Stannic Chloride Market Revenues & Volume By 0.99 for the Period 2022 - 2032F
- Historical Data and Forecast of Australia Stannic Chloride Market Revenues & Volume By Others for the Period 2022 - 2032F
- Historical Data and Forecast of Australia Stannic Chloride Market Revenues & Volume By Applications for the Period 2022 - 2032F
- Historical Data and Forecast of Australia Stannic Chloride Market Revenues & Volume By Electronics for the Period 2022 - 2032F
- Historical Data and Forecast of Australia Stannic Chloride Market Revenues & Volume By Tinplate for the Period 2022 - 2032F
- Historical Data and Forecast of Australia Stannic Chloride Market Revenues & Volume By Float Glass for the Period 2022 - 2032F
- Historical Data and Forecast of Australia Stannic Chloride Market Revenues & Volume By Brass & Bronze for the Period 2022 - 2032F
- Historical Data and Forecast of Australia Stannic Chloride Market Revenues & Volume By End-User Industry for the Period 2022 - 2032F
- Historical Data and Forecast of Australia Stannic Chloride Market Revenues & Volume By Polymers for the Period 2022 - 2032F
- Historical Data and Forecast of Australia Stannic Chloride Market Revenues & Volume By Agriculture for the Period 2022 - 2032F
- Historical Data and Forecast of Australia Stannic Chloride Market Revenues & Volume By Pharmaceuticals for the Period 2022 - 2032F
- Historical Data and Forecast of Australia Stannic Chloride Market Revenues & Volume By Electrical & Electronics for the Period 2022 - 2032F
- Historical Data and Forecast of Australia Stannic Chloride Market Revenues & Volume By Chemical for the Period 2022 - 2032F
- Historical Data and Forecast of Australia Stannic Chloride Market Revenues & Volume By Other Industrial for the Period 2022 - 2032F
- Historical Data and Forecast of Australia Stannic Chloride Market Revenues & Volume By Product for the Period 2022 - 2032F
- Historical Data and Forecast of Australia Stannic Chloride Market Revenues & Volume By Stannic Chloride Anhydrate for the Period 2022 - 2032F
- Historical Data and Forecast of Australia Stannic Chloride Market Revenues & Volume By Stannic Chloride Pentahydrate for the Period 2022 - 2032F
- Australia Stannic Chloride Import Export Trade Statistics
- Market Opportunity Assessment By Product Form
- Market Opportunity Assessment By Purity of Product
- Market Opportunity Assessment By Applications
- Market Opportunity Assessment By End-User Industry
- Market Opportunity Assessment By Product
- Australia Stannic Chloride Top Companies Market Share
- Australia Stannic Chloride Competitive Benchmarking By Technical and Operational Parameters
- Australia Stannic Chloride Company Profiles
- Australia Stannic Chloride Key Strategic Recommendations
Australia Stannic Chloride Market (2026-2032): FAQs
6Wresearch actively monitors the Australia Stannic Chloride Market and publishes its comprehensive annual report, highlighting emerging trends, growth drivers, revenue analysis, and forecast outlook. Our insights help businesses to make data-backed strategic decisions with ongoing market dynamics. Our analysts track relevent industries related to the Australia Stannic Chloride Market, allowing our clients with actionable intelligence and reliable forecasts tailored to emerging regional needs.
Yes, we provide customisation as per your requirements. To learn more, feel free to contact us on sales@6wresearch.com
1 Executive Summary |
2 Introduction |
2.1 Key Highlights of the Report |
2.2 Report Description |
2.3 Market Scope & Segmentation |
2.4 Research Methodology |
2.5 Assumptions |
3 Australia Stannic Chloride Market Overview |
3.1 Australia Country Macro Economic Indicators |
3.2 Australia Stannic Chloride Market Revenues & Volume, 2022 & 2032F |
3.3 Australia Stannic Chloride Market - Industry Life Cycle |
3.4 Australia Stannic Chloride Market - Porter's Five Forces |
3.5 Australia Stannic Chloride Market Revenues & Volume Share, By Product Form, 2022 & 2032F |
3.6 Australia Stannic Chloride Market Revenues & Volume Share, By Purity of Product, 2022 & 2032F |
3.7 Australia Stannic Chloride Market Revenues & Volume Share, By Applications, 2022 & 2032F |
3.8 Australia Stannic Chloride Market Revenues & Volume Share, By End-User Industry, 2022 & 2032F |
3.9 Australia Stannic Chloride Market Revenues & Volume Share, By Product, 2022 & 2032F |
4 Australia Stannic Chloride Market Dynamics |
4.1 Impact Analysis |
4.2 Market Drivers |
4.2.1 Increasing demand for stannic chloride in chemical manufacturing industries |
4.2.2 Growth in the electronics sector, leading to higher consumption of stannic chloride for soldering applications |
4.2.3 Rising awareness about the benefits of stannic chloride in water treatment processes |
4.3 Market Restraints |
4.3.1 Fluctuating prices of raw materials used in stannic chloride production |
4.3.2 Environmental regulations impacting the production and usage of stannic chloride |
4.3.3 Competition from alternative chemicals in various industrial applications |
5 Australia Stannic Chloride Market Trends |
6 Australia Stannic Chloride Market, By Types |
6.1 Australia Stannic Chloride Market, By Product Form |
6.1.1 Overview and Analysis |
6.1.2 Australia Stannic Chloride Market Revenues & Volume, By Product Form, 2022 - 2032F |
6.1.3 Australia Stannic Chloride Market Revenues & Volume, By Liquid, 2022 - 2032F |
6.1.4 Australia Stannic Chloride Market Revenues & Volume, By Solid, 2022 - 2032F |
6.2 Australia Stannic Chloride Market, By Purity of Product |
6.2.1 Overview and Analysis |
6.2.2 Australia Stannic Chloride Market Revenues & Volume, By 0.99, 2022 - 2032F |
6.2.3 Australia Stannic Chloride Market Revenues & Volume, By Others, 2022 - 2032F |
6.3 Australia Stannic Chloride Market, By Applications |
6.3.1 Overview and Analysis |
6.3.2 Australia Stannic Chloride Market Revenues & Volume, By Electronics, 2022 - 2032F |
6.3.3 Australia Stannic Chloride Market Revenues & Volume, By Tinplate, 2022 - 2032F |
6.3.4 Australia Stannic Chloride Market Revenues & Volume, By Float Glass, 2022 - 2032F |
6.3.5 Australia Stannic Chloride Market Revenues & Volume, By Brass & Bronze, 2022 - 2032F |
6.4 Australia Stannic Chloride Market, By End-User Industry |
6.4.1 Overview and Analysis |
6.4.2 Australia Stannic Chloride Market Revenues & Volume, By Polymers, 2022 - 2032F |
6.4.3 Australia Stannic Chloride Market Revenues & Volume, By Agriculture, 2022 - 2032F |
6.4.4 Australia Stannic Chloride Market Revenues & Volume, By Pharmaceuticals, 2022 - 2032F |
6.4.5 Australia Stannic Chloride Market Revenues & Volume, By Electrical & Electronics, 2022 - 2032F |
6.4.6 Australia Stannic Chloride Market Revenues & Volume, By Chemical, 2022 - 2032F |
6.4.7 Australia Stannic Chloride Market Revenues & Volume, By Other Industrial, 2022 - 2032F |
6.5 Australia Stannic Chloride Market, By Product |
6.5.1 Overview and Analysis |
6.5.2 Australia Stannic Chloride Market Revenues & Volume, By Stannic Chloride Anhydrate, 2022 - 2032F |
6.5.3 Australia Stannic Chloride Market Revenues & Volume, By Stannic Chloride Pentahydrate, 2022 - 2032F |
7 Australia Stannic Chloride Market Import-Export Trade Statistics |
7.1 Australia Stannic Chloride Market Export to Major Countries |
7.2 Australia Stannic Chloride Market Imports from Major Countries |
8 Australia Stannic Chloride Market Key Performance Indicators |
8.1 Percentage increase in the number of patents related to stannic chloride applications |
8.2 Adoption rate of stannic chloride in emerging industries such as renewable energy |
8.3 Investment in research and development activities for stannic chloride substitutes |
9 Australia Stannic Chloride Market - Opportunity Assessment |
9.1 Australia Stannic Chloride Market Opportunity Assessment, By Product Form, 2022 & 2032F |
9.2 Australia Stannic Chloride Market Opportunity Assessment, By Purity of Product, 2022 & 2032F |
9.3 Australia Stannic Chloride Market Opportunity Assessment, By Applications, 2022 & 2032F |
9.4 Australia Stannic Chloride Market Opportunity Assessment, By End-User Industry, 2022 & 2032F |
9.5 Australia Stannic Chloride Market Opportunity Assessment, By Product, 2022 & 2032F |
10 Australia Stannic Chloride Market - Competitive Landscape |
10.1 Australia Stannic Chloride Market Revenue Share, By Companies, 2025 |
10.2 Australia Stannic Chloride Market Competitive Benchmarking, By Operating and Technical Parameters |
11 Company Profiles |
12 Recommendations |
13 Disclaimer |
Export potential assessment - trade Analytics for 2030
Export potential enables firms to identify high-growth global markets with greater confidence by combining advanced trade intelligence with a structured quantitative methodology. The framework analyzes emerging demand trends and country-level import patterns while integrating macroeconomic and trade datasets such as GDP and population forecasts, bilateral import–export flows, tariff structures, elasticity differentials between developed and developing economies, geographic distance, and import demand projections. Using weighted trade values from 2020–2024 as the base period to project country-to-country export potential for 2030, these inputs are operationalized through calculated drivers such as gravity model parameters, tariff impact factors, and projected GDP per-capita growth. Through an analysis of hidden potentials, demand hotspots, and market conditions that are most favorable to success, this method enables firms to focus on target countries, maximize returns, and global expansion with data, backed by accuracy.
By factoring in the projected importer demand gap that is currently unmet and could be potential opportunity, it identifies the potential for the Exporter (Country) among 190 countries, against the general trade analysis, which identifies the biggest importer or exporter.
To discover high-growth global markets and optimize your business strategy:
Click Here
Pricing
- Single User License$ 1,995
- Department License$ 2,400
- Site License$ 3,120
- Global License$ 3,795

Search
Thought Leadership and Analyst Meet


Our Clients
Latest Reports
- Canada Cloud CFD Market (2026-2032) | Size & Revenue, Industry, Growth, Competitive Landscape, Forecast, Segmentation, Value, Outlook, Trends, Share, Analysis, Companies
- Taiwan Food Delivery Platform Market (2026-2032) | Companies, Outlook, Analysis, Trends, Value, Revenue, Segmentation, Share, Forecast, Competitive Landscape, Growth, Size & Forecast
- United Kingdom (UK) Long-term Care Insurance Market (2026-2032) | Growth, Share, Consumer Insights, Drivers, Opportunities, Competition, Pricing Analysis, Segments, Restraints, Companies, Competitive, Value, Outlook, Size, Demand, Analysis, Challenges, Strategic Insights, Investment Trends, Revenue, Trends, Supply, Forecast
- United Kingdom (UK) Long Term Care Market (2026-2032) | Companies, Outlook, Analysis, Trends, Value, Revenue, Segmentation, Share, Forecast, Competitive Landscape, Growth, Size & Forecast
- Iraq Insulation and Waterproofing Market (2026-2032) | Outlook, Drivers, Growth, Size, Share, Industry, Revenue, Trends, Demand, Competitive, Strategic Insights, Opportunities, Segments, Companies, Challenges, Strategy, Consumer Insights, Analysis, Investment Trends, Value, Segmentation, Forecast, Restraints
- India Switchgear Market Outlook (2026-2032) | Size, Share, Trends, Growth, Revenue, Forecast, Analysis, Value, Outlook
- Pakistan Contraceptive Implants Market (2025-2031) | Demand, Growth, Size, Share, Industry, Pricing Analysis, Competitive, Strategic Insights, Strategy, Consumer Insights, Analysis, Investment Trends, Opportunities, Revenue, Segments, Value, Segmentation, Supply, Forecast, Restraints, Outlook, Competition, Drivers, Trends, Companies, Challenges
- Sri Lanka Packaging Market (2026-2032) | Outlook, Competition, Drivers, Trends, Demand, Pricing Analysis, Competitive, Strategic Insights, Companies, Challenges, Strategy, Consumer Insights, Analysis, Investment Trends, Opportunities, Growth, Size, Share, Industry, Revenue, Segments, Value, Segmentation, Supply, Forecast, Restraints
- India Kids Watches Market (2026-2032) | Strategy, Consumer Insights, Analysis, Investment Trends, Opportunities, Growth, Size, Share, Industry, Revenue, Segments, Value, Segmentation, Supply, Forecast, Restraints, Outlook, Competition, Drivers, Trends, Demand, Pricing Analysis, Competitive, Strategic Insights, Companies, Challenges
- Saudi Arabia Core Assurance Service Market (2025-2031) | Strategy, Consumer Insights, Analysis, Investment Trends, Opportunities, Growth, Size, Share, Industry, Revenue, Segments, Value, Segmentation, Supply, Forecast, Restraints, Outlook, Competition, Drivers, Trends, Demand, Pricing Analysis, Competitive, Strategic Insights, Companies, Challenges
Industry Events and Analyst Meet

India EV Show 2026

EV tech India Expo 2026

Auto Tech Asia 2026

Battery Tech India 2026

Smart Production Solutions Guangzhou 2026
Whitepaper
- Middle East & Africa Commercial Security Market Click here to view more.
- Middle East & Africa Fire Safety Systems & Equipment Market Click here to view more.
- GCC Drone Market Click here to view more.
- Middle East Lighting Fixture Market Click here to view more.
- GCC Physical & Perimeter Security Market Click here to view more.
6WResearch In News
- Doha a strategic location for EV manufacturing hub: IPA Qatar
- Demand for luxury TVs surging in the GCC, says Samsung
- Empowering Growth: The Thriving Journey of Bangladesh’s Cable Industry
- Demand for luxury TVs surging in the GCC, says Samsung
- Video call with a traditional healer? Once unthinkable, it’s now common in South Africa
- Intelligent Buildings To Smooth GCC’s Path To Net Zero