Australia Starch Sweetener Market (2026-2032) | Share, Size & Revenue, Companies, Segmentation, Forecast, Analysis, Outlook, Value, Competitive Landscape, Growth, Trends, Industry
Market Forecast By Application (Bakery, Dairy and Desserts, Beverages, Meat and Meat Products, Soups, Sauces, Dressings) And Competitive Landscape
| Product Code: ETC6191884 | Publication Date: Sep 2024 | Updated Date: Mar 2026 | Product Type: Market Research Report | |
| Publisher: 6Wresearch | Author: Shubham Deep | No. of Pages: 75 | No. of Figures: 35 | No. of Tables: 20 |
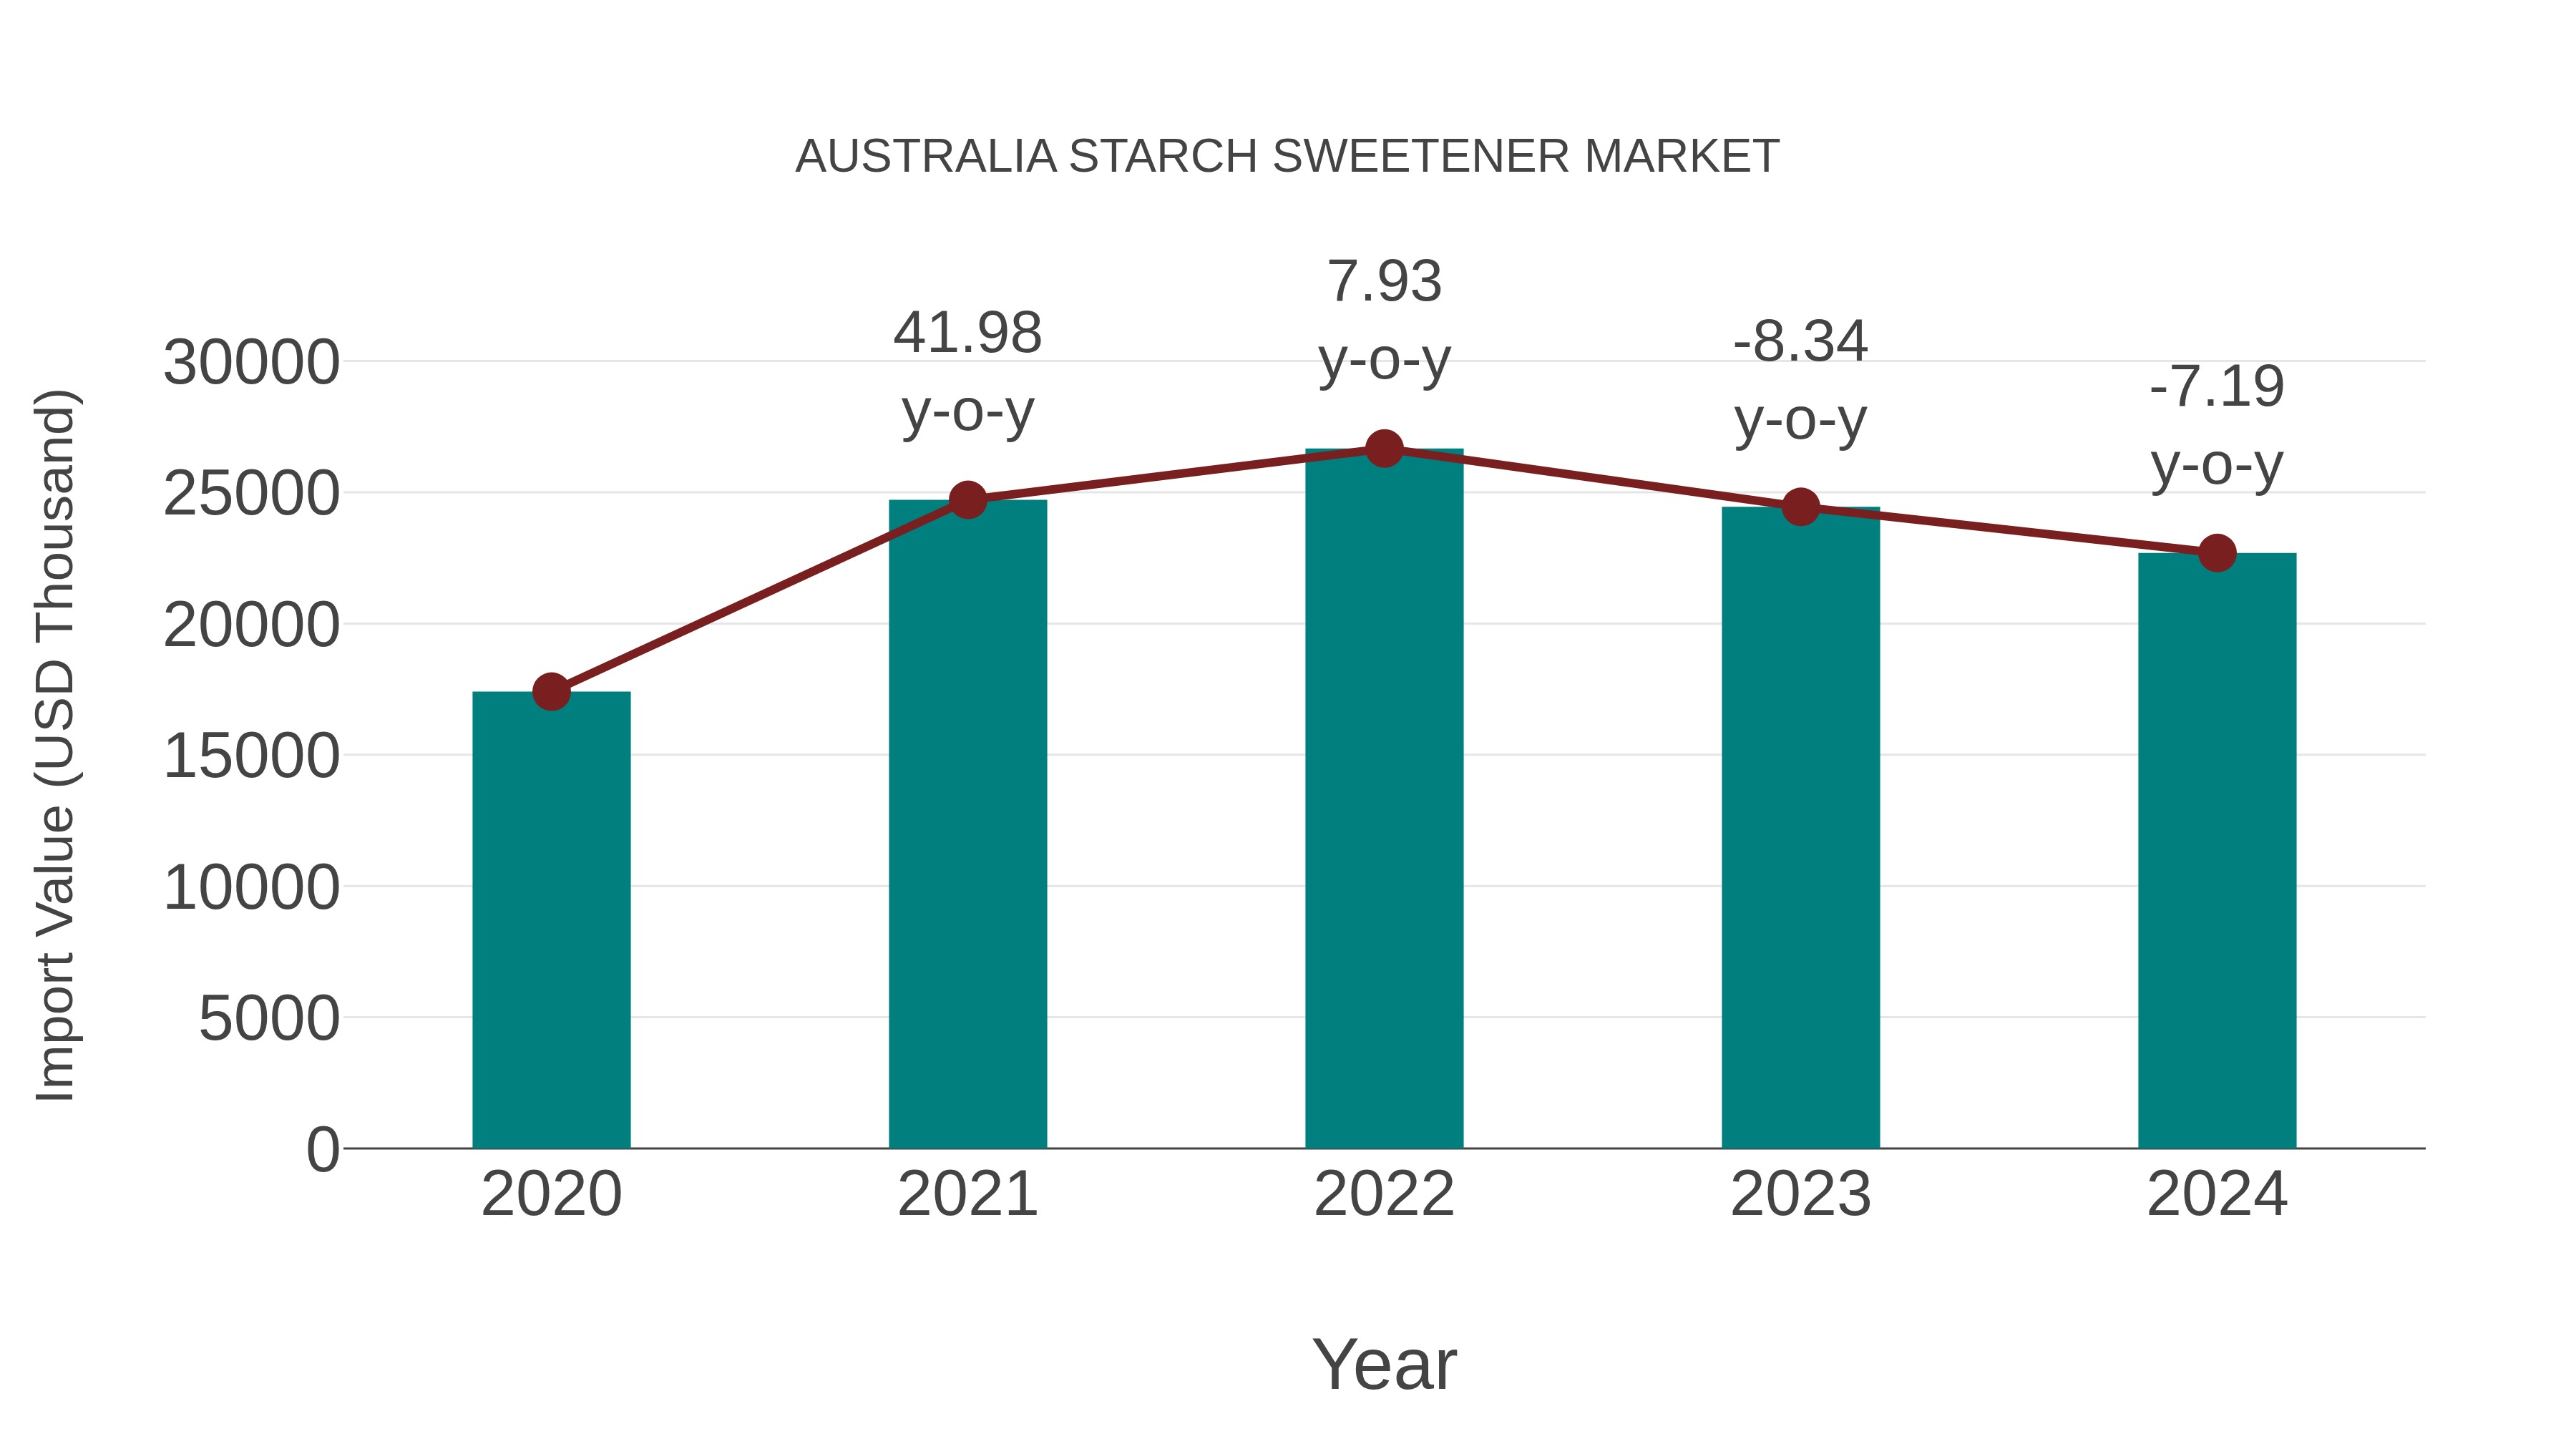
Australia Starch Sweetener Market: Import Trend Analysis
In the Australia starch sweetener market, the import trend experienced a decline with a growth rate of -7.19% from 2023 to 2024, while the compound annual growth rate (CAGR) for the period 2020-2024 stood at 6.85%. This decline in import momentum in 2024 may be attributed to shifting demand patterns or evolving trade policies impacting market stability.
Australia Starch Sweetener Market Overview
The starch sweetener market in Australia is dominated by glucose syrups, maltodextrins, and high-fructose corn syrup used extensively in beverages, bakery, confectionery, and dairy products. Growing consumer preference for natural sweeteners and innovations in enzymatic conversion processes to produce clean-label sweeteners positively influence this market. However, concerns over health impacts of sweeteners also drive demand for alternatives.
Drivers of the market
The starch sweetener market in Australia is marked by strong growth driven by rising consumer preference for natural sweeteners and functional food ingredients. Corn-derived sweeteners like glucose syrup and maltodextrin dominate the market, with expanding applications in confectionery, bakery, and beverages. Health concerns related to sugar consumption stimulate demand for alternative sweeteners derived from starch hydrolysis. Ongoing innovations in enzymatic processes enhance product diversity and nutritional profiles.
Challenges of the market
The starch sweetener market faces intense competition from alternative sweeteners such as cane sugar, high-fructose corn syrup, and emerging natural sweeteners. Health concerns and regulatory scrutiny around the use of certain starch-derived sweeteners restrict market growth. Volatility in raw starch prices and supply chain disruptions also affect pricing and availability.
Investment opportunities in the Market
The starch sweetener market is growing, driven by the food and beverage industry`s shift toward natural and alternative sweeteners. Investors can explore production of specialized syrups (e.g., high-fructose, maltose) or low-calorie sweeteners for health-conscious consumers. Investment in R&D and quality assurance processes is key to tapping into this segment.
Government Policy of the market
Policies related to public health and sugar consumption have impacted the starch sweetener market. FSANZ regulations on sugar labeling and the governments support for healthier sugar alternatives have created a shift toward starch-derived sweeteners like glucose and maltose. Additionally, subsidies on local maize and wheat help maintain a stable supply for sweetener production.
Key Highlights of the Report:
- Australia Starch Sweetener Market Outlook
- Market Size of Australia Starch Sweetener Market, 2025
- Forecast of Australia Starch Sweetener Market, 2032
- Historical Data and Forecast of Australia Starch Sweetener Revenues & Volume for the Period 2022 - 2032F
- Australia Starch Sweetener Market Trend Evolution
- Australia Starch Sweetener Market Drivers and Challenges
- Australia Starch Sweetener Price Trends
- Australia Starch Sweetener Porter's Five Forces
- Australia Starch Sweetener Industry Life Cycle
- Historical Data and Forecast of Australia Starch Sweetener Market Revenues & Volume By Application for the Period 2022 - 2032F
- Historical Data and Forecast of Australia Starch Sweetener Market Revenues & Volume By Bakery for the Period 2022 - 2032F
- Historical Data and Forecast of Australia Starch Sweetener Market Revenues & Volume By Dairy and Desserts for the Period 2022 - 2032F
- Historical Data and Forecast of Australia Starch Sweetener Market Revenues & Volume By Beverages for the Period 2022 - 2032F
- Historical Data and Forecast of Australia Starch Sweetener Market Revenues & Volume By Meat and Meat Products for the Period 2022 - 2032F
- Historical Data and Forecast of Australia Starch Sweetener Market Revenues & Volume By Soups for the Period 2022 - 2032F
- Historical Data and Forecast of Australia Starch Sweetener Market Revenues & Volume By Sauces for the Period 2022 - 2032F
- Historical Data and Forecast of Australia Starch Sweetener Market Revenues & Volume By Dressings for the Period 2022 - 2032F
- Australia Starch Sweetener Import Export Trade Statistics
- Market Opportunity Assessment By Application
- Australia Starch Sweetener Top Companies Market Share
- Australia Starch Sweetener Competitive Benchmarking By Technical and Operational Parameters
- Australia Starch Sweetener Company Profiles
- Australia Starch Sweetener Key Strategic Recommendations
Australia Starch Sweetener Market (2026-2032): FAQs
6Wresearch actively monitors the Australia Starch Sweetener Market and publishes its comprehensive annual report, highlighting emerging trends, growth drivers, revenue analysis, and forecast outlook. Our insights help businesses to make data-backed strategic decisions with ongoing market dynamics. Our analysts track relevent industries related to the Australia Starch Sweetener Market, allowing our clients with actionable intelligence and reliable forecasts tailored to emerging regional needs.
Yes, we provide customisation as per your requirements. To learn more, feel free to contact us on sales@6wresearch.com
1 Executive Summary |
2 Introduction |
2.1 Key Highlights of the Report |
2.2 Report Description |
2.3 Market Scope & Segmentation |
2.4 Research Methodology |
2.5 Assumptions |
3 Australia Starch Sweetener Market Overview |
3.1 Australia Country Macro Economic Indicators |
3.2 Australia Starch Sweetener Market Revenues & Volume, 2022 & 2032F |
3.3 Australia Starch Sweetener Market - Industry Life Cycle |
3.4 Australia Starch Sweetener Market - Porter's Five Forces |
3.5 Australia Starch Sweetener Market Revenues & Volume Share, By Application, 2022 & 2032F |
4 Australia Starch Sweetener Market Dynamics |
4.1 Impact Analysis |
4.2 Market Drivers |
4.2.1 Increasing consumer demand for natural sweeteners and clean label products |
4.2.2 Growing application of starch sweeteners in food and beverage industries |
4.2.3 Rising awareness about health benefits of consuming starch sweeteners |
4.3 Market Restraints |
4.3.1 Fluctuating prices of raw materials such as corn and wheat |
4.3.2 Stringent regulations related to sugar content and labeling in food products |
4.3.3 Competition from alternative sweeteners like stevia and artificial sweeteners |
5 Australia Starch Sweetener Market Trends |
6 Australia Starch Sweetener Market, By Types |
6.1 Australia Starch Sweetener Market, By Application |
6.1.1 Overview and Analysis |
6.1.2 Australia Starch Sweetener Market Revenues & Volume, By Application, 2022 - 2032F |
6.1.3 Australia Starch Sweetener Market Revenues & Volume, By Bakery, 2022 - 2032F |
6.1.4 Australia Starch Sweetener Market Revenues & Volume, By Dairy and Desserts, 2022 - 2032F |
6.1.5 Australia Starch Sweetener Market Revenues & Volume, By Beverages, 2022 - 2032F |
6.1.6 Australia Starch Sweetener Market Revenues & Volume, By Meat and Meat Products, 2022 - 2032F |
6.1.7 Australia Starch Sweetener Market Revenues & Volume, By Soups, 2022 - 2032F |
6.1.8 Australia Starch Sweetener Market Revenues & Volume, By Sauces, 2022 - 2032F |
7 Australia Starch Sweetener Market Import-Export Trade Statistics |
7.1 Australia Starch Sweetener Market Export to Major Countries |
7.2 Australia Starch Sweetener Market Imports from Major Countries |
8 Australia Starch Sweetener Market Key Performance Indicators |
8.1 Research and development investment in innovative starch sweetener products |
8.2 Number of product launches incorporating starch sweeteners |
8.3 Adoption rate of starch sweeteners in new food and beverage products |
8.4 Consumer awareness and perception of starch sweeteners |
8.5 Sustainability initiatives in the starch sweetener production process |
9 Australia Starch Sweetener Market - Opportunity Assessment |
9.1 Australia Starch Sweetener Market Opportunity Assessment, By Application, 2022 & 2032F |
10 Australia Starch Sweetener Market - Competitive Landscape |
10.1 Australia Starch Sweetener Market Revenue Share, By Companies, 2025 |
10.2 Australia Starch Sweetener Market Competitive Benchmarking, By Operating and Technical Parameters |
11 Company Profiles |
12 Recommendations |
13 Disclaimer |
Global Go To Market Strategy - 2030
Export potential enables firms to identify high-growth global markets with greater confidence by combining advanced trade intelligence with a structured quantitative methodology. The framework analyzes emerging demand trends and country-level import patterns while integrating macroeconomic and trade datasets such as GDP and population forecasts, bilateral import–export flows, tariff structures, elasticity differentials between developed and developing economies, geographic distance, and import demand projections. Using weighted trade values from 2020–2024 as the base period to project country-to-country export potential for 2030, these inputs are operationalized through calculated drivers such as gravity model parameters, tariff impact factors, and projected GDP per-capita growth. Through an analysis of hidden potentials, demand hotspots, and market conditions that are most favorable to success, this method enables firms to focus on target countries, maximize returns, and global expansion with data, backed by accuracy.
By factoring in the projected importer demand gap that is currently unmet and could be potential opportunity, it identifies the potential for the Exporter (Country) among 190 countries, against the general trade analysis, which identifies the biggest importer or exporter.
To discover high-growth global markets and optimize your business strategy:
Click Here
Pricing
- Single User License$ 1,995
- Department License$ 2,400
- Site License$ 3,120
- Global License$ 3,795

Leadership Perspectives from Industry Events
Search
Thought Leadership and Analyst Meet


Our Clients
6WResearch In News
- India Export Attractiveness Tracker 2026
- India Air Conditioner Market Set for Strong Rebound in 2026 After Weather-Led Correction and GST-Driven Recovery: 6Wresearch
- ADAS in India: How Automatic Emergency Braking, Blind Spot Detection & Driver Monitoring are Transforming Road Safety
- Doha a strategic location for EV manufacturing hub: IPA Qatar
- Demand for luxury TVs surging in the GCC, says Samsung
- Empowering Growth: The Thriving Journey of Bangladesh’s Cable Industry
Latest Reports
- Nicaragua RPG Gaming Market (2026-2032)
- New Zealand RPG Gaming Market (2026-2032)
- Netherlands RPG Gaming Market (2026-2032)
- Nauru RPG Gaming Market (2026-2032)
- Namibia RPG Gaming Market (2026-2032)
- Mozambique RPG Gaming Market (2026-2032)
- Montenegro RPG Gaming Market (2026-2032)
- Mongolia RPG Gaming Market (2026-2032)
- Monaco RPG Gaming Market (2026-2032)
- Micronesia RPG Gaming Market (2026-2032)
Industry Events and Analyst Meet

EV India Expo 2026

HIMTEX 2026

India Refining Summit 2026

India EV Show 2026

EV tech India Expo 2026
Whitepaper
- Middle East & Africa Commercial Security Market Click here to view more.
- Middle East & Africa Fire Safety Systems & Equipment Market Click here to view more.
- GCC Drone Market Click here to view more.
- Middle East Lighting Fixture Market Click here to view more.
- GCC Physical & Perimeter Security Market Click here to view more.