Australia Substitute Natural Gas Market (2026-2032) | Size & Revenue, Analysis, Share, Industry, Growth, Trends, Competitive Landscape, Segmentation, Outlook, Value, Companies, Forecast
Market Forecast By Source (Coal, Oil, Biomass, Solid Waste, Others), By Application (Transportation, Energy, Residential Heating, Industrial, Others) And Competitive Landscape
| Product Code: ETC6192112 | Publication Date: Sep 2024 | Updated Date: Mar 2026 | Product Type: Market Research Report | |
| Publisher: 6Wresearch | Author: Shubham Padhi | No. of Pages: 75 | No. of Figures: 35 | No. of Tables: 20 |
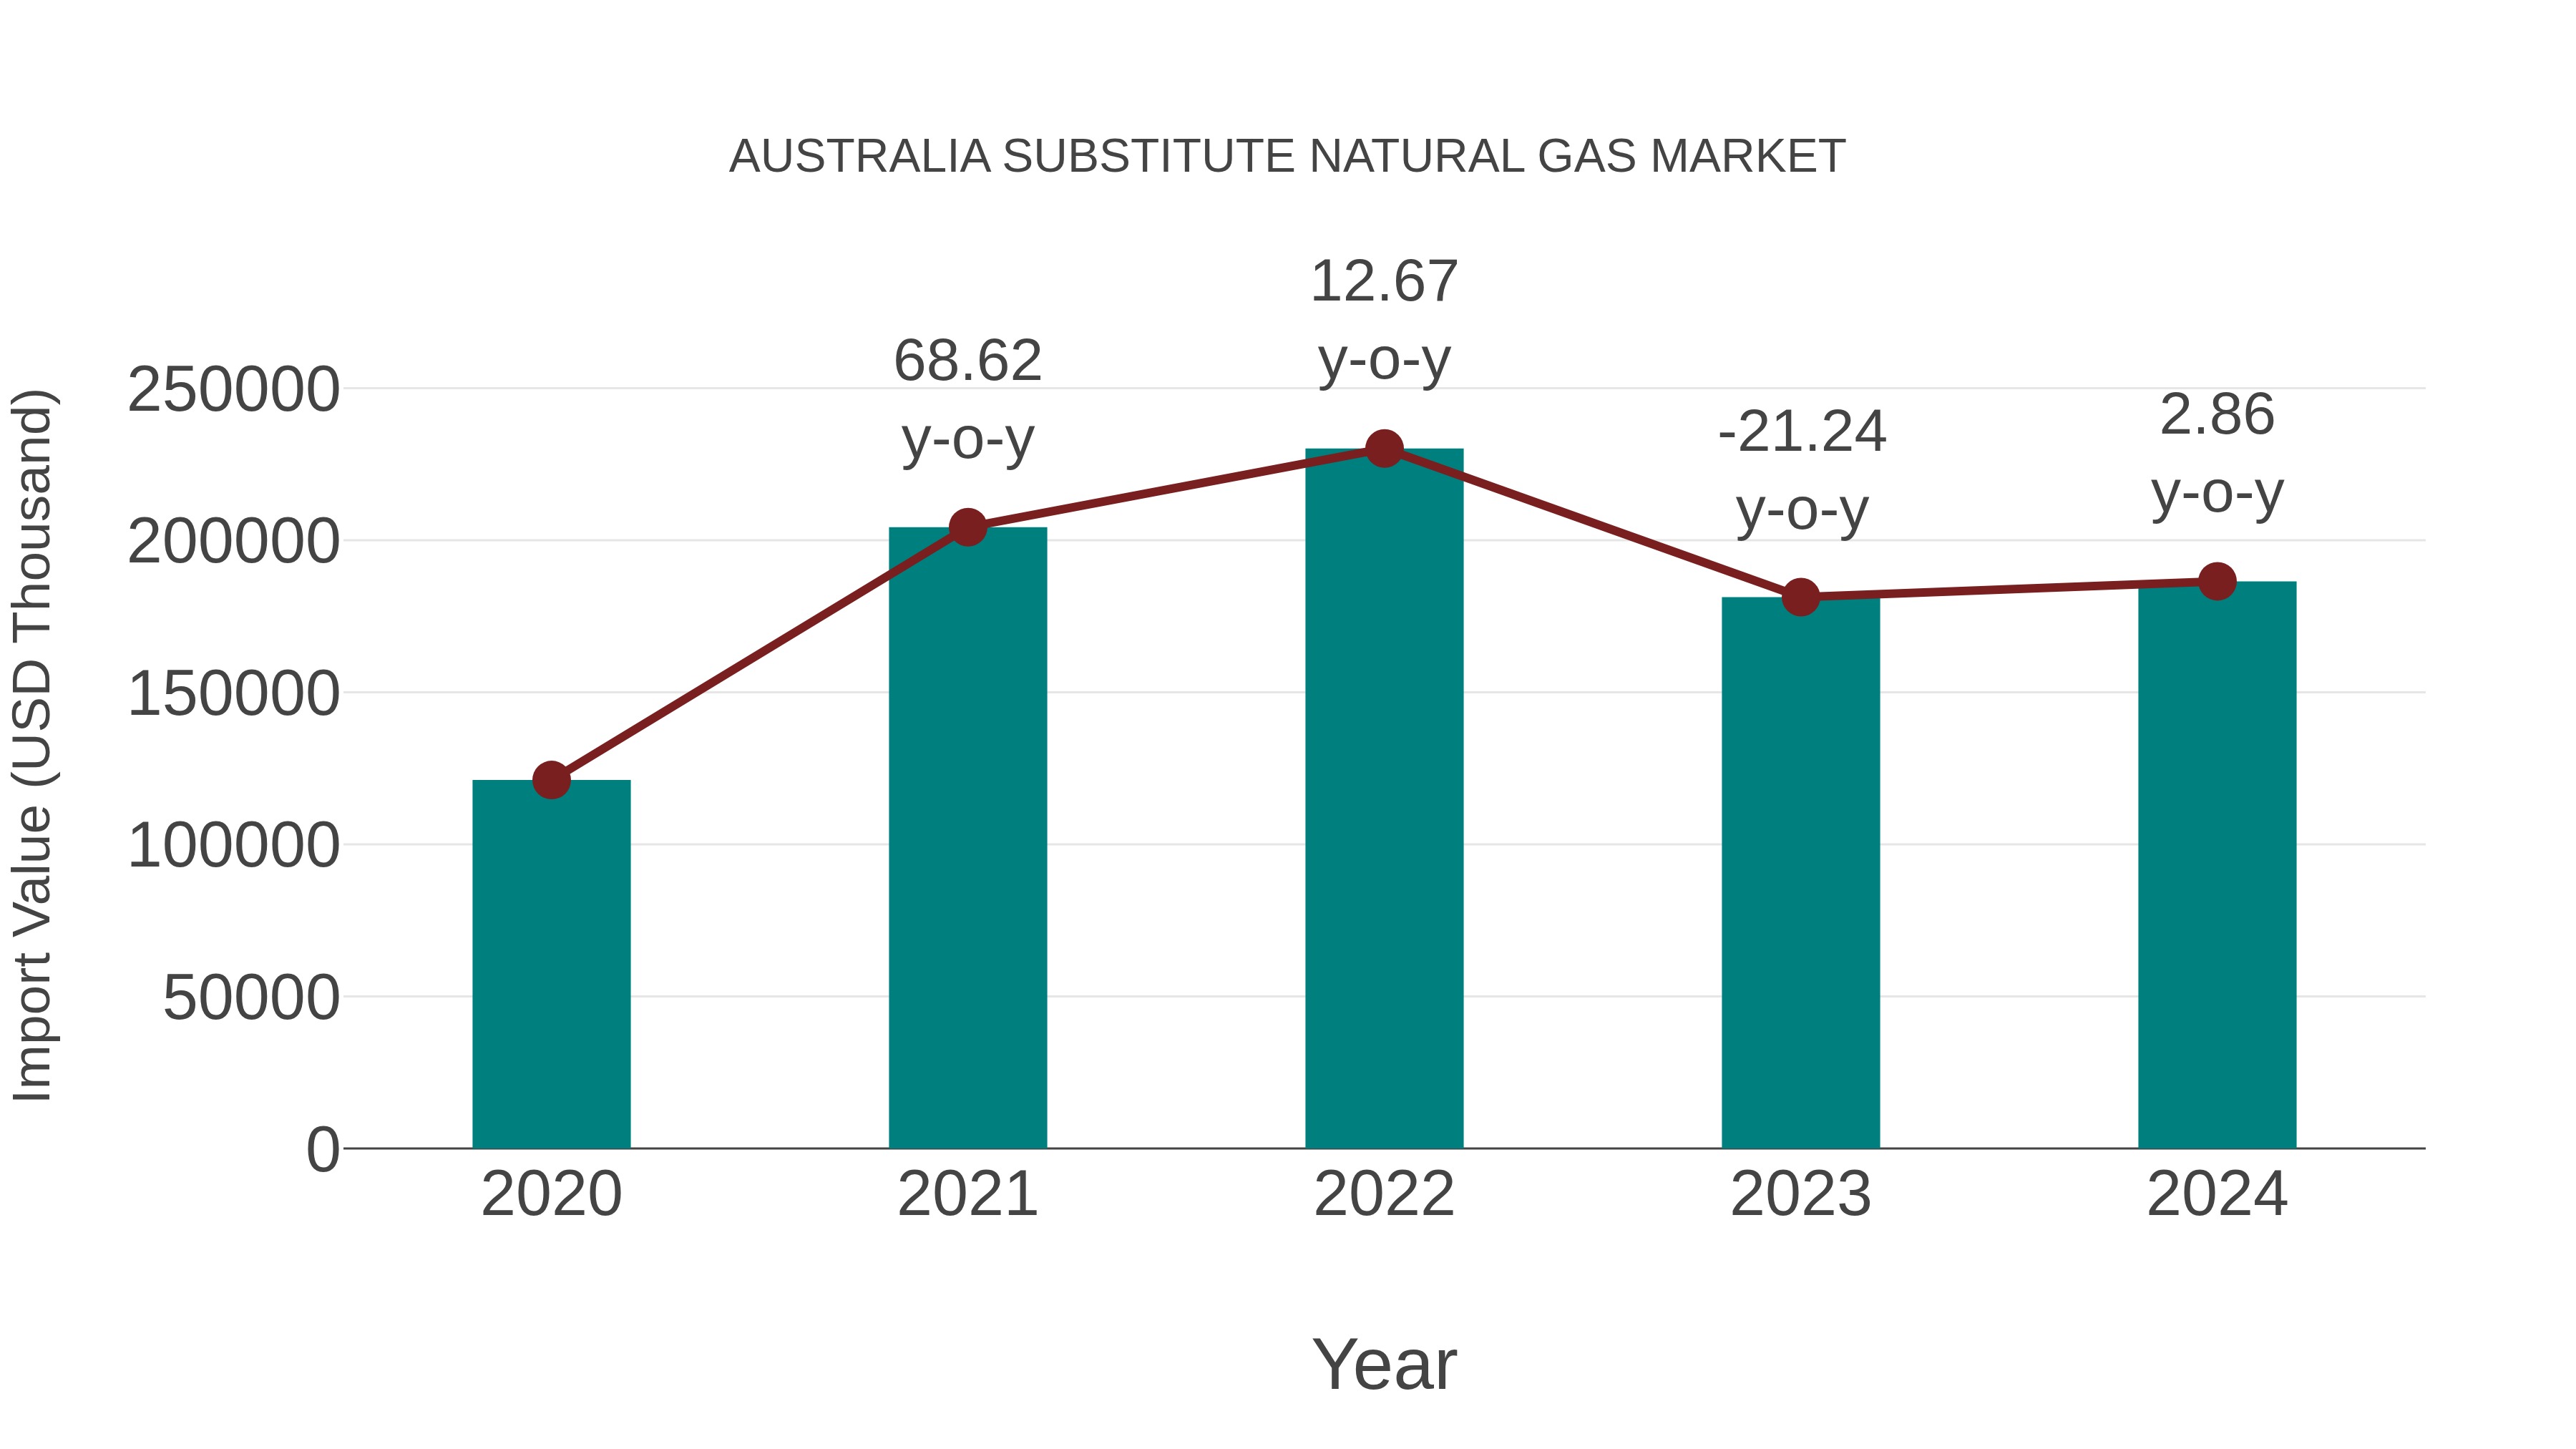
Australia Substitute Natural Gas Market: Import Trend Analysis
In the Australia substitute natural gas market, the import trend showed a growth rate of 2.86% from 2023 to 2024, with a compound annual growth rate (CAGR) of 11.38% from 2020 to 2024. This upward import momentum may have been influenced by increasing demand for natural gas substitutes due to environmental regulations or shifts in global energy markets.
Australia Substitute Natural Gas Market Overview
The substitute natural gas (SNG) market in Australia includes synthetic gases produced from coal, biomass, or other sources as alternatives to conventional natural gas. Driven by the countrys abundant coal and biomass resources, SNG offers a potential route to diversify energy supplies and reduce dependency on imported natural gas. Environmental concerns and efforts to lower carbon emissions support interest in cleaner SNG production technologies. However, economic viability and infrastructure integration remain key challenges for market growth.
Drivers of the market
The substitute natural gas (SNG) market in Australia is developing as a complementary energy source to natural gas, particularly with growing emphasis on renewable energy and decarbonization. The production of SNG from biomass and coal gasification is gaining traction, supported by government policies encouraging cleaner fuel alternatives. Increased investment in infrastructure for storage and distribution of SNG is expected to boost market growth.
Challenges of the market
The Substitute Natural Gas (SNG) Market in Australia struggles with high production costs compared to conventional natural gas, limiting its competitiveness. The infrastructure for distribution and storage of SNG is underdeveloped, posing logistical challenges. Regulatory frameworks for alternative fuels are still evolving, creating uncertainty for investors. Environmental concerns around feedstock sourcing and lifecycle emissions of SNG also impact market acceptance. Additionally, fluctuating fossil fuel prices influence demand for substitute gases.
Investment opportunities in the Market
The move towards cleaner fuels and decarbonization opens investment pathways in substitute natural gas (SNG) technologies in Australia. Opportunities include funding gasification projects utilizing biomass or coal, and investing in small-scale SNG plants to support off-grid energy demand in industrial sectors. The integration of carbon capture with SNG production also presents a niche yet impactful investment angle.
Government Policy of the market
Australias energy policy supports exploration into alternative and sustainable fuels, including Substitute Natural Gas (SNG). Government frameworks like the Low Emissions Technology Statement and Hydrogen Strategy create indirect support for synthetic gas development. However, policies also demand strict emissions control and environmental impact assessments, which developers of SNG technologies must navigate before scaling production.
Key Highlights of the Report:
- Australia Substitute Natural Gas Market Outlook
- Market Size of Australia Substitute Natural Gas Market, 2025
- Forecast of Australia Substitute Natural Gas Market, 2032
- Historical Data and Forecast of Australia Substitute Natural Gas Revenues & Volume for the Period 2022 - 2032F
- Australia Substitute Natural Gas Market Trend Evolution
- Australia Substitute Natural Gas Market Drivers and Challenges
- Australia Substitute Natural Gas Price Trends
- Australia Substitute Natural Gas Porter's Five Forces
- Australia Substitute Natural Gas Industry Life Cycle
- Historical Data and Forecast of Australia Substitute Natural Gas Market Revenues & Volume By Source for the Period 2022 - 2032F
- Historical Data and Forecast of Australia Substitute Natural Gas Market Revenues & Volume By Coal for the Period 2022 - 2032F
- Historical Data and Forecast of Australia Substitute Natural Gas Market Revenues & Volume By Oil for the Period 2022 - 2032F
- Historical Data and Forecast of Australia Substitute Natural Gas Market Revenues & Volume By Biomass for the Period 2022 - 2032F
- Historical Data and Forecast of Australia Substitute Natural Gas Market Revenues & Volume By Solid Waste for the Period 2022 - 2032F
- Historical Data and Forecast of Australia Substitute Natural Gas Market Revenues & Volume By Others for the Period 2022 - 2032F
- Historical Data and Forecast of Australia Substitute Natural Gas Market Revenues & Volume By Application for the Period 2022 - 2032F
- Historical Data and Forecast of Australia Substitute Natural Gas Market Revenues & Volume By Transportation for the Period 2022 - 2032F
- Historical Data and Forecast of Australia Substitute Natural Gas Market Revenues & Volume By Energy for the Period 2022 - 2032F
- Historical Data and Forecast of Australia Substitute Natural Gas Market Revenues & Volume By Residential Heating for the Period 2022 - 2032F
- Historical Data and Forecast of Australia Substitute Natural Gas Market Revenues & Volume By Industrial for the Period 2022 - 2032F
- Historical Data and Forecast of Australia Substitute Natural Gas Market Revenues & Volume By Others for the Period 2022 - 2032F
- Australia Substitute Natural Gas Import Export Trade Statistics
- Market Opportunity Assessment By Source
- Market Opportunity Assessment By Application
- Australia Substitute Natural Gas Top Companies Market Share
- Australia Substitute Natural Gas Competitive Benchmarking By Technical and Operational Parameters
- Australia Substitute Natural Gas Company Profiles
- Australia Substitute Natural Gas Key Strategic Recommendations
Australia Substitute Natural Gas Market (2026-2032): FAQs
6Wresearch actively monitors the Australia Substitute Natural Gas Market and publishes its comprehensive annual report, highlighting emerging trends, growth drivers, revenue analysis, and forecast outlook. Our insights help businesses to make data-backed strategic decisions with ongoing market dynamics. Our analysts track relevent industries related to the Australia Substitute Natural Gas Market, allowing our clients with actionable intelligence and reliable forecasts tailored to emerging regional needs.
Yes, we provide customisation as per your requirements. To learn more, feel free to contact us on sales@6wresearch.com
1 Executive Summary |
2 Introduction |
2.1 Key Highlights of the Report |
2.2 Report Description |
2.3 Market Scope & Segmentation |
2.4 Research Methodology |
2.5 Assumptions |
3 Australia Substitute Natural Gas Market Overview |
3.1 Australia Country Macro Economic Indicators |
3.2 Australia Substitute Natural Gas Market Revenues & Volume, 2022 & 2032F |
3.3 Australia Substitute Natural Gas Market - Industry Life Cycle |
3.4 Australia Substitute Natural Gas Market - Porter's Five Forces |
3.5 Australia Substitute Natural Gas Market Revenues & Volume Share, By Source, 2022 & 2032F |
3.6 Australia Substitute Natural Gas Market Revenues & Volume Share, By Application, 2022 & 2032F |
4 Australia Substitute Natural Gas Market Dynamics |
4.1 Impact Analysis |
4.2 Market Drivers |
4.2.1 Increasing environmental awareness and government regulations promoting the use of cleaner energy sources. |
4.2.2 Fluctuating prices of traditional natural gas leading consumers to seek more cost-effective alternatives. |
4.2.3 Growth in industrial and commercial sectors driving demand for substitute natural gas. |
4.3 Market Restraints |
4.3.1 High initial investment costs in infrastructure for substitute natural gas production and distribution. |
4.3.2 Limited availability and scalability of substitute natural gas technology. |
4.3.3 Competition from other renewable energy sources such as solar and wind power. |
5 Australia Substitute Natural Gas Market Trends |
6 Australia Substitute Natural Gas Market, By Types |
6.1 Australia Substitute Natural Gas Market, By Source |
6.1.1 Overview and Analysis |
6.1.2 Australia Substitute Natural Gas Market Revenues & Volume, By Source, 2022 - 2032F |
6.1.3 Australia Substitute Natural Gas Market Revenues & Volume, By Coal, 2022 - 2032F |
6.1.4 Australia Substitute Natural Gas Market Revenues & Volume, By Oil, 2022 - 2032F |
6.1.5 Australia Substitute Natural Gas Market Revenues & Volume, By Biomass, 2022 - 2032F |
6.1.6 Australia Substitute Natural Gas Market Revenues & Volume, By Solid Waste, 2022 - 2032F |
6.1.7 Australia Substitute Natural Gas Market Revenues & Volume, By Others, 2022 - 2032F |
6.2 Australia Substitute Natural Gas Market, By Application |
6.2.1 Overview and Analysis |
6.2.2 Australia Substitute Natural Gas Market Revenues & Volume, By Transportation, 2022 - 2032F |
6.2.3 Australia Substitute Natural Gas Market Revenues & Volume, By Energy, 2022 - 2032F |
6.2.4 Australia Substitute Natural Gas Market Revenues & Volume, By Residential Heating, 2022 - 2032F |
6.2.5 Australia Substitute Natural Gas Market Revenues & Volume, By Industrial, 2022 - 2032F |
6.2.6 Australia Substitute Natural Gas Market Revenues & Volume, By Others, 2022 - 2032F |
7 Australia Substitute Natural Gas Market Import-Export Trade Statistics |
7.1 Australia Substitute Natural Gas Market Export to Major Countries |
7.2 Australia Substitute Natural Gas Market Imports from Major Countries |
8 Australia Substitute Natural Gas Market Key Performance Indicators |
8.1 Percentage of government subsidies allocated to promote the use of substitute natural gas. |
8.2 Number of new infrastructure projects related to substitute natural gas production and distribution. |
8.3 Growth rate of industrial and commercial sectors adopting substitute natural gas technology. |
8.4 Carbon emission reduction achieved through the use of substitute natural gas. |
8.5 Percentage of energy mix in Australia attributed to substitute natural gas. |
9 Australia Substitute Natural Gas Market - Opportunity Assessment |
9.1 Australia Substitute Natural Gas Market Opportunity Assessment, By Source, 2022 & 2032F |
9.2 Australia Substitute Natural Gas Market Opportunity Assessment, By Application, 2022 & 2032F |
10 Australia Substitute Natural Gas Market - Competitive Landscape |
10.1 Australia Substitute Natural Gas Market Revenue Share, By Companies, 2025 |
10.2 Australia Substitute Natural Gas Market Competitive Benchmarking, By Operating and Technical Parameters |
11 Company Profiles |
12 Recommendations |
13 Disclaimer |
Export potential assessment - trade Analytics for 2030
Export potential enables firms to identify high-growth global markets with greater confidence by combining advanced trade intelligence with a structured quantitative methodology. The framework analyzes emerging demand trends and country-level import patterns while integrating macroeconomic and trade datasets such as GDP and population forecasts, bilateral import–export flows, tariff structures, elasticity differentials between developed and developing economies, geographic distance, and import demand projections. Using weighted trade values from 2020–2024 as the base period to project country-to-country export potential for 2030, these inputs are operationalized through calculated drivers such as gravity model parameters, tariff impact factors, and projected GDP per-capita growth. Through an analysis of hidden potentials, demand hotspots, and market conditions that are most favorable to success, this method enables firms to focus on target countries, maximize returns, and global expansion with data, backed by accuracy.
By factoring in the projected importer demand gap that is currently unmet and could be potential opportunity, it identifies the potential for the Exporter (Country) among 190 countries, against the general trade analysis, which identifies the biggest importer or exporter.
To discover high-growth global markets and optimize your business strategy:
Click Here
Pricing
- Single User License$ 1,995
- Department License$ 2,400
- Site License$ 3,120
- Global License$ 3,795

Search
Thought Leadership and Analyst Meet


Our Clients
Latest Reports
- Taiwan Food Delivery Platform Market (2026-2032) | Companies, Outlook, Analysis, Trends, Value, Revenue, Segmentation, Share, Forecast, Competitive Landscape, Growth, Size & Forecast
- United Kingdom (UK) Long-term Care Insurance Market (2026-2032) | Growth, Share, Consumer Insights, Drivers, Opportunities, Competition, Pricing Analysis, Segments, Restraints, Companies, Competitive, Value, Outlook, Size, Demand, Analysis, Challenges, Strategic Insights, Investment Trends, Revenue, Trends, Supply, Forecast
- United Kingdom (UK) Long Term Care Market (2026-2032) | Companies, Outlook, Analysis, Trends, Value, Revenue, Segmentation, Share, Forecast, Competitive Landscape, Growth, Size & Forecast
- Iraq Insulation and Waterproofing Market (2026-2032) | Outlook, Drivers, Growth, Size, Share, Industry, Revenue, Trends, Demand, Competitive, Strategic Insights, Opportunities, Segments, Companies, Challenges, Strategy, Consumer Insights, Analysis, Investment Trends, Value, Segmentation, Forecast, Restraints
- India Switchgear Market Outlook (2026-2032) | Size, Share, Trends, Growth, Revenue, Forecast, Analysis, Value, Outlook
- Pakistan Contraceptive Implants Market (2025-2031) | Demand, Growth, Size, Share, Industry, Pricing Analysis, Competitive, Strategic Insights, Strategy, Consumer Insights, Analysis, Investment Trends, Opportunities, Revenue, Segments, Value, Segmentation, Supply, Forecast, Restraints, Outlook, Competition, Drivers, Trends, Companies, Challenges
- Sri Lanka Packaging Market (2026-2032) | Outlook, Competition, Drivers, Trends, Demand, Pricing Analysis, Competitive, Strategic Insights, Companies, Challenges, Strategy, Consumer Insights, Analysis, Investment Trends, Opportunities, Growth, Size, Share, Industry, Revenue, Segments, Value, Segmentation, Supply, Forecast, Restraints
- India Kids Watches Market (2026-2032) | Strategy, Consumer Insights, Analysis, Investment Trends, Opportunities, Growth, Size, Share, Industry, Revenue, Segments, Value, Segmentation, Supply, Forecast, Restraints, Outlook, Competition, Drivers, Trends, Demand, Pricing Analysis, Competitive, Strategic Insights, Companies, Challenges
- Saudi Arabia Core Assurance Service Market (2025-2031) | Strategy, Consumer Insights, Analysis, Investment Trends, Opportunities, Growth, Size, Share, Industry, Revenue, Segments, Value, Segmentation, Supply, Forecast, Restraints, Outlook, Competition, Drivers, Trends, Demand, Pricing Analysis, Competitive, Strategic Insights, Companies, Challenges
- Romania Uninterruptible Power Supply (UPS) Market (2026-2032) | Industry, Analysis, Revenue, Size, Forecast, Outlook, Value, Trends, Share, Growth & Companies
Industry Events and Analyst Meet

India EV Show 2026

EV tech India Expo 2026

Auto Tech Asia 2026

Battery Tech India 2026

Smart Production Solutions Guangzhou 2026
Whitepaper
- Middle East & Africa Commercial Security Market Click here to view more.
- Middle East & Africa Fire Safety Systems & Equipment Market Click here to view more.
- GCC Drone Market Click here to view more.
- Middle East Lighting Fixture Market Click here to view more.
- GCC Physical & Perimeter Security Market Click here to view more.
6WResearch In News
- Doha a strategic location for EV manufacturing hub: IPA Qatar
- Demand for luxury TVs surging in the GCC, says Samsung
- Empowering Growth: The Thriving Journey of Bangladesh’s Cable Industry
- Demand for luxury TVs surging in the GCC, says Samsung
- Video call with a traditional healer? Once unthinkable, it’s now common in South Africa
- Intelligent Buildings To Smooth GCC’s Path To Net Zero