Australia Tables Market (2026-2032) | Size, Outlook, Trends, Revenue, Share, Industry, Value, Companies, Growth, Analysis & Forecast
Market Forecast By Types (Fabric, Leather, Metal, Wooden, Others), By Applications (Family, Office, Others) And Competitive Landscape
| Product Code: ETC034675 | Publication Date: Oct 2020 | Updated Date: Jun 2026 | Product Type: Report | |
| Publisher: 6Wresearch | Author: Ravi Bhandari | No. of Pages: 70 | No. of Figures: 35 | No. of Tables: 5 |
Australia Tables Market Summary
The australia tables market was estimated at USD 112 Million in 2025 and is projected to reach USD 131 Million by 2032, growing at a CAGR of 2.7% from 2026 to 2032.
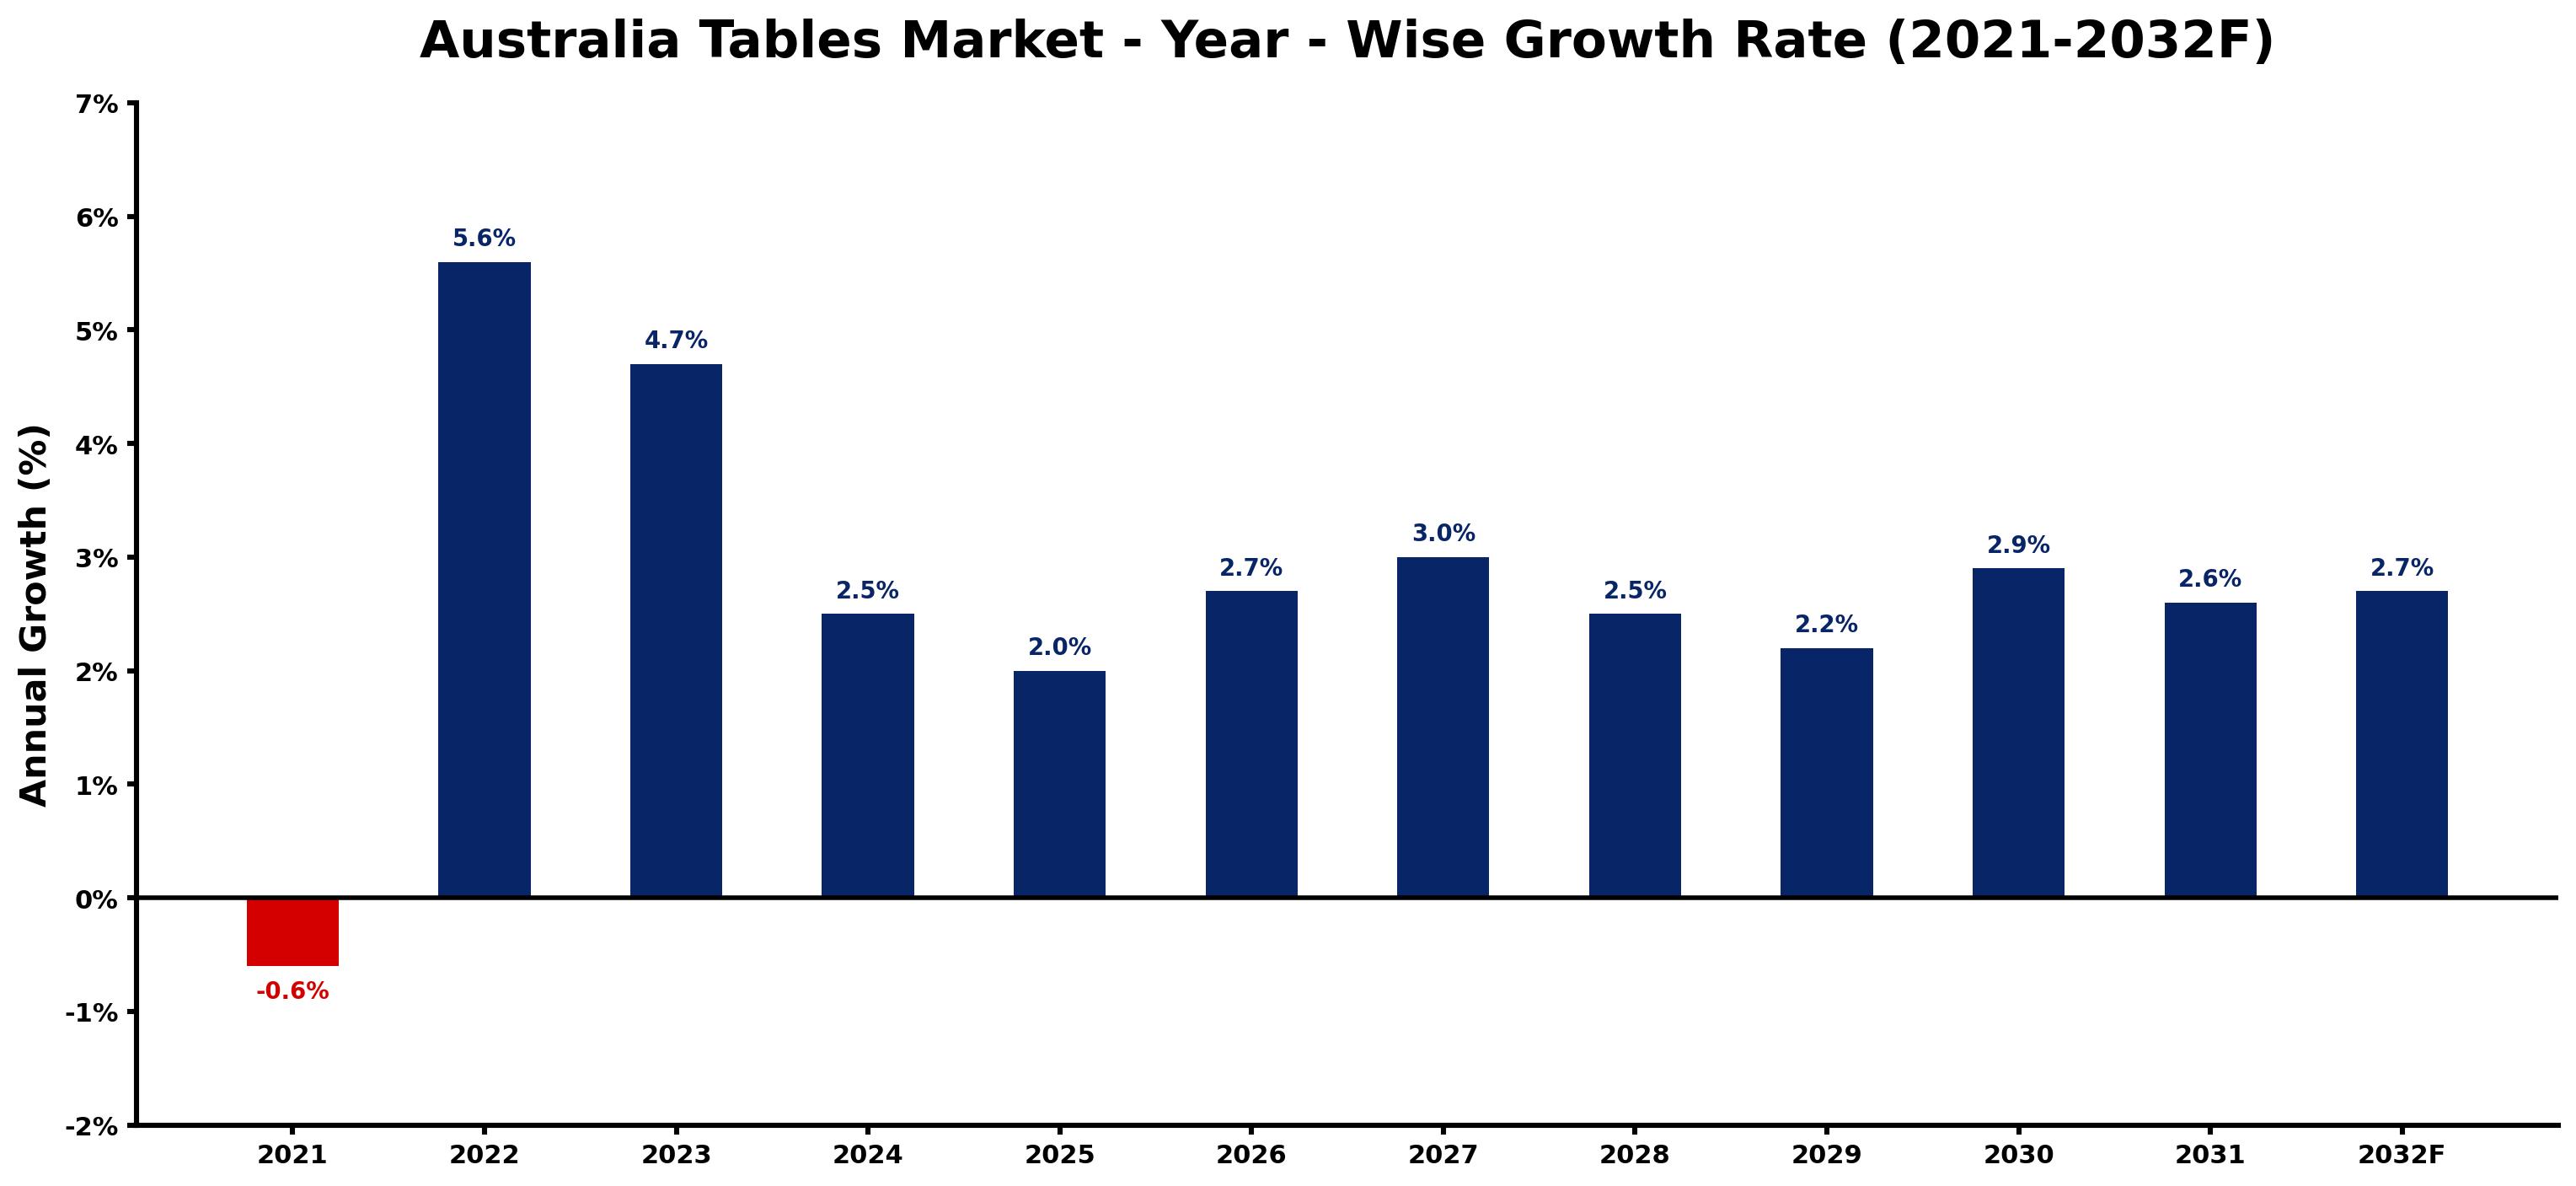
Australia Tables Market Growth Rate Analysis (2021-2032)
The Australian tables market has displayed a notable upward trend after facing a minor decline of 0.6% in 2021. By 2022, the market rebounded with a significant growth rate of 5.6%, driven by a surge in consumer demand for home furnishings as remote work became commonplace. This momentum continued into 2023 with a growth of 4.7%, reflecting robust investment in local manufacturing and sustainable materials. The growth rate is projected to stabilize between 2.0% and 3.0% from 2024 to 2032, supported by ongoing digitalization in retail and evolving consumer preferences. Continued infrastructure development and a shift towards energy-efficient products are expected to further sustain market vitality.
Australia Tables Market Year-wise Growth Rate and Key Drivers
This graph highlights how the Australia Tables Market has steadily grown over the past five years, supported by major growth factors.
The table below presents the year wise growth rates along with the key drivers influencing the market
| Year | Growth Rate | Major Drivers |
| 2021 | -0.6% | Supply chain disruptions limited product availability, deterring purchases in the Australian tables market. |
| 2022 | 5.6% | Sustainable materials gained traction, appealing to eco-conscious consumers in furniture design. |
| 2023 | 4.7% | E-commerce platforms expanded, making furniture purchasing more accessible for Australians. |
| 2024 | 2.5% | Remote work trends led to increased demand for multifunctional home office tables. |
| 2025 | 2.0% | Urbanization pressures prompted compact table designs perfect for smaller living spaces. |
| 2026 | 2.7% | Technological innovations in manufacturing improved customization options for furniture consumers. |
| 2027 | 3.0% | Aging populations necessitated ergonomic furniture solutions, enhancing comfort in daily use. |
| 2028 | 2.5% | Lifestyle changes highlighted the importance of outdoor furniture for alfresco dining experiences. |
| 2029 | 2.2% | Interior design trends leaned towards minimalism, influencing simpler, cleaner table aesthetics. |
| 2030 | 2.9% | Investment in local manufacturing capabilities boosted availability of unique Australian designs. |
| 2031 | 2.6% | Collaborations between designers and brands delivered fresh, limited-edition table collections. |
| 2032 | 2.7% | Cultural shifts emphasized the significance of social spaces, increasing table demand further. |
Note - Market size estimations and growth projections presented in this report are based on 6Wresearch's advanced forecasting approach, validated with industry datasets as of June 2026.
Australia Tables Market Synopsis
The Australia Tables Market is projected to reach 2.7% and witness significant growth during the forecast period (2026-2032). This market encompasses a comprehensive array of table types, including dining, coffee, side, and outdoor tables, which are integral to both residential and commercial environments. As essential furniture items, tables not only fulfill functional requirements but also contribute to the overall aesthetic of diverse interiors.
Australia Tables Market Growth Drivers
Several key factors are driving the growth of the Australia Tables Market. Firstly, the increasing demand for versatile furniture solutions in various settings enhances the market's expansion. Tables are pivotal in residential spaces for dining and socializing, while in commercial environments, they are equally important for work and collaboration.
- The rising trend of interior design emphasizes the aesthetic value of tables, leading to a greater emphasis on unique designs and materials that cater to personal tastes.
- The focus on ergonomics has prompted consumers to seek out tables that support comfort and productivity, particularly in home office setups.
- Sustainability is becoming increasingly important, with consumers gravitating towards eco-friendly materials and production methods that align with their values.
- The rapid growth of e-commerce platforms has broadened consumer access to a diverse range of table options, enhancing purchase convenience and variety.
- The influence of social media and online home decor inspirations encourages consumers to refresh their interiors, driving demand for new and trendy tables.
Australia Tables Market Challenges and Restraints
Despite the robust growth potential, the Australia Tables Market faces several challenges. Manufacturers are tasked with evolving alongside changing consumer preferences, particularly as lifestyles adapt to smaller living spaces. Producing multifunctional and space-saving tables while ensuring quality and affordability presents a notable challenge.
- Maintaining consistent supply chains is increasingly difficult due to global economic uncertainties, which can lead to raw material shortages and production delays.
- The requirement to meet stringent safety and stability standards imposes additional costs on manufacturers, affecting pricing strategies.
- Emerging competitors in the market introduce innovative designs but may also create pricing pressure on established brands.
- Balancing the demand for affordable furniture with the need for environmentally friendly production is an ongoing challenge that manufacturers must address.
- Consumer expectations for faster delivery times can strain logistics and fulfillment operations, necessitating investment in efficient solutions.
Australia Tables Market Government Investment and Initiatives
Government policies play a crucial role in shaping the Australia Tables Market. Various regulations govern product safety, materials used, and labeling requirements, which ensure that consumer safety standards are upheld. This regulatory environment encourages manufacturers to maintain high-quality production standards, thereby enhancing overall market trust.
- Safety standards mandate stability and durability tests for furniture, ensuring only reliable products enter the market.
- Environmental regulations driven by sustainability efforts influence sourcing practices, prompting a shift towards renewable materials.
- Public funding initiatives for innovation and development in the furniture sector encourage manufacturers to invest in new technologies and designs.
- Government support for local manufacturing aims to reduce reliance on imports and promote economic growth within the country.
- Incentives for businesses adopting sustainable practices are becoming commonplace, guiding manufacturers towards eco-friendly production.\
Australia Tables Market Latest Developments (May 2025 - June 2026)
The Australia Tables Market has experienced notable developments from May 2025 to June 2026. As consumer preferences shift towards multifunctional and customized furniture, manufacturers are increasingly adapting their offerings to cater to these needs. The focus on sustainability has led to innovative materials entering the marketplace, promoting eco-friendly table designs.
- There has been a surge in online sales channels, facilitating greater accessibility and variety for consumers looking to purchase tables.
- Emerging design trends have showcased a blend of modern aesthetics with traditional craftsmanship, appealing to a broad range of consumers.
- Investment in automated manufacturing processes is on the rise, aimed at improving efficiency and reducing production costs.
- Collaboration between designers and manufacturers has become more common, leading to unique product offerings tailored to niche markets.
- Consumer awareness campaigns around sustainability and responsible sourcing have influenced purchasing behavior, further driving demand for eco-friendly tables.
Australia Tables Market - Key Attractiveness of the Report
- 10 Years of Market Numbers
- Historical Data Starting from 2022 to 2025
- Base Year: 2025
- Forecast Data until 2032
- Key Performance Indicators Impacting the Market
- Major Upcoming Developments and Projects
Key Highlights of the Report:
- Australia Tables Market Outlook
- Market Size of Australia Tables Market, 2025
- Forecast of Australia Tables Market, 2032
- Historical Data and Forecast of Australia Tables Revenues & Volume for the Period 2022-2032F
- Australia Tables Market Trend Evolution
- Australia Tables Market Drivers and Challenges
- Australia Tables Price Trends
- Australia Tables Porter's Five Forces
- Australia Tables Industry Life Cycle
- Historical Data and Forecast of Australia Tables Market Revenues & Volume By Types for the Period 2022-2032F
- Historical Data and Forecast of Australia Tables Market Revenues & Volume By Fabric for the Period 2022-2032F
- Historical Data and Forecast of Australia Tables Market Revenues & Volume By Leather for the Period 2022-2032F
- Historical Data and Forecast of Australia Tables Market Revenues & Volume By Metal for the Period 2022-2032F
- Historical Data and Forecast of Australia Tables Market Revenues & Volume By Wooden for the Period 2022-2032F
- Historical Data and Forecast of Australia Tables Market Revenues & Volume By Others for the Period 2022-2032F
- Historical Data and Forecast of Australia Tables Market Revenues & Volume By Applications for the Period 2022-2032F
- Historical Data and Forecast of Australia Tables Market Revenues & Volume By Family for the Period 2022-2032F
- Historical Data and Forecast of Australia Tables Market Revenues & Volume By Office for the Period 2022-2032F
- Historical Data and Forecast of Australia Tables Market Revenues & Volume By Others for the Period 2022-2032F
- Australia Tables Import Export Trade Statistics
- Market Opportunity Assessment By Types
- Market Opportunity Assessment By Applications
- Australia Tables Top Companies Market Share
- Australia Tables Competitive Benchmarking By Technical and Operational Parameters
- Australia Tables Company Profiles
- Australia Tables Key Strategic Recommendations
Frequently Asked Questions About the Market Study (FAQs):
The market encompasses a variety of table types, including dining tables, coffee tables, side tables, and outdoor tables, catering to both residential and commercial needs.
Increasing focus on home aesthetics, functionality, and sustainability are primary drivers for the rising demand in the Australia Tables Market.
Government regulations related to safety standards, environmental sustainability, and local manufacturing practices significantly shape the market landscape.
Manufacturers encounter challenges such as maintaining quality amid evolving consumer preferences, navigating supply chain issues, and adhering to stringent safety regulations.
6Wresearch actively monitors the Australia Tables Market and publishes its comprehensive annual report, highlighting emerging trends, growth drivers, revenue analysis, and forecast outlook. Our insights help businesses to make data-backed strategic decisions with ongoing market dynamics. Our analysts track relevent industries related to the Australia Tables Market, allowing our clients with actionable intelligence and reliable forecasts tailored to emerging regional needs.
Yes, we provide customisation as per your requirements. To learn more, feel free to contact us on sales@6wresearch.com
1 Executive Summary |
2 Introduction |
2.1 Key Highlights of the Report |
2.2 Report Description |
2.3 Market Scope & Segmentation |
2.4 Research Methodology |
2.5 Assumptions |
3 Australia Tables Market Overview |
3.1 Australia Country Macro Economic Indicators |
3.2 Australia Tables Market Revenues & Volume, 2022 & 2032F |
3.3 Australia Tables Market - Industry Life Cycle |
3.4 Australia Tables Market - Porter's Five Forces |
3.5 Australia Tables Market Revenues & Volume Share, By Types, 2022 & 2032F |
3.6 Australia Tables Market Revenues & Volume Share, By Applications, 2022 & 2032F |
4 Australia Tables Market Dynamics |
4.1 Impact Analysis |
4.2 Market Drivers |
4.2.1 Growing demand for furniture in the commercial sector due to expanding businesses and tourism industry. |
4.2.2 Increasing focus on interior design and home decor among consumers. |
4.2.3 Technological advancements leading to innovative table designs and materials. |
4.3 Market Restraints |
4.3.1 Fluctuating raw material prices affecting production costs. |
4.3.2 Intense competition from imported tables and furniture brands. |
4.3.3 Economic uncertainty impacting consumer spending on non-essential items. |
5 Australia Tables Market Trends |
6 Australia Tables Market, By Types |
6.1 Australia Tables Market, By Types |
6.1.1 Overview and Analysis |
6.1.2 Australia Tables Market Revenues & Volume, By Types, 2022-2032F |
6.1.3 Australia Tables Market Revenues & Volume, By Fabric, 2022-2032F |
6.1.4 Australia Tables Market Revenues & Volume, By Leather, 2022-2032F |
6.1.5 Australia Tables Market Revenues & Volume, By Metal, 2022-2032F |
6.1.6 Australia Tables Market Revenues & Volume, By Wooden, 2022-2032F |
6.1.7 Australia Tables Market Revenues & Volume, By Others, 2022-2032F |
6.2 Australia Tables Market, By Applications |
6.2.1 Overview and Analysis |
6.2.2 Australia Tables Market Revenues & Volume, By Family, 2022-2032F |
6.2.3 Australia Tables Market Revenues & Volume, By Office, 2022-2032F |
6.2.4 Australia Tables Market Revenues & Volume, By Others, 2022-2032F |
7 Australia Tables Market Import-Export Trade Statistics |
7.1 Australia Tables Market Export to Major Countries |
7.2 Australia Tables Market Imports from Major Countries |
8 Australia Tables Market Key Performance Indicators |
8.1 Consumer sentiment towards furniture purchases. |
8.2 Number of new product launches in the tables market. |
8.3 Average order value for table purchases. |
8.4 Percentage of revenue from online sales. |
8.5 Customer satisfaction ratings for table products. |
9 Australia Tables Market - Opportunity Assessment |
9.1 Australia Tables Market Opportunity Assessment, By Types, 2022 & 2032F |
9.2 Australia Tables Market Opportunity Assessment, By Applications, 2022 & 2032F |
10 Australia Tables Market - Competitive Landscape |
10.1 Australia Tables Market Revenue Share, By Companies, 2025 |
10.2 Australia Tables Market Competitive Benchmarking, By Operating and Technical Parameters |
11 Company Profiles |
12 Recommendations |
13 Disclaimer |
Global Go To Market Strategy - 2030
Export potential enables firms to identify high-growth global markets with greater confidence by combining advanced trade intelligence with a structured quantitative methodology. The framework analyzes emerging demand trends and country-level import patterns while integrating macroeconomic and trade datasets such as GDP and population forecasts, bilateral import–export flows, tariff structures, elasticity differentials between developed and developing economies, geographic distance, and import demand projections. Using weighted trade values from 2020–2024 as the base period to project country-to-country export potential for 2030, these inputs are operationalized through calculated drivers such as gravity model parameters, tariff impact factors, and projected GDP per-capita growth. Through an analysis of hidden potentials, demand hotspots, and market conditions that are most favorable to success, this method enables firms to focus on target countries, maximize returns, and global expansion with data, backed by accuracy.
By factoring in the projected importer demand gap that is currently unmet and could be potential opportunity, it identifies the potential for the Exporter (Country) among 190 countries, against the general trade analysis, which identifies the biggest importer or exporter.
To discover high-growth global markets and optimize your business strategy:
Click Here
Pricing
- Single User License$ 1,995
- Department License$ 2,400
- Site License$ 3,120
- Global License$ 3,795

Leadership Perspectives from Industry Events
Search
Thought Leadership and Analyst Meet


Our Clients
6WResearch In News
- India Air Conditioner Market Set for Strong Rebound in 2026 After Weather-Led Correction and GST-Driven Recovery: 6Wresearch
- ADAS in India: How Automatic Emergency Braking, Blind Spot Detection & Driver Monitoring are Transforming Road Safety
- Doha a strategic location for EV manufacturing hub: IPA Qatar
- Demand for luxury TVs surging in the GCC, says Samsung
- Empowering Growth: The Thriving Journey of Bangladesh’s Cable Industry
- Demand for luxury TVs surging in the GCC, says Samsung
Latest Reports
- Nicaragua RPG Gaming Market (2026-2032)
- New Zealand RPG Gaming Market (2026-2032)
- Netherlands RPG Gaming Market (2026-2032)
- Nauru RPG Gaming Market (2026-2032)
- Namibia RPG Gaming Market (2026-2032)
- Mozambique RPG Gaming Market (2026-2032)
- Montenegro RPG Gaming Market (2026-2032)
- Mongolia RPG Gaming Market (2026-2032)
- Monaco RPG Gaming Market (2026-2032)
- Micronesia RPG Gaming Market (2026-2032)
Industry Events and Analyst Meet

HIMTEX 2026

India Refining Summit 2026

India EV Show 2026

EV tech India Expo 2026

Auto Tech Asia 2026
Whitepaper
- Middle East & Africa Commercial Security Market Click here to view more.
- Middle East & Africa Fire Safety Systems & Equipment Market Click here to view more.
- GCC Drone Market Click here to view more.
- Middle East Lighting Fixture Market Click here to view more.
- GCC Physical & Perimeter Security Market Click here to view more.