Australia Tags Market Outlook | Value, Industry, Analysis, Trends, Revenue, Size, Growth, Companies, Forecast, Share & COVID-19 IMPACT
Market Forecast By Material Type (Plastic, Paper, Fibers, Others (Metal, etc.)), By Tag Type (RFID Tag, Hang/ Swing Tag, Loop Tag), By End Use (Food & Beverage, Clothing & Apparels, Hospitality & Travel, Beauty & Personal Care, Consumer Electronics, Others) And Competitive Landscape
| Product Code: ETC428071 | Publication Date: Oct 2022 | Updated Date: Aug 2025 | Product Type: Market Research Report | |
| Publisher: 6Wresearch | Author: Shubham Padhi | No. of Pages: 75 | No. of Figures: 35 | No. of Tables: 20 |
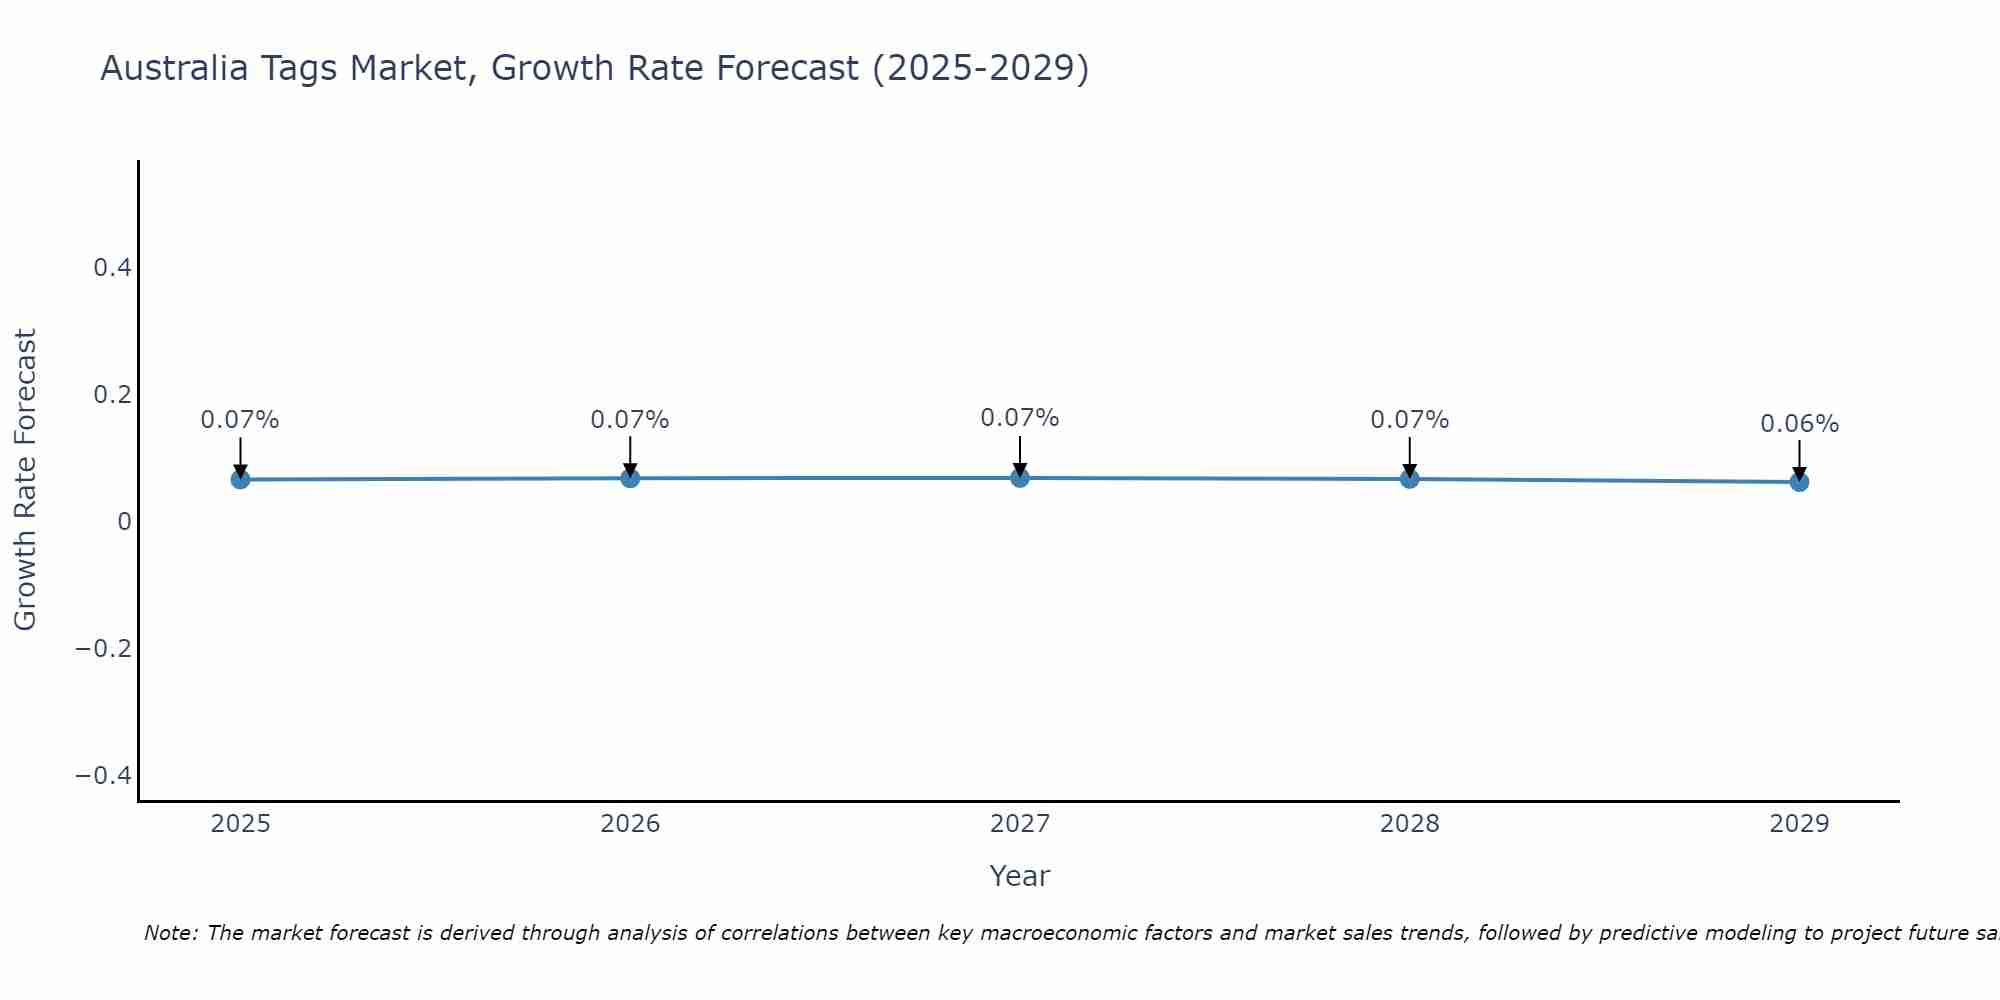
Australia Tags Market Size Growth Rate
The Australia Tags Market is projected to witness mixed growth rate patterns during 2025 to 2029. Starting at 0.07% in 2025, the market peaks at 0.07% in 2027, and settles at 0.06% by 2029.
Australia Tags Market Overview
The tags market in Australia encompasses a wide range of products, including clothing tags, luggage tags, and industrial tags. With the growing demand for customized and branded tags across various sectors, the market is witnessing consistent expansion driven by both domestic consumption and export opportunities.
Drivers of the market
The tags market in Australia is experiencing a surge in demand, primarily driven by the growing e-commerce sector. As online shopping becomes increasingly popular, the need for tags for labeling and tracking purposes has intensified, leading to market growth.
Challenges of the market
In Australia, the tags market encounters challenges related to counterfeit products and intellectual property rights infringement. Ensuring authenticity and protecting brands from piracy poses significant hurdles for manufacturers and distributors.
Government Policy of the market
The Australia government has implemented several policies to regulate and support the tags market within the country. These policies aim to ensure product safety, fair competition, and environmental sustainability. One of the primary regulations governing the tags market is the Australia Competition and Consumer Act, which prohibits anti-competitive conduct and ensures fair trading practices. Additionally, the Australia Standards for tags manufacturing dictate quality standards and specifications, promoting consumer safety and confidence in the products. Furthermore, the government encourages innovation and research in the tags industry through grants and subsidies, fostering technological advancements and market growth. Environmental policies, such as waste management regulations and eco-labeling schemes, also play a crucial role in promoting sustainable practices within the tags market.
Key Highlights of the Report:
- Australia Tags Market Outlook
- Market Size of Australia Tags Market, 2024
- Forecast of Australia Tags Market, 2031
- Historical Data and Forecast of Australia Tags Revenues & Volume for the Period 2018 - 2031
- Australia Tags Market Trend Evolution
- Australia Tags Market Drivers and Challenges
- Australia Tags Price Trends
- Australia Tags Porter's Five Forces
- Australia Tags Industry Life Cycle
- Historical Data and Forecast of Australia Tags Market Revenues & Volume By Material Type for the Period 2018 - 2031
- Historical Data and Forecast of Australia Tags Market Revenues & Volume By Plastic for the Period 2018 - 2031
- Historical Data and Forecast of Australia Tags Market Revenues & Volume By Paper for the Period 2018 - 2031
- Historical Data and Forecast of Australia Tags Market Revenues & Volume By Fibers for the Period 2018 - 2031
- Historical Data and Forecast of Australia Tags Market Revenues & Volume By Others (Metal, etc.) for the Period 2018 - 2031
- Historical Data and Forecast of Australia Tags Market Revenues & Volume By Tag Type for the Period 2018 - 2031
- Historical Data and Forecast of Australia Tags Market Revenues & Volume By RFID Tag for the Period 2018 - 2031
- Historical Data and Forecast of Australia Tags Market Revenues & Volume By Hang/ Swing Tag for the Period 2018 - 2031
- Historical Data and Forecast of Australia Tags Market Revenues & Volume By Loop Tag for the Period 2018 - 2031
- Historical Data and Forecast of Australia Tags Market Revenues & Volume By End Use for the Period 2018 - 2031
- Historical Data and Forecast of Australia Tags Market Revenues & Volume By Food & Beverage for the Period 2018 - 2031
- Historical Data and Forecast of Australia Tags Market Revenues & Volume By Clothing & Apparels for the Period 2018 - 2031
- Historical Data and Forecast of Australia Tags Market Revenues & Volume By Hospitality & Travel for the Period 2018 - 2031
- Historical Data and Forecast of Australia Tags Market Revenues & Volume By Beauty & Personal Care for the Period 2018 - 2031
- Historical Data and Forecast of Australia Tags Market Revenues & Volume By Consumer Electronics for the Period 2018 - 2031
- Historical Data and Forecast of Australia Tags Market Revenues & Volume By Others for the Period 2018 - 2031
- Australia Tags Import Export Trade Statistics
- Market Opportunity Assessment By Material Type
- Market Opportunity Assessment By Tag Type
- Market Opportunity Assessment By End Use
- Australia Tags Top Companies Market Share
- Australia Tags Competitive Benchmarking By Technical and Operational Parameters
- Australia Tags Company Profiles
- Australia Tags Key Strategic Recommendations
Frequently Asked Questions About the Market Study (FAQs):
6Wresearch actively monitors the Australia Tags Market and publishes its comprehensive annual report, highlighting emerging trends, growth drivers, revenue analysis, and forecast outlook. Our insights help businesses to make data-backed strategic decisions with ongoing market dynamics. Our analysts track relevent industries related to the Australia Tags Market, allowing our clients with actionable intelligence and reliable forecasts tailored to emerging regional needs.
Yes, we provide customisation as per your requirements. To learn more, feel free to contact us on sales@6wresearch.com
1 Executive Summary |
2 Introduction |
2.1 Key Highlights of the Report |
2.2 Report Description |
2.3 Market Scope & Segmentation |
2.4 Research Methodology |
2.5 Assumptions |
3 Australia Tags Market Overview |
3.1 Australia Country Macro Economic Indicators |
3.2 Australia Tags Market Revenues & Volume, 2021 & 2031F |
3.3 Australia Tags Market - Industry Life Cycle |
3.4 Australia Tags Market - Porter's Five Forces |
3.5 Australia Tags Market Revenues & Volume Share, By Material Type, 2021 & 2031F |
3.6 Australia Tags Market Revenues & Volume Share, By Tag Type, 2021 & 2031F |
3.7 Australia Tags Market Revenues & Volume Share, By End Use, 2021 & 2031F |
4 Australia Tags Market Dynamics |
4.1 Impact Analysis |
4.2 Market Drivers |
4.2.1 Increasing adoption of RFID technology in various industries |
4.2.2 Growing need for efficient inventory management and supply chain operations |
4.2.3 Rising demand for tracking and tracing solutions in the retail sector |
4.3 Market Restraints |
4.3.1 High initial investment costs associated with implementing RFID technology |
4.3.2 Concerns regarding data security and privacy issues |
4.3.3 Lack of standardized regulations and protocols for RFID technology in Australia |
5 Australia Tags Market Trends |
6 Australia Tags Market, By Types |
6.1 Australia Tags Market, By Material Type |
6.1.1 Overview and Analysis |
6.1.2 Australia Tags Market Revenues & Volume, By Material Type, 2021-2031F |
6.1.3 Australia Tags Market Revenues & Volume, By Plastic, 2021-2031F |
6.1.4 Australia Tags Market Revenues & Volume, By Paper, 2021-2031F |
6.1.5 Australia Tags Market Revenues & Volume, By Fibers, 2021-2031F |
6.1.6 Australia Tags Market Revenues & Volume, By Others (Metal, etc.), 2021-2031F |
6.2 Australia Tags Market, By Tag Type |
6.2.1 Overview and Analysis |
6.2.2 Australia Tags Market Revenues & Volume, By RFID Tag, 2021-2031F |
6.2.3 Australia Tags Market Revenues & Volume, By Hang/ Swing Tag, 2021-2031F |
6.2.4 Australia Tags Market Revenues & Volume, By Loop Tag, 2021-2031F |
6.3 Australia Tags Market, By End Use |
6.3.1 Overview and Analysis |
6.3.2 Australia Tags Market Revenues & Volume, By Food & Beverage, 2021-2031F |
6.3.3 Australia Tags Market Revenues & Volume, By Clothing & Apparels, 2021-2031F |
6.3.4 Australia Tags Market Revenues & Volume, By Hospitality & Travel, 2021-2031F |
6.3.5 Australia Tags Market Revenues & Volume, By Beauty & Personal Care, 2021-2031F |
6.3.6 Australia Tags Market Revenues & Volume, By Consumer Electronics, 2021-2031F |
6.3.7 Australia Tags Market Revenues & Volume, By Others, 2021-2031F |
7 Australia Tags Market Import-Export Trade Statistics |
7.1 Australia Tags Market Export to Major Countries |
7.2 Australia Tags Market Imports from Major Countries |
8 Australia Tags Market Key Performance Indicators |
8.1 Average read accuracy rate of RFID tags |
8.2 Rate of adoption of RFID technology in different industries |
8.3 Percentage increase in efficiency of inventory management with the use of RFID technology |
9 Australia Tags Market - Opportunity Assessment |
9.1 Australia Tags Market Opportunity Assessment, By Material Type, 2021 & 2031F |
9.2 Australia Tags Market Opportunity Assessment, By Tag Type, 2021 & 2031F |
9.3 Australia Tags Market Opportunity Assessment, By End Use, 2021 & 2031F |
10 Australia Tags Market - Competitive Landscape |
10.1 Australia Tags Market Revenue Share, By Companies, 2024 |
10.2 Australia Tags Market Competitive Benchmarking, By Operating and Technical Parameters |
11 Company Profiles |
12 Recommendations |
13 Disclaimer |
Global Go To Market Strategy - 2030
Export potential enables firms to identify high-growth global markets with greater confidence by combining advanced trade intelligence with a structured quantitative methodology. The framework analyzes emerging demand trends and country-level import patterns while integrating macroeconomic and trade datasets such as GDP and population forecasts, bilateral import–export flows, tariff structures, elasticity differentials between developed and developing economies, geographic distance, and import demand projections. Using weighted trade values from 2020–2024 as the base period to project country-to-country export potential for 2030, these inputs are operationalized through calculated drivers such as gravity model parameters, tariff impact factors, and projected GDP per-capita growth. Through an analysis of hidden potentials, demand hotspots, and market conditions that are most favorable to success, this method enables firms to focus on target countries, maximize returns, and global expansion with data, backed by accuracy.
By factoring in the projected importer demand gap that is currently unmet and could be potential opportunity, it identifies the potential for the Exporter (Country) among 190 countries, against the general trade analysis, which identifies the biggest importer or exporter.
To discover high-growth global markets and optimize your business strategy:
Click Here
Pricing
- Single User License$ 1,995
- Department License$ 2,400
- Site License$ 3,120
- Global License$ 3,795

Leadership Perspectives from Industry Events
Search
Thought Leadership and Analyst Meet


Our Clients
6WResearch In News
- India Air Conditioner Market Set for Strong Rebound in 2026 After Weather-Led Correction and GST-Driven Recovery: 6Wresearch
- ADAS in India: How Automatic Emergency Braking, Blind Spot Detection & Driver Monitoring are Transforming Road Safety
- Doha a strategic location for EV manufacturing hub: IPA Qatar
- Demand for luxury TVs surging in the GCC, says Samsung
- Empowering Growth: The Thriving Journey of Bangladesh’s Cable Industry
- Demand for luxury TVs surging in the GCC, says Samsung
Latest Reports
- Poland Fire Protection Systems Market (2026-2032)
- Cape Verde Portable Hand-Thrown Extinguisher Market (2026-2032)
- Canada Portable Hand-Thrown Extinguisher Market (2026-2032)
- Cameroon Portable Hand-Thrown Extinguisher Market (2026-2032)
- Burundi Portable Hand-Thrown Extinguisher Market (2026-2032)
- Burkina Faso Portable Hand-Thrown Extinguisher Market (2026-2032)
- Bulgaria Portable Hand-Thrown Extinguisher Market (2026-2032)
- Brunei Portable Hand-Thrown Extinguisher Market (2026-2032)
- Botswana Portable Hand-Thrown Extinguisher Market (2026-2032)
- Bosnia and Herzegovina Portable Hand-Thrown Extinguisher Market (2026-2032)
Industry Events and Analyst Meet

HIMTEX 2026

India Refining Summit 2026

India EV Show 2026

EV tech India Expo 2026

Auto Tech Asia 2026
Whitepaper
- Middle East & Africa Commercial Security Market Click here to view more.
- Middle East & Africa Fire Safety Systems & Equipment Market Click here to view more.
- GCC Drone Market Click here to view more.
- Middle East Lighting Fixture Market Click here to view more.
- GCC Physical & Perimeter Security Market Click here to view more.