Australia Taste Enhancers Market (2026-2032) | Share, Value, Size & Revenue, Competitive Landscape, Analysis, Segmentation, Forecast, Industry, Growth, Outlook, Trends, Companies
Market Forecast By Type (Sweetness Enhancers, Mouthfeel Enhancers, Others), By Application (Infant Nutrition Industry, Clinical Nutrition Industry, Meat Processing Industry, Others) And Competitive Landscape
| Product Code: ETC6192577 | Publication Date: Sep 2024 | Updated Date: Mar 2026 | Product Type: Market Research Report | |
| Publisher: 6Wresearch | Author: Sumit Sagar | No. of Pages: 75 | No. of Figures: 35 | No. of Tables: 20 |
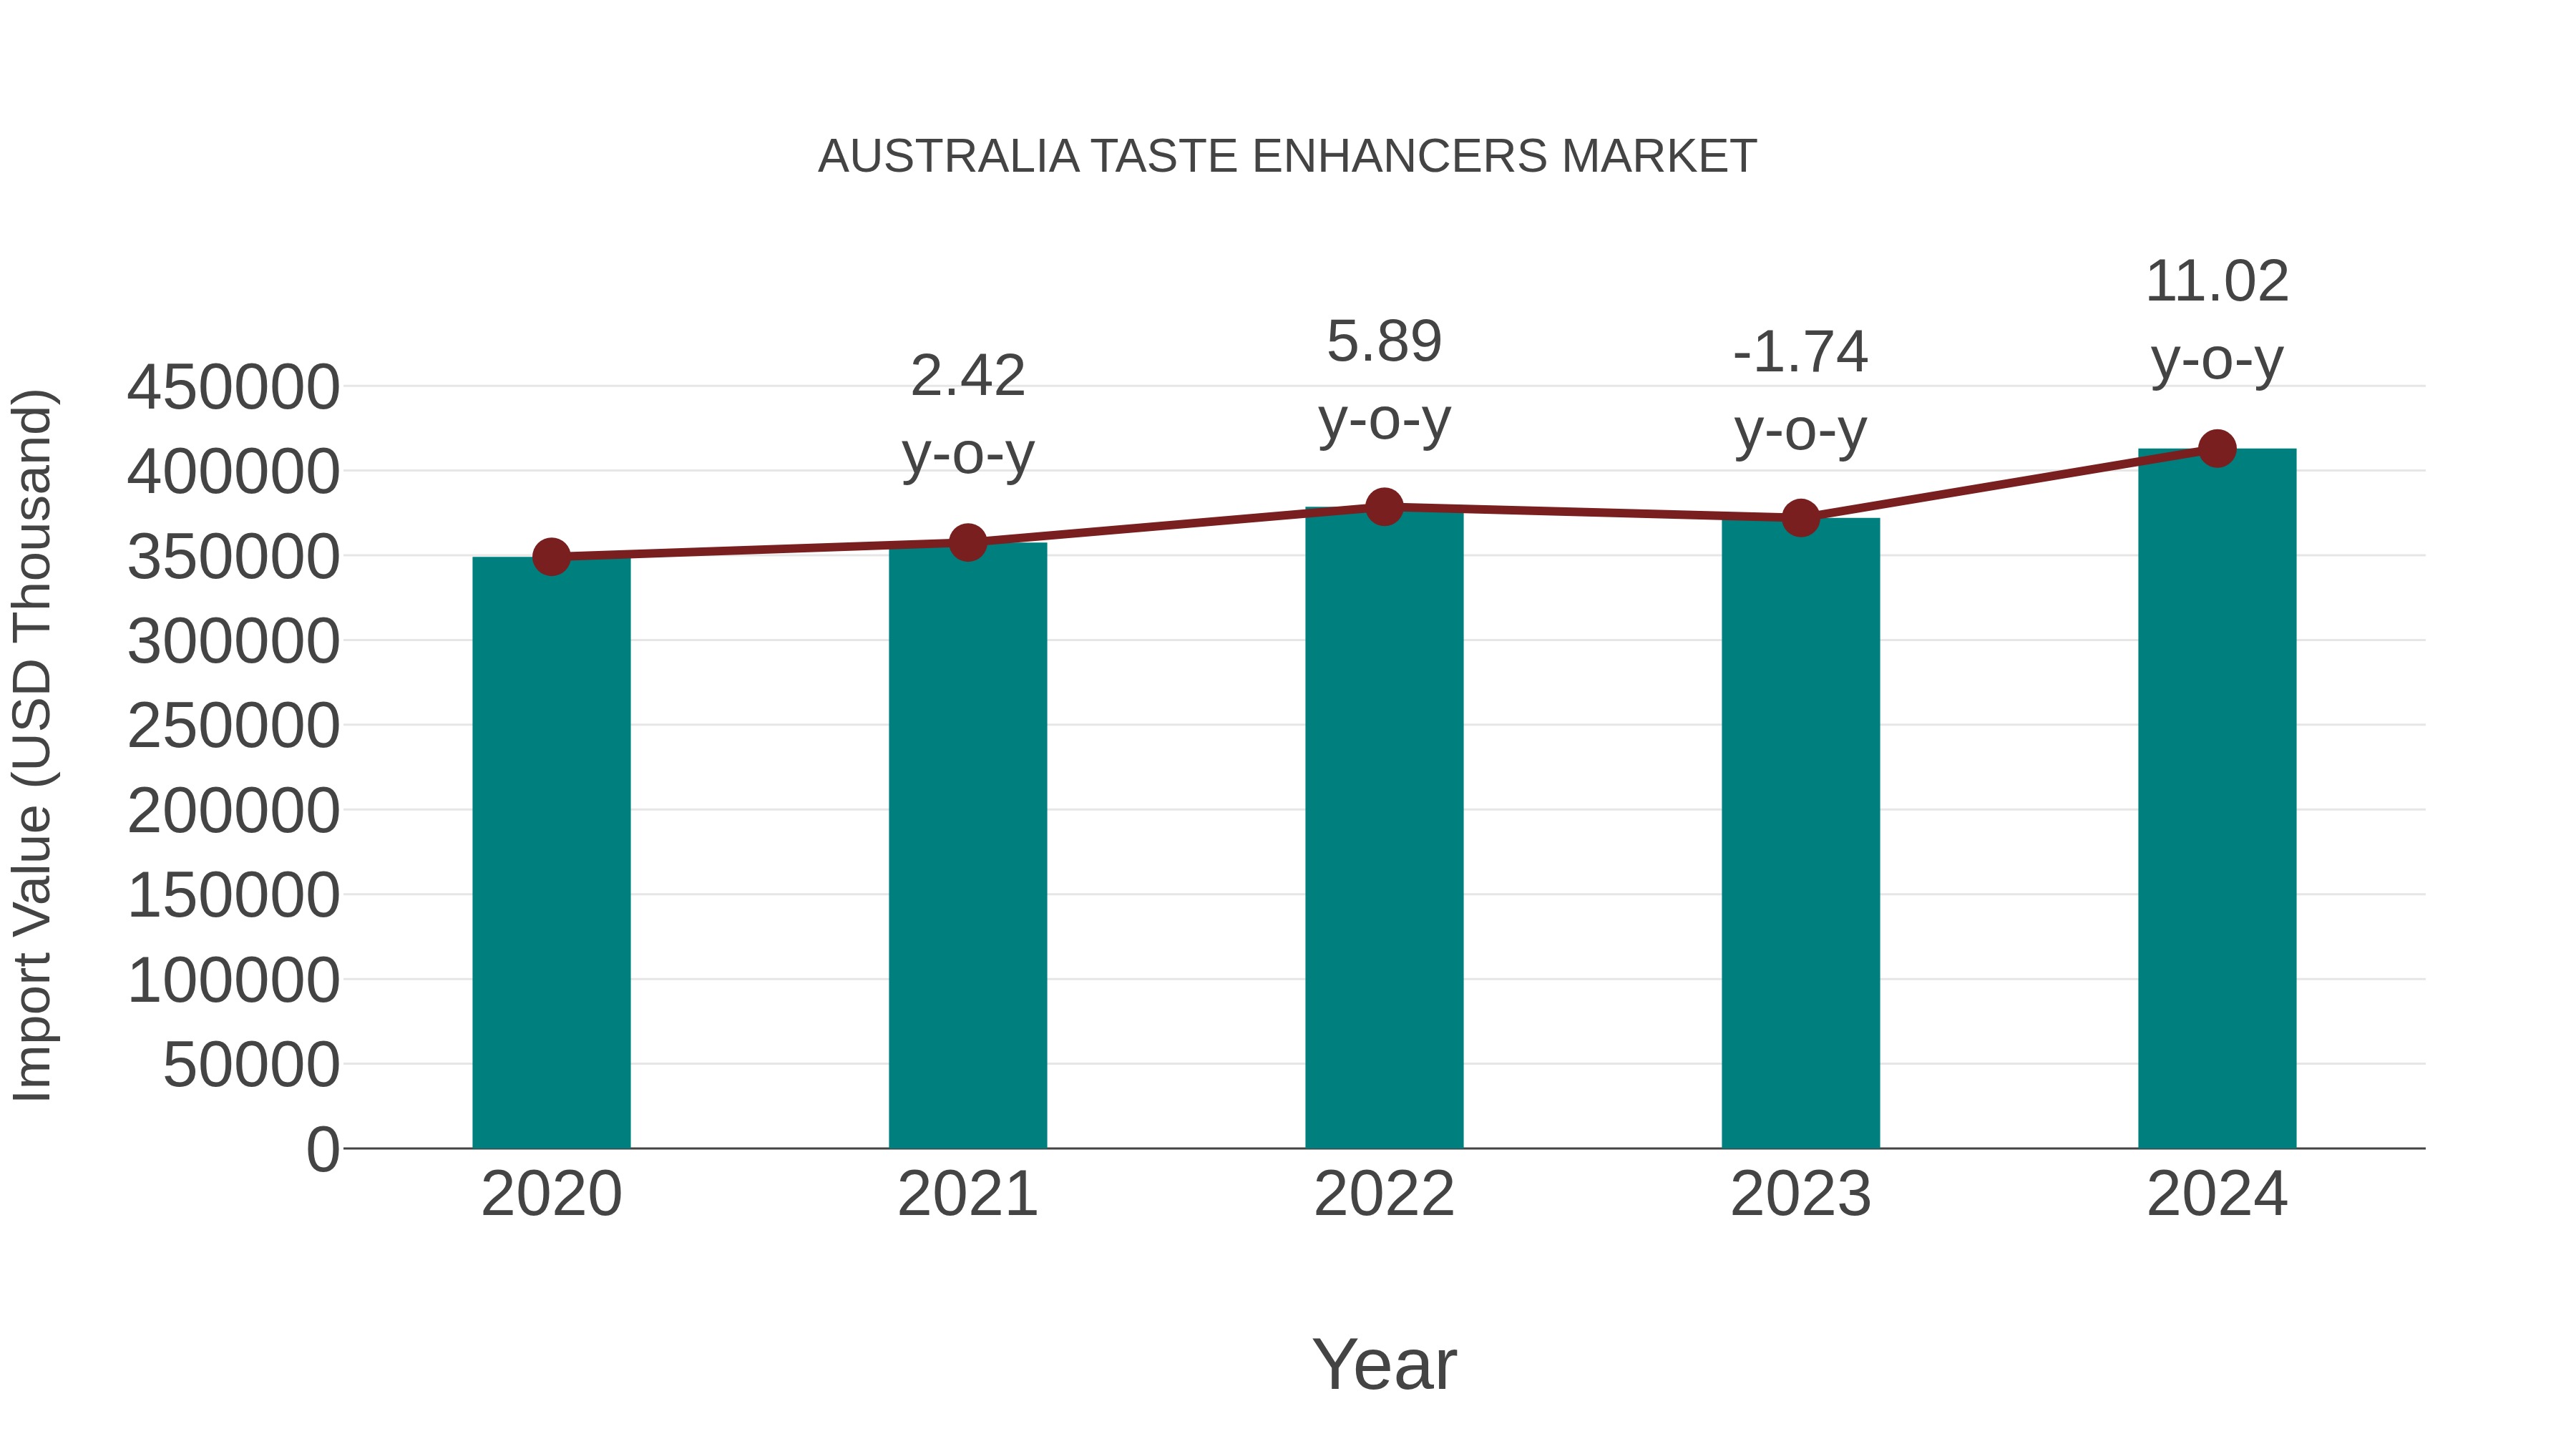
Australia Taste Enhancers Market: Import Trend Analysis
In the Australia taste enhancers market, the import trend showed a notable growth rate of 11.02% from 2023 to 2024, with a compound annual growth rate (CAGR) of 4.29% between 2020 and 2024. This import momentum can be attributed to evolving consumer preferences towards diverse flavors and increased demand for innovative food products.
Australia Taste Enhancers Market Overview
The taste enhancers market in Australia is growing, fueled by food innovation and the need to maintain flavor in low-sodium or reduced-sugar products. Demand is rising across processed food, beverages, and snack industries. Regulatory frameworks by Food Standards Australia New Zealand (FSANZ) govern the use of flavor enhancers, encouraging clean-label and natural alternatives.
Trends of the market
The taste enhancers market in Australia is being shaped by consumer demand for flavorful low-sugar and low-sodium foods. Natural taste enhancers are gaining popularity over synthetic options, fueled by the clean-label movement. The food processing and snack sectors are key contributors to this market`s evolution.
Challenges of the market
The taste enhancers market in Australia faces growing scrutiny over health concerns related to artificial additives and monosodium glutamate (MSG). Consumer preference is shifting towards natural and clean-label products, forcing manufacturers to reformulate their products, which increases costs. Stringent food safety regulations and labeling requirements also pose barriers for innovation and product launches.
Investment opportunities in the Market
In Australia, the taste enhancers market is fueled by consumer preferences for flavorful, processed, and ready-to-eat food. Investment avenues include R&D in natural taste enhancers, clean-label product development, and partnerships with food manufacturers seeking to reduce sodium or sugar while maintaining palatability.
Government Policy of the market
The taste enhancers market is governed by food safety and labelling regulations overseen by Food Standards Australia New Zealand (FSANZ). Policies ensure that only approved additives and enhancers are used in food and beverages. The government also promotes consumer transparency through mandatory labelling laws, which affect product formulation and marketing. Import regulations and tariffs, along with sustainability goals in food processing, further influence this market.
Key Highlights of the Report:
- Australia Taste Enhancers Market Outlook
- Market Size of Australia Taste Enhancers Market, 2025
- Forecast of Australia Taste Enhancers Market, 2032
- Historical Data and Forecast of Australia Taste Enhancers Revenues & Volume for the Period 2022 - 2032F
- Australia Taste Enhancers Market Trend Evolution
- Australia Taste Enhancers Market Drivers and Challenges
- Australia Taste Enhancers Price Trends
- Australia Taste Enhancers Porter's Five Forces
- Australia Taste Enhancers Industry Life Cycle
- Historical Data and Forecast of Australia Taste Enhancers Market Revenues & Volume By Type for the Period 2022 - 2032F
- Historical Data and Forecast of Australia Taste Enhancers Market Revenues & Volume By Sweetness Enhancers for the Period 2022 - 2032F
- Historical Data and Forecast of Australia Taste Enhancers Market Revenues & Volume By Mouthfeel Enhancers for the Period 2022 - 2032F
- Historical Data and Forecast of Australia Taste Enhancers Market Revenues & Volume By Others for the Period 2022 - 2032F
- Historical Data and Forecast of Australia Taste Enhancers Market Revenues & Volume By Application for the Period 2022 - 2032F
- Historical Data and Forecast of Australia Taste Enhancers Market Revenues & Volume By Infant Nutrition Industry for the Period 2022 - 2032F
- Historical Data and Forecast of Australia Taste Enhancers Market Revenues & Volume By Clinical Nutrition Industry for the Period 2022 - 2032F
- Historical Data and Forecast of Australia Taste Enhancers Market Revenues & Volume By Meat Processing Industry for the Period 2022 - 2032F
- Historical Data and Forecast of Australia Taste Enhancers Market Revenues & Volume By Others for the Period 2022 - 2032F
- Australia Taste Enhancers Import Export Trade Statistics
- Market Opportunity Assessment By Type
- Market Opportunity Assessment By Application
- Australia Taste Enhancers Top Companies Market Share
- Australia Taste Enhancers Competitive Benchmarking By Technical and Operational Parameters
- Australia Taste Enhancers Company Profiles
- Australia Taste Enhancers Key Strategic Recommendations
Australia Taste Enhancers Market (2026-2032): FAQs
6Wresearch actively monitors the Australia Taste Enhancers Market and publishes its comprehensive annual report, highlighting emerging trends, growth drivers, revenue analysis, and forecast outlook. Our insights help businesses to make data-backed strategic decisions with ongoing market dynamics. Our analysts track relevent industries related to the Australia Taste Enhancers Market, allowing our clients with actionable intelligence and reliable forecasts tailored to emerging regional needs.
Yes, we provide customisation as per your requirements. To learn more, feel free to contact us on sales@6wresearch.com
1 Executive Summary |
2 Introduction |
2.1 Key Highlights of the Report |
2.2 Report Description |
2.3 Market Scope & Segmentation |
2.4 Research Methodology |
2.5 Assumptions |
3 Australia Taste Enhancers Market Overview |
3.1 Australia Country Macro Economic Indicators |
3.2 Australia Taste Enhancers Market Revenues & Volume, 2022 & 2032F |
3.3 Australia Taste Enhancers Market - Industry Life Cycle |
3.4 Australia Taste Enhancers Market - Porter's Five Forces |
3.5 Australia Taste Enhancers Market Revenues & Volume Share, By Type, 2022 & 2032F |
3.6 Australia Taste Enhancers Market Revenues & Volume Share, By Application, 2022 & 2032F |
4 Australia Taste Enhancers Market Dynamics |
4.1 Impact Analysis |
4.2 Market Drivers |
4.2.1 Increasing consumer demand for flavorful and exotic cuisines |
4.2.2 Growing awareness about the benefits of natural taste enhancers |
4.2.3 Rising disposable income leading to higher spending on convenience food products |
4.3 Market Restraints |
4.3.1 Stringent regulations on the use of artificial taste enhancers |
4.3.2 Health concerns related to the consumption of certain taste enhancers |
5 Australia Taste Enhancers Market Trends |
6 Australia Taste Enhancers Market, By Types |
6.1 Australia Taste Enhancers Market, By Type |
6.1.1 Overview and Analysis |
6.1.2 Australia Taste Enhancers Market Revenues & Volume, By Type, 2022 - 2032F |
6.1.3 Australia Taste Enhancers Market Revenues & Volume, By Sweetness Enhancers, 2022 - 2032F |
6.1.4 Australia Taste Enhancers Market Revenues & Volume, By Mouthfeel Enhancers, 2022 - 2032F |
6.1.5 Australia Taste Enhancers Market Revenues & Volume, By Others, 2022 - 2032F |
6.2 Australia Taste Enhancers Market, By Application |
6.2.1 Overview and Analysis |
6.2.2 Australia Taste Enhancers Market Revenues & Volume, By Infant Nutrition Industry, 2022 - 2032F |
6.2.3 Australia Taste Enhancers Market Revenues & Volume, By Clinical Nutrition Industry, 2022 - 2032F |
6.2.4 Australia Taste Enhancers Market Revenues & Volume, By Meat Processing Industry, 2022 - 2032F |
6.2.5 Australia Taste Enhancers Market Revenues & Volume, By Others, 2022 - 2032F |
7 Australia Taste Enhancers Market Import-Export Trade Statistics |
7.1 Australia Taste Enhancers Market Export to Major Countries |
7.2 Australia Taste Enhancers Market Imports from Major Countries |
8 Australia Taste Enhancers Market Key Performance Indicators |
8.1 Consumer preference shifts towards natural taste enhancers |
8.2 Number of new product launches in the taste enhancers market |
8.3 Adoption rate of innovative taste enhancement technologies |
8.4 Consumer sentiment towards taste enhancers in surveys or feedback |
8.5 Number of collaborations or partnerships between taste enhancer manufacturers and food producers |
9 Australia Taste Enhancers Market - Opportunity Assessment |
9.1 Australia Taste Enhancers Market Opportunity Assessment, By Type, 2022 & 2032F |
9.2 Australia Taste Enhancers Market Opportunity Assessment, By Application, 2022 & 2032F |
10 Australia Taste Enhancers Market - Competitive Landscape |
10.1 Australia Taste Enhancers Market Revenue Share, By Companies, 2025 |
10.2 Australia Taste Enhancers Market Competitive Benchmarking, By Operating and Technical Parameters |
11 Company Profiles |
12 Recommendations |
13 Disclaimer |
Global Go To Market Strategy - 2030
Export potential enables firms to identify high-growth global markets with greater confidence by combining advanced trade intelligence with a structured quantitative methodology. The framework analyzes emerging demand trends and country-level import patterns while integrating macroeconomic and trade datasets such as GDP and population forecasts, bilateral import–export flows, tariff structures, elasticity differentials between developed and developing economies, geographic distance, and import demand projections. Using weighted trade values from 2020–2024 as the base period to project country-to-country export potential for 2030, these inputs are operationalized through calculated drivers such as gravity model parameters, tariff impact factors, and projected GDP per-capita growth. Through an analysis of hidden potentials, demand hotspots, and market conditions that are most favorable to success, this method enables firms to focus on target countries, maximize returns, and global expansion with data, backed by accuracy.
By factoring in the projected importer demand gap that is currently unmet and could be potential opportunity, it identifies the potential for the Exporter (Country) among 190 countries, against the general trade analysis, which identifies the biggest importer or exporter.
To discover high-growth global markets and optimize your business strategy:
Click Here
Pricing
- Single User License$ 1,995
- Department License$ 2,400
- Site License$ 3,120
- Global License$ 3,795

Leadership Perspectives from Industry Events
Search
Thought Leadership and Analyst Meet


Our Clients
6WResearch In News
- India Export Attractiveness Tracker 2026
- India Air Conditioner Market Set for Strong Rebound in 2026 After Weather-Led Correction and GST-Driven Recovery: 6Wresearch
- ADAS in India: How Automatic Emergency Braking, Blind Spot Detection & Driver Monitoring are Transforming Road Safety
- Doha a strategic location for EV manufacturing hub: IPA Qatar
- Demand for luxury TVs surging in the GCC, says Samsung
- Empowering Growth: The Thriving Journey of Bangladesh’s Cable Industry
Latest Reports
- Qatar Access and Home Network Market (2026-2032)
- Nicaragua RPG Gaming Market (2026-2032)
- New Zealand RPG Gaming Market (2026-2032)
- Netherlands RPG Gaming Market (2026-2032)
- Nauru RPG Gaming Market (2026-2032)
- Namibia RPG Gaming Market (2026-2032)
- Mozambique RPG Gaming Market (2026-2032)
- Montenegro RPG Gaming Market (2026-2032)
- Mongolia RPG Gaming Market (2026-2032)
- Monaco RPG Gaming Market (2026-2032)
Industry Events and Analyst Meet

EV India Expo 2026

HIMTEX 2026

India Refining Summit 2026

India EV Show 2026

EV tech India Expo 2026
Whitepaper
- Middle East & Africa Commercial Security Market Click here to view more.
- Middle East & Africa Fire Safety Systems & Equipment Market Click here to view more.
- GCC Drone Market Click here to view more.
- Middle East Lighting Fixture Market Click here to view more.
- GCC Physical & Perimeter Security Market Click here to view more.