Australia Television Market (2025-2031) | Share, Analysis, Revenue, Outlook, Value, Growth, Trends, Industry, Size, Forecast & Companie
Market Forecast By Screen Type (Below 55 inch, 55 to 65 inch, 70 inch and above), By Panel Type (By LED, By OLED, By QLED, By Others), By Resolution (HD TV, FULL HD TV, 4K UHD TV, 8K TV), By End-Use (By Residential, By Commercial), And Competitive Landscape
| Product Code: ETC036655 | Publication Date: Jun 2023 | Updated Date: Aug 2025 | Product Type: Report | |
| Publisher: 6Wresearch | Author: Ravi Bhandari | No. of Pages: 80 | No. of Figures: 29 | No. of Tables: 7 |
Topics Covered in Australia Television Market Report
Australia Television Market Report thoroughly covers the market by screen type, by panel type, by resolution, and by end-use. Australia Television Market Outlook report provides an unbiased and detailed analysis of the ongoing Australia Television Market trends, opportunities/high growth areas, and market drivers. This would help stakeholders devise and align their market strategies according to the current and future market dynamics.
Australia Television Market Synopsis
The Australia Television Market is set to witness steady growth driven by rising smart-TV adoption, increasing digital streaming, and structural developments in both residential and commercial sectors. Smart-TV usage in households grew from 2020 to 2024, while linear and broadcast TV remained widely used, with some internet users continuing to watch traditional TV. The SVOD market expanded rapidly, with major platforms such as Netflix, Amazon Prime Video, Disney+, and Stan increasing content libraries and engagement hours.
Residential construction remains robust, with some numbers of dwellings under construction in the June quarter 2025, and the total value of residential properties increased in June 2025 quarter from June 2024 quarter, directly expanding the installed base of household televisions, providing new households and multi-room layouts that increased installed TVs per dwelling. In the commercial sector, sustained investments in offices, retail, and industrial spaces fueled demand for large-format, commercial-grade TVs and digital signage, laying the foundation for long-term market expansion.
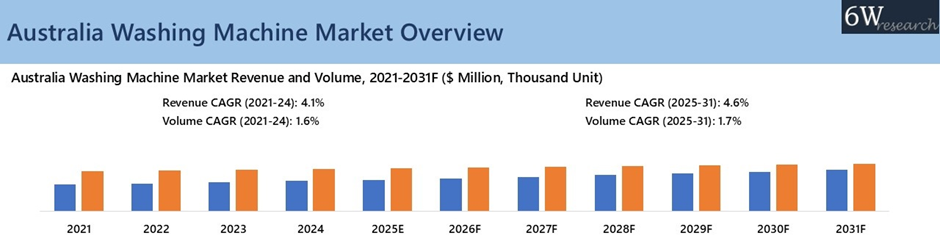
According to 6Wresearch, Australia Television Market is projected to grow at a CAGR of 6.5% by revenue and 3.8% by volume respectively during 2025-2031. Total households are projected to rise from 2021 to 2046, expanding the base of potential home television consumers. SVOD penetration continues to grow, with some households holding at least one subscription and total services reaching high. The hospitality and tourism rebound adds another layer of demand, with outbound travel increasing the travelers and domestic/inbound tourism spend rising. Commercial real estate investments, particularly in offices, retail, and industrial & logistics, further drive the need for large-format, commercial-grade televisions and digital signage. Combined, these trends position the Australian TV market for sustained growth, with rising demand across residential, hospitality, and commercial segments.
Market Segmentation By Screen Type
55 to 65 inch is expected to be the highest volume-generating segment (2025-2031) due to consumers shift from mid-size upgrades to even larger screens. Growth drivers would include secondary room installations, rentals and compact living spaces where large-format adoption becomes viable. However, 70 inch and above is expected to be the highest revenue generating and fastest-growing segment (2025-2031) as households would increasingly prioritise immersive viewing in living rooms and entertainment zones. The rise in multi-purpose spaces and streaming-native large-format content would make oversized screens the standard, rather than a premium niche.
Market Segmentation By Panel Type
LED panels are projected to record the largest revenue share in Australia television market by 2031, driven by their scalability, lower cost-base, and consistent integration into high-volume models. As manufacturing efficiencies improve and global supply chains stabilise, LED would become the value backbone for consumer uptake. However, OLED panels are projected to be the fastest growing between the period 2025 and 2031, driven by technology maturation, falling unit costs, and expanding screen sizes. As consumers demand superior contrast, ultra-thin form factors and premium lifestyles, OLED would accelerate growth relative to other panel types.
Market Segmentation By Resolution Type
4K UHD TV is expected to continue to dominate revenue share and is expected to experience fastest growth rate for the period 2025 and 2031, as streaming platforms, gaming consoles and broadcast services converge on 4K as baseline experience. With 8K still premium and largely niche, 4K would anchor the mainstream segment and attract continued upgrades. Falling panel costs and wider availability of large-screen models would further reinforce 4K adoption across both residential and commercial households.
Market Segmentation By End-User
Residential end-use is projected to record the largest revenue share in Australia television market by 2031, as smart TV penetration, multi-device households and streaming-first lifestyles would drive demand. With more dwellings and rising lone-person households, residential setups would increasingly feature multiple screens and premium models. However, commercial end-use is projected to be the fastest growing between the period 2025 and 2031, as offices, hospitality, retail and public venues increasingly adopt large-format, high-performance displays. The shift toward digital signage, hybrid workspaces, and integrated entertainment would push commercial-based TV installs at a faster pace.
Key Attractiveness of the Report
- 10 Years Market Numbers.
- Historical Data Starting from 2021 to 2024
- Base Year: 2024
- Forecast Data until 2031
- Key Performance Indicators Impacting the Market.
- Major Upcoming Developments and Projects.
Key Highlights of the Report:
- Australia Television Market Overview
- Australia Television Market Outlook
- Australia Television Market Forecast
- Historical Data and Forecast of Australia Television Market Revenues for the Period 2021-2031F
- Historical Data and Forecast of Australia Television Market Revenues and Volume, By Screen Type, for the Period 2021-2031F
- Historical Data and Forecast of Australia Television Market Revenues, By Panel Type, for the Period 2021-2031F
- Historical Data and Forecast of Australia Television Market Revenues, By Resolution, for the Period 2021-2031F
- Historical Data and Forecast of Australia Television Market Revenues, By End Use, for the Period 2021-2031F
- Industry Life Cycle
- Porter’s Five Force Analysis
- Australia Television Market Drivers and Restraints
- Market Trends & Evolution
- Market Opportunity Assessment
- Australia Television Market Revenue Ranking, By Top 3 Companies
- Competitive Benchmarking
- Company Profiles
- Key Strategic Recommendations
Market Scope and Segmentation
The report provides a detailed analysis of the following market segments:
By Screen Type
- Below 55 inch
- 55 to 65 inch
- 70 inch and above
By Panel Type
- By LED
- By OLED
- By QLED
- By Others
By Resolution
- HD TV
- FULL HD TV
- 4K UHD TV
- 8K TV
By End-Use
- By Residential
- By Commercial
Australia Television market report (2025-2031): FAQs
Australia Television Market is projected to grow at a CAGR of 6.5% by revenue and 3.8% by volume respectively during 2025-2031.
Growth in Smart TV Adoption and Internet Penetration and Rising Demand from Online Streaming are driving the growth of market.
The market faces restraints due to Delayed Replacements and Heavy Reliance on Imports.
Australia Television Market Report thoroughly covers the market by screen type, by panel type, by resolution, and by end-use.
6Wresearch actively monitors the Australia Television Market and publishes its comprehensive annual report, highlighting emerging trends, growth drivers, revenue analysis, and forecast outlook. Our insights help businesses to make data-backed strategic decisions with ongoing market dynamics. Our analysts track relevent industries related to the Australia Television Market, allowing our clients with actionable intelligence and reliable forecasts tailored to emerging regional needs.
Yes, we provide customisation as per your requirements. To learn more, feel free to contact us on sales@6wresearch.com
| 1. Executive Summary |
| 2. Introduction |
| 2.1. Report Description |
| 2.2. Key Highlights of the Report |
| 2.3. Market Scope & Segmentation |
| 2.4. Research Methodology |
| 2.5. Assumptions |
| 3. Global Television Market Overview |
| 3.1. Global Television Market Revenues, 2021-2031F |
| 4. Australia Television Market Overview |
| 4.1. Australia Macroeconomic Indicators |
| 4.2. Australia Television Market Volume and Revenues, 2021-2031F |
| 4.4. Australia Television Market Industry Life Cycle |
| 4.4. Australia Television Market Porter's Five Forces |
| 5. Australia Television Market Dynamics |
| 5.1. Impact Analysis |
| 5.2. Market Drivers |
| 5.3. Market Restraints |
| 6. Australia Television Market Trends and Evolution |
| 7. Australia Television Market Overview, By Screen Type |
| 7.1. Australia Television Market Revenue Share and Volume Share, By Screen Type, 2021 & 2031F |
| 7.2. Australia Television Market Revenues and Volume, By Screen Type, 2021-2031F |
| 7.2.1 Australia Television Market Revenues and Volume, By 55-65 Inch, 2021-2031F |
| 7.2.2 Australia Television Market Revenues and Volume, By 55-65 Inch, 2021-2031F |
| 7.2.3 Australia Television Market Revenues and Volume, By 70 Inch and Above, 2021-2031F |
| 8. Australia Television Market Overview, By Panel Type |
| 8.1. Australia Television Market Revenue Share, By Panel Type, 2021 & 2031F |
| 8.1.1 Australia Television Market Revenues, By LED, 2021-2031F |
| 8.1.2 Australia Television Market Revenues, By OLED, 2021-2031F |
| 8.1.3 Australia Television Market Revenues, By QLED, 2021-2031F |
| 8.1.4 Australia Television Market Revenues, By Others, 2021-2031F |
| 9. Australia Television Market Overview, By Resolution Type |
| 9.1. Australia Television Market Revenue Share, By Resolution Type, 2021 & 2031F |
| 9.1.1 Australia Television Market Revenues, By HD TV, 2021-2031F |
| 9.1.2 Australia Television Market Revenues, By Full HD TV, 2021-2031F |
| 9.1.3 Australia Television Market Revenues, By 4K UHD TV, 2021-2031F |
| 9.1.4 Australia Television Market Revenues, By 8K TV, 2021-2031F |
| 10. Australia Television Market Overview, By End Use |
| 10.1. Australia Television Market Revenue Share, By End User, 2021 & 2031F |
| 10.1.1 Australia Television Market Revenues, By Residential, 2021-2031F |
| 10.1.2 Australia Television Market Revenues, By Commercial, 2021-2031F |
| 11. Australia Television Market Key Performance Indicators |
| 12. Australia Television Market Regulatory Landscape |
| 13. Australia Television Market Opportunity Assessment |
| 13.1. Australia Television Market Opportunity Assessment, By Screen Type, 2031F |
| 13.2. Australia Television Market Opportunity Assessment, By Panel Type, 2031F |
| 13.3. Australia Television Market Opportunity Assessment, By Resolution Type, 2031F |
| 13.4. Australia Television Market Opportunity Assessment, By End Use, 2031F |
| 14. Australia Television Market Competitive Landscape |
| 14.1. Australia Television Market Revenue Ranking By Top 3 Companies, 2024 |
| 14.2. Australia Television Market Competitive Benchmarking, By Technical Parameters |
| 14.3. Australia Television Market Competitive Benchmarking, By Operating Parameters |
| 15. Company Profiles |
| 15.1. Samsung Electronics Australia Pty. Ltd. |
| 15.2. LG Electronics Australia |
| 15.3. Sony Australia |
| 15.4. Hisense Group Co., Ltd |
| 15.5. Sichuan Changhong Electric Co., Ltd. |
| 15.6. Panasonic Holdings Corp. |
| 15.7. TCL Australia Pty Ltd. |
| 15.8. Philips Electronics Australia Limited |
| 15.9. Sharp Corporation of Australia Pty. Ltd. |
| 15.10. JVC Australia Pty Ltd |
| 16. Key Strategic Recommendations |
| 17. Disclaimer |
| List of figures |
| 1. Global Television Market Revenues, 2021-2031F (US$ Billion) |
| 2. Australia Real GDP Growth , Y-O-Y Change, 2021-2025E, (%) |
| 3. Australia Inflation Rate (Average Consumer Prices, Y-O-Y Change 2021-2025E, (in %) |
| 4. Australia GDP Per Capita, Current Prices (U.S. Dollars Per Capita), 2021-2030F |
| 5. Australia Television Market Revenues and Volume, 2021-2031F (USD Million, Million Units) |
| 6. Percentage of Internet Users owning TV Streaming Device in Australia, 2024 and 2025 (in %) |
| 7. Australia Internet Penetration Rate, 2022-2025, (in %) |
| 8. Percentage of Internet Users above Age 16 Watching Linear and Broadcast TV in Australia, 2024 and 2025 (in %) |
| 9. Share of Television Ownership in Australia, June 2023 and June 2024 and 2025 (in %) |
| 10. Australia SVOD Market Including Paid and Non-Paid Subscriptions, as of June 2025, (in Million) |
| 11. Australian General Subscription TV and SVOD Drama Spend, 2020-2024, (AU$ Million) |
| 12. Australia Television Market Revenue Share, By Screen Type, 2024 & 2031F |
| 13. Australia Television Market Volume Share, By Screen Type, 2024 & 2031F |
| 14. Australia Television Market Revenue Share, By Panel Type, 2024 & 2031F |
| 15. Australia Television Market Revenue Share, By Resolution Type, 2024 & 2031F |
| 16. Australia Television Market Revenue Share, By End-Use, 2024 & 2031F |
| 17. Australia Value of Dwelling Stock Owned by Household, by Region, as of June 2025, (in AU$ Billion) |
| 18. Total Number of Households in Australia, 2021 & 2046F, (Million) |
| 19. Share of Offshore Investment by Sector in Australia, 2024, (in %) |
| 20. New Hotel Rooms Under Construction in Australia, 2025 |
| 21. Commercial Sector Investment Volume in Australia, 2024 (AU$ Billion) |
| 22. Demand & Supply of Accommodation in Australia, By Accommodation Type, 2024-2025, (Million) |
| 23. Demand & Supply of Accommodation in Australia, By States & Territories, 2024-2025, (Million) |
| 24. Australia Television Market Opportunity Assessment, By Screen Type, Revenue Outlook 2031F |
| 25. Australia Television Market Opportunity Assessment, By Panel Type, Revenue Outlook 2031F |
| 26. Australia Television Market Opportunity Assessment, By Resolution Type, Revenue Outlook 2031F |
| 27. Australia Television Market Opportunity Assessment, By End-Use, Revenue Outlook 2031F |
| 28. Australia Television Market Revenue Ranking By Top 3 Companies, 2024 |
| 29. Australia Year-on-Year Increase in Smart-TV and Regional Streaming Behaviors, June 2023 and June 2024, (in %) |
| List of table |
| 1. Australia Television Market Revenues, By Screen Type, 2021-2031F ($ Million) |
| 2. Australia Television Market Volume, By Screen Type, 2021-2031F (Thousand Units) |
| 3. Australia Television Market Revenues, By Panel Type, 2021-2031F, ($ Million) |
| 4. Australia Television Market Revenues, By Resolution Type, 2021-2031F, ($ Million) |
| 5. Australia Television Market Revenues, By End-Use Type, 2021-2031F, ($ Million) |
| 6. Major Upcoming and Ongoing Residential Projects in Australia |
| 7. Key Count Across Major Australian Hotels |
Global Go To Market Strategy - 2030
Export potential enables firms to identify high-growth global markets with greater confidence by combining advanced trade intelligence with a structured quantitative methodology. The framework analyzes emerging demand trends and country-level import patterns while integrating macroeconomic and trade datasets such as GDP and population forecasts, bilateral import–export flows, tariff structures, elasticity differentials between developed and developing economies, geographic distance, and import demand projections. Using weighted trade values from 2020–2024 as the base period to project country-to-country export potential for 2030, these inputs are operationalized through calculated drivers such as gravity model parameters, tariff impact factors, and projected GDP per-capita growth. Through an analysis of hidden potentials, demand hotspots, and market conditions that are most favorable to success, this method enables firms to focus on target countries, maximize returns, and global expansion with data, backed by accuracy.
By factoring in the projected importer demand gap that is currently unmet and could be potential opportunity, it identifies the potential for the Exporter (Country) among 190 countries, against the general trade analysis, which identifies the biggest importer or exporter.
To discover high-growth global markets and optimize your business strategy:
Click Here
Pricing
- Single User License$ 1,995
- Department License$ 2,400
- Site License$ 3,120
- Global License$ 3,795

Leadership Perspectives from Industry Events
Search
Thought Leadership and Analyst Meet


Our Clients
6WResearch In News
- India Air Conditioner Market Set for Strong Rebound in 2026 After Weather-Led Correction and GST-Driven Recovery: 6Wresearch
- ADAS in India: How Automatic Emergency Braking, Blind Spot Detection & Driver Monitoring are Transforming Road Safety
- Doha a strategic location for EV manufacturing hub: IPA Qatar
- Demand for luxury TVs surging in the GCC, says Samsung
- Empowering Growth: The Thriving Journey of Bangladesh’s Cable Industry
- Demand for luxury TVs surging in the GCC, says Samsung
Latest Reports
- Poland Fire Protection Systems Market (2026-2032)
- Cape Verde Portable Hand-Thrown Extinguisher Market (2026-2032)
- Canada Portable Hand-Thrown Extinguisher Market (2026-2032)
- Cameroon Portable Hand-Thrown Extinguisher Market (2026-2032)
- Burundi Portable Hand-Thrown Extinguisher Market (2026-2032)
- Burkina Faso Portable Hand-Thrown Extinguisher Market (2026-2032)
- Bulgaria Portable Hand-Thrown Extinguisher Market (2026-2032)
- Brunei Portable Hand-Thrown Extinguisher Market (2026-2032)
- Botswana Portable Hand-Thrown Extinguisher Market (2026-2032)
- Bosnia and Herzegovina Portable Hand-Thrown Extinguisher Market (2026-2032)
Industry Events and Analyst Meet

HIMTEX 2026

India Refining Summit 2026

India EV Show 2026

EV tech India Expo 2026

Auto Tech Asia 2026
Whitepaper
- Middle East & Africa Commercial Security Market Click here to view more.
- Middle East & Africa Fire Safety Systems & Equipment Market Click here to view more.
- GCC Drone Market Click here to view more.
- Middle East Lighting Fixture Market Click here to view more.
- GCC Physical & Perimeter Security Market Click here to view more.