Australia Threonine Acid Market (2026-2032) | Outlook, Segmentation, Companies, Growth, Forecast, Trends, Size & Revenue, Value, Analysis, Industry, Share, Competitive Landscape
Market Forecast By Type (Animal Based Threonine Acid, Plant Based Threonine Acid), By Application (Food & Dietary Supplements, Animal Feed, Pharmaceuticals, Others) And Competitive Landscape
| Product Code: ETC6192842 | Publication Date: Sep 2024 | Updated Date: Mar 2026 | Product Type: Market Research Report | |
| Publisher: 6Wresearch | Author: Sachin Kumar Rai | No. of Pages: 75 | No. of Figures: 35 | No. of Tables: 20 |
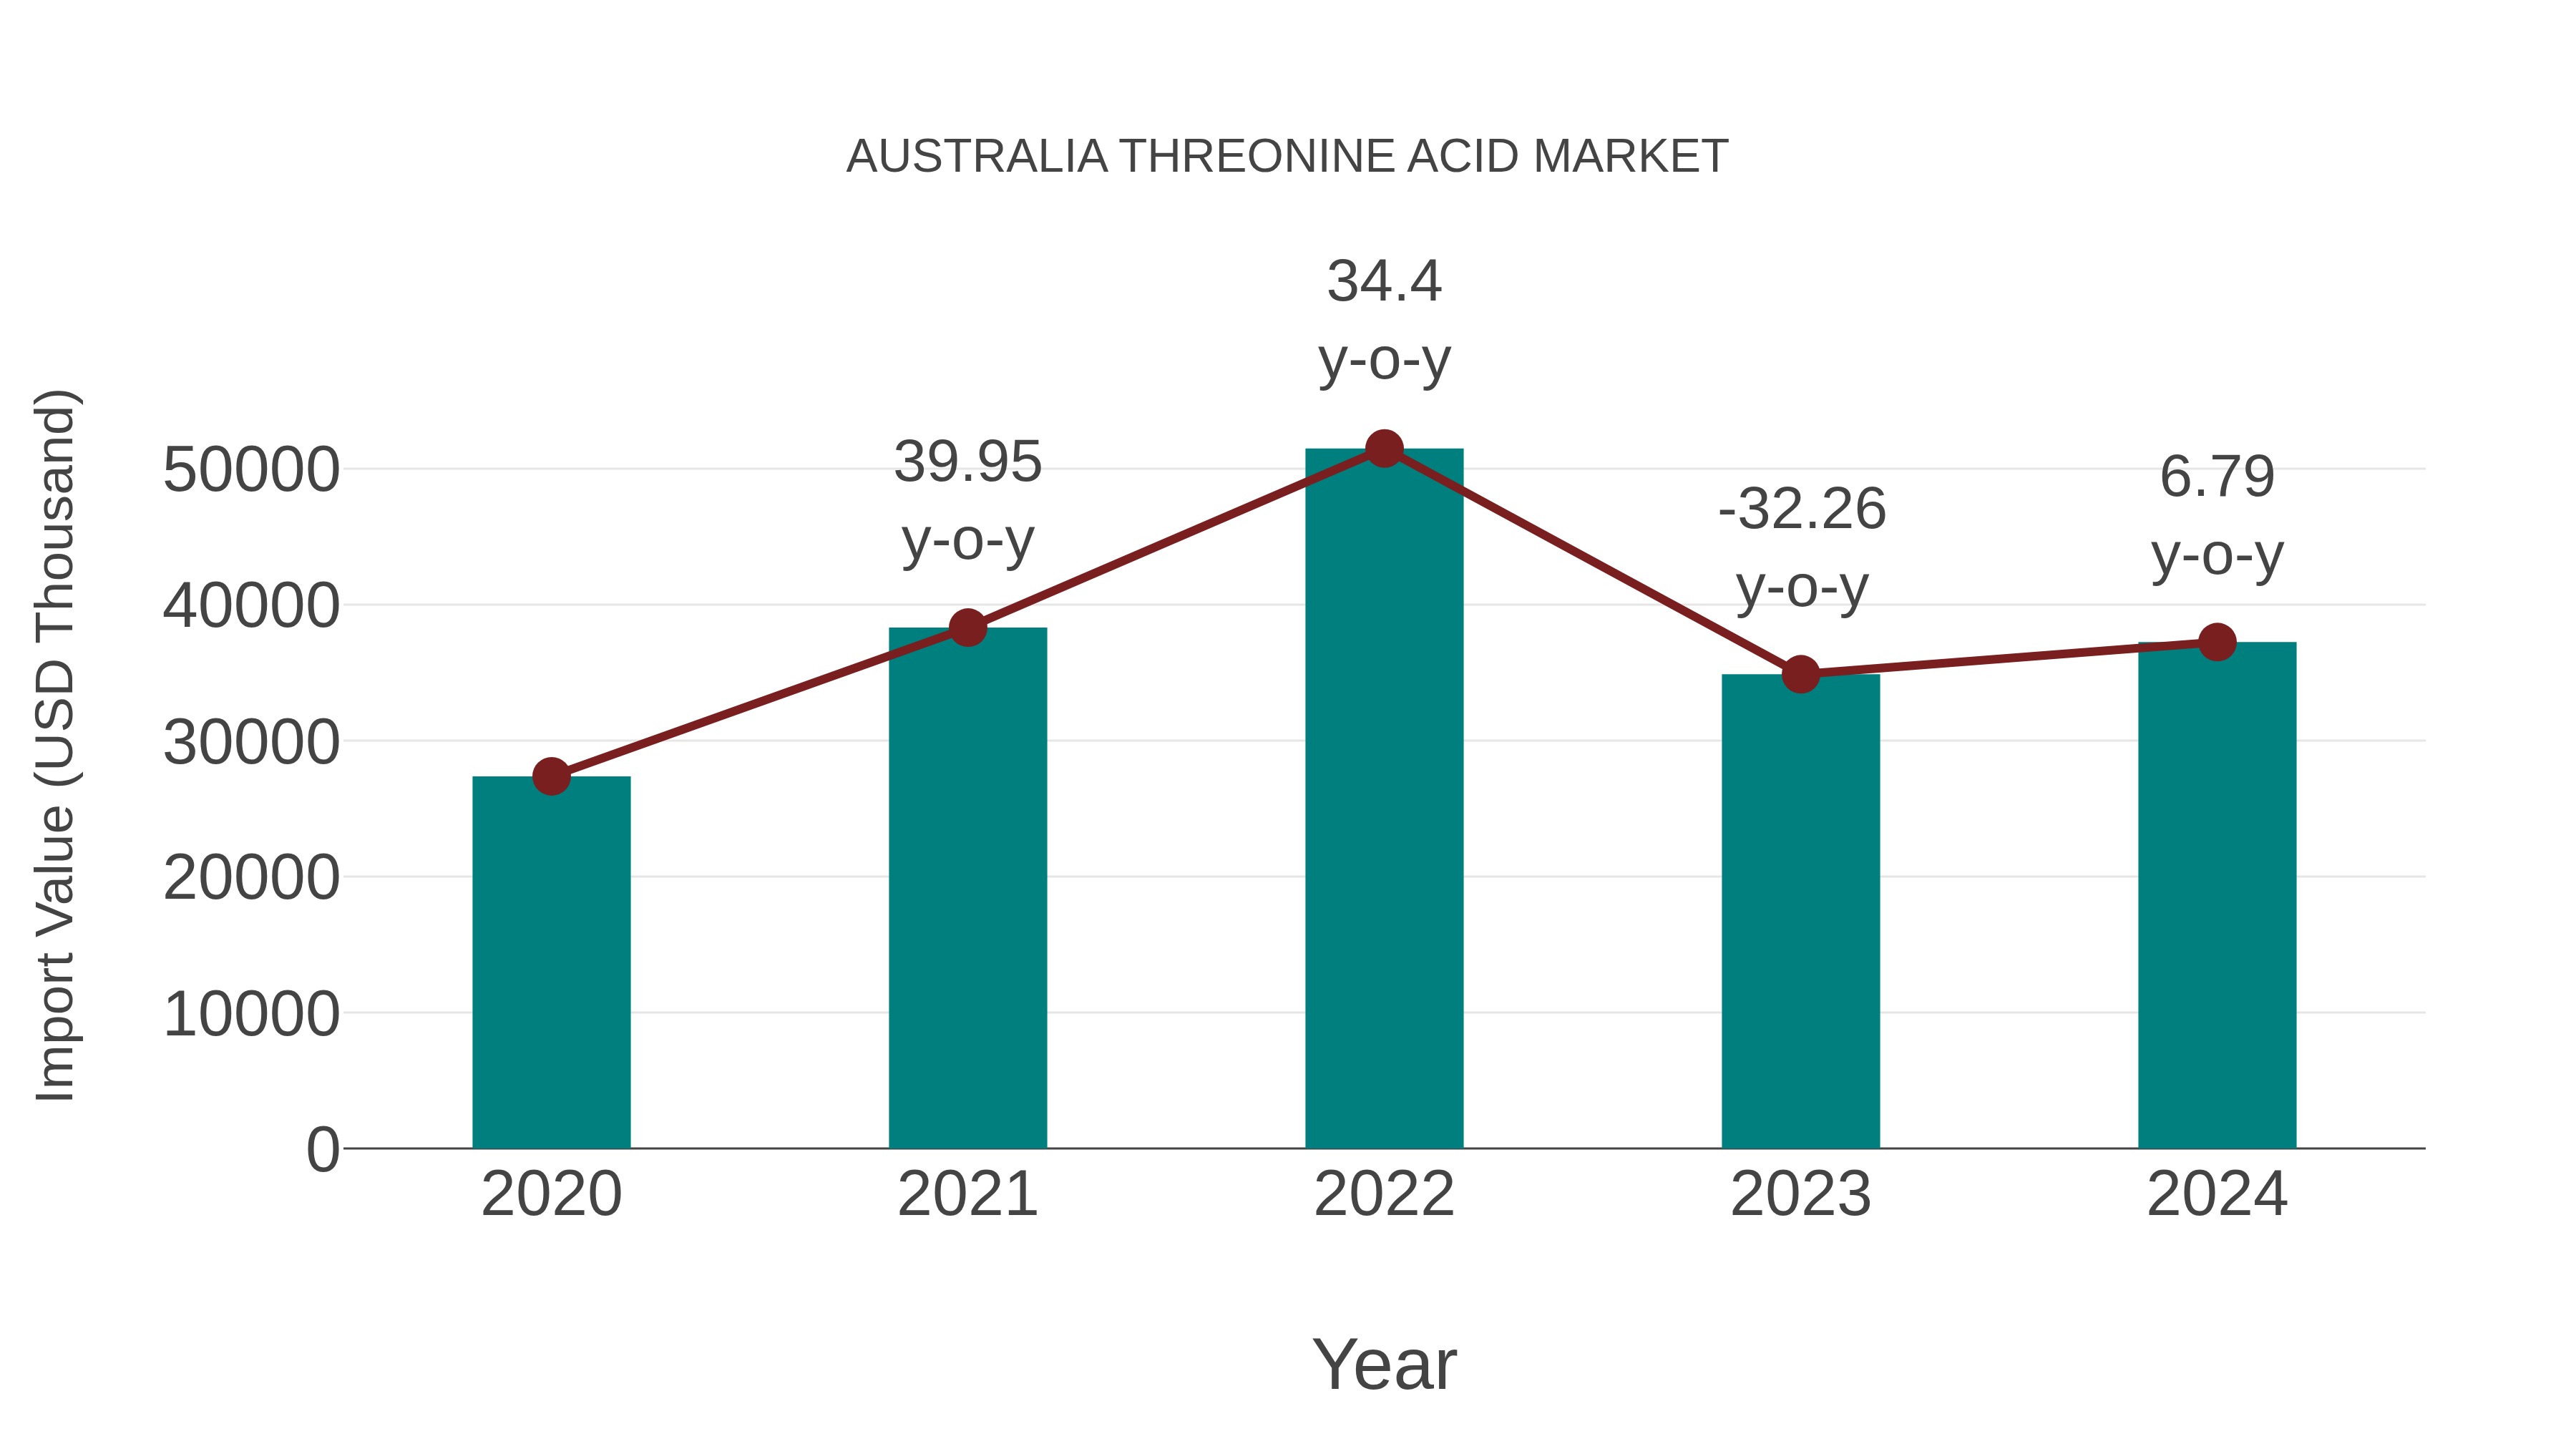
Australia Threonine Acid Market: Import Trend Analysis
In the Australia threonine acid market, the import trend showed a growth rate of 6.79% from 2023 to 2024, with a compound annual growth rate (CAGR) of 8.0% from 2020 to 2024. This increase in import momentum can be attributed to a notable demand shift towards quality amino acids in the market, reflecting a stable and growing market environment during the period.
Australia Threonine Acid Market Overview
The threonine acid market in Australia is mainly driven by demand in animal feed, pharmaceuticals, and dietary supplements. As an essential amino acid, threonine plays a crucial role in protein metabolism and gut health, especially in livestock. With the growth of the meat and dairy industries, threonine is increasingly being used to optimize animal nutrition. In human health, its application in clinical nutrition and wellness products is also gaining traction. Australia`s biotech and chemical manufacturing sectors are investing in amino acid fermentation and production. Regulatory support for feed additives and nutritional products aids market stability and expansion.
Trends of the market
The threonine acid market in Australia is growing due to the rising demand for amino acids in the feed and food industries. Threonine is an essential amino acid that plays a key role in protein synthesis and is vital for the health and growth of animals, particularly in poultry, swine, and aquaculture. As the demand for animal protein increases globally, the need for high-quality threonine in animal feed formulations is on the rise. Furthermore, threonine is also used in human nutrition products, including dietary supplements and functional foods. The Australian market for threonine acid is being influenced by trends in both the agriculture and nutrition sectors, with an emphasis on improving animal feed efficiency and promoting health-conscious food choices.
Challenges of the market
The threonine acid market in Australia faces challenges due to dependency on imports for raw materials. Fluctuating global prices and trade disruptions directly impact supply chain stability. Adoption rates are inconsistent across industries, particularly in animal feed and pharmaceuticals. Environmental regulations about synthetic amino acid production add compliance costs. Smaller manufacturers struggle to maintain profitability amidst price competition. Moreover, research into more sustainable threonine production methods demands significant investment.
Investment opportunities in the Market
The threonine acid market in Australia benefits from its applications in animal feed, pharmaceuticals, and dietary supplements. With the countrys strong livestock sector and demand for efficient feed additives, threonine sees steady industrial use. Investors can target production facilities, regional distribution, and partnerships with feed manufacturers. Market growth is also influenced by trends in personalized nutrition and clean-label supplements. As a value-added amino acid, threonines diversified applications offer a stable platform for long-term investments.
Government Policy of the market
Threonine, an essential amino acid used in animal feed and pharmaceuticals, is subject to import regulations and quality standards enforced by the Australian Pesticides and Veterinary Medicines Authority (APVMA) and the Department of Agriculture. All feed-grade threonine products must meet strict biosecurity and safety standards to protect Australias agricultural industry. The governments support for the livestock and poultry sectors encourages the use of nutritional additives like threonine to improve animal growth and health. Importers must comply with quarantine regulations and provide detailed chemical composition records. Domestic manufacturing is incentivized under Australian agribusiness development programs, which support localized amino acid production for greater self-reliance. Environmental regulations also affect the market, particularly regarding waste management in feed manufacturing facilities.
Key Highlights of the Report:
- Australia Threonine Acid Market Outlook
- Market Size of Australia Threonine Acid Market, 2025
- Forecast of Australia Threonine Acid Market, 2032
- Historical Data and Forecast of Australia Threonine Acid Revenues & Volume for the Period 2022 - 2032F
- Australia Threonine Acid Market Trend Evolution
- Australia Threonine Acid Market Drivers and Challenges
- Australia Threonine Acid Price Trends
- Australia Threonine Acid Porter's Five Forces
- Australia Threonine Acid Industry Life Cycle
- Historical Data and Forecast of Australia Threonine Acid Market Revenues & Volume By Type for the Period 2022 - 2032F
- Historical Data and Forecast of Australia Threonine Acid Market Revenues & Volume By Animal Based Threonine Acid for the Period 2022 - 2032F
- Historical Data and Forecast of Australia Threonine Acid Market Revenues & Volume By Plant Based Threonine Acid for the Period 2022 - 2032F
- Historical Data and Forecast of Australia Threonine Acid Market Revenues & Volume By Application for the Period 2022 - 2032F
- Historical Data and Forecast of Australia Threonine Acid Market Revenues & Volume By Food & Dietary Supplements for the Period 2022 - 2032F
- Historical Data and Forecast of Australia Threonine Acid Market Revenues & Volume By Animal Feed for the Period 2022 - 2032F
- Historical Data and Forecast of Australia Threonine Acid Market Revenues & Volume By Pharmaceuticals for the Period 2022 - 2032F
- Historical Data and Forecast of Australia Threonine Acid Market Revenues & Volume By Others for the Period 2022 - 2032F
- Australia Threonine Acid Import Export Trade Statistics
- Market Opportunity Assessment By Type
- Market Opportunity Assessment By Application
- Australia Threonine Acid Top Companies Market Share
- Australia Threonine Acid Competitive Benchmarking By Technical and Operational Parameters
- Australia Threonine Acid Company Profiles
- Australia Threonine Acid Key Strategic Recommendations
Australia Threonine Acid Market (2026-2032): FAQs
6Wresearch actively monitors the Australia Threonine Acid Market and publishes its comprehensive annual report, highlighting emerging trends, growth drivers, revenue analysis, and forecast outlook. Our insights help businesses to make data-backed strategic decisions with ongoing market dynamics. Our analysts track relevent industries related to the Australia Threonine Acid Market, allowing our clients with actionable intelligence and reliable forecasts tailored to emerging regional needs.
Yes, we provide customisation as per your requirements. To learn more, feel free to contact us on sales@6wresearch.com
1 Executive Summary |
2 Introduction |
2.1 Key Highlights of the Report |
2.2 Report Description |
2.3 Market Scope & Segmentation |
2.4 Research Methodology |
2.5 Assumptions |
3 Australia Threonine Acid Market Overview |
3.1 Australia Country Macro Economic Indicators |
3.2 Australia Threonine Acid Market Revenues & Volume, 2022 & 2032F |
3.3 Australia Threonine Acid Market - Industry Life Cycle |
3.4 Australia Threonine Acid Market - Porter's Five Forces |
3.5 Australia Threonine Acid Market Revenues & Volume Share, By Type, 2022 & 2032F |
3.6 Australia Threonine Acid Market Revenues & Volume Share, By Application, 2022 & 2032F |
4 Australia Threonine Acid Market Dynamics |
4.1 Impact Analysis |
4.2 Market Drivers |
4.2.1 Increasing demand for animal feed additives to improve livestock health and productivity |
4.2.2 Growing awareness about the benefits of threonine acid in animal nutrition |
4.2.3 Expansion of the livestock industry in Australia |
4.3 Market Restraints |
4.3.1 Fluctuating prices of raw materials used in threonine acid production |
4.3.2 Stringent regulations related to the use of feed additives in livestock farming |
5 Australia Threonine Acid Market Trends |
6 Australia Threonine Acid Market, By Types |
6.1 Australia Threonine Acid Market, By Type |
6.1.1 Overview and Analysis |
6.1.2 Australia Threonine Acid Market Revenues & Volume, By Type, 2022 - 2032F |
6.1.3 Australia Threonine Acid Market Revenues & Volume, By Animal Based Threonine Acid, 2022 - 2032F |
6.1.4 Australia Threonine Acid Market Revenues & Volume, By Plant Based Threonine Acid, 2022 - 2032F |
6.2 Australia Threonine Acid Market, By Application |
6.2.1 Overview and Analysis |
6.2.2 Australia Threonine Acid Market Revenues & Volume, By Food & Dietary Supplements, 2022 - 2032F |
6.2.3 Australia Threonine Acid Market Revenues & Volume, By Animal Feed, 2022 - 2032F |
6.2.4 Australia Threonine Acid Market Revenues & Volume, By Pharmaceuticals, 2022 - 2032F |
6.2.5 Australia Threonine Acid Market Revenues & Volume, By Others, 2022 - 2032F |
7 Australia Threonine Acid Market Import-Export Trade Statistics |
7.1 Australia Threonine Acid Market Export to Major Countries |
7.2 Australia Threonine Acid Market Imports from Major Countries |
8 Australia Threonine Acid Market Key Performance Indicators |
8.1 Adoption rate of threonine acid in livestock feed formulations |
8.2 Number of research studies supporting the efficacy of threonine acid in animal nutrition |
8.3 Investment in RD for developing innovative threonine acid products |
9 Australia Threonine Acid Market - Opportunity Assessment |
9.1 Australia Threonine Acid Market Opportunity Assessment, By Type, 2022 & 2032F |
9.2 Australia Threonine Acid Market Opportunity Assessment, By Application, 2022 & 2032F |
10 Australia Threonine Acid Market - Competitive Landscape |
10.1 Australia Threonine Acid Market Revenue Share, By Companies, 2025 |
10.2 Australia Threonine Acid Market Competitive Benchmarking, By Operating and Technical Parameters |
11 Company Profiles |
12 Recommendations |
13 Disclaimer |
Global Go To Market Strategy - 2030
Export potential enables firms to identify high-growth global markets with greater confidence by combining advanced trade intelligence with a structured quantitative methodology. The framework analyzes emerging demand trends and country-level import patterns while integrating macroeconomic and trade datasets such as GDP and population forecasts, bilateral import–export flows, tariff structures, elasticity differentials between developed and developing economies, geographic distance, and import demand projections. Using weighted trade values from 2020–2024 as the base period to project country-to-country export potential for 2030, these inputs are operationalized through calculated drivers such as gravity model parameters, tariff impact factors, and projected GDP per-capita growth. Through an analysis of hidden potentials, demand hotspots, and market conditions that are most favorable to success, this method enables firms to focus on target countries, maximize returns, and global expansion with data, backed by accuracy.
By factoring in the projected importer demand gap that is currently unmet and could be potential opportunity, it identifies the potential for the Exporter (Country) among 190 countries, against the general trade analysis, which identifies the biggest importer or exporter.
To discover high-growth global markets and optimize your business strategy:
Click Here
Pricing
- Single User License$ 1,995
- Department License$ 2,400
- Site License$ 3,120
- Global License$ 3,795

Leadership Perspectives from Industry Events
Search
Thought Leadership and Analyst Meet


Our Clients
6WResearch In News
- India Export Attractiveness Tracker 2026
- India Air Conditioner Market Set for Strong Rebound in 2026 After Weather-Led Correction and GST-Driven Recovery: 6Wresearch
- ADAS in India: How Automatic Emergency Braking, Blind Spot Detection & Driver Monitoring are Transforming Road Safety
- Doha a strategic location for EV manufacturing hub: IPA Qatar
- Demand for luxury TVs surging in the GCC, says Samsung
- Empowering Growth: The Thriving Journey of Bangladesh’s Cable Industry
Latest Reports
- Qatar Access and Home Network Market (2026-2032)
- Nicaragua RPG Gaming Market (2026-2032)
- New Zealand RPG Gaming Market (2026-2032)
- Netherlands RPG Gaming Market (2026-2032)
- Nauru RPG Gaming Market (2026-2032)
- Namibia RPG Gaming Market (2026-2032)
- Mozambique RPG Gaming Market (2026-2032)
- Montenegro RPG Gaming Market (2026-2032)
- Mongolia RPG Gaming Market (2026-2032)
- Monaco RPG Gaming Market (2026-2032)
Industry Events and Analyst Meet

EV India Expo 2026

HIMTEX 2026

India Refining Summit 2026

India EV Show 2026

EV tech India Expo 2026
Whitepaper
- Middle East & Africa Commercial Security Market Click here to view more.
- Middle East & Africa Fire Safety Systems & Equipment Market Click here to view more.
- GCC Drone Market Click here to view more.
- Middle East Lighting Fixture Market Click here to view more.
- GCC Physical & Perimeter Security Market Click here to view more.