Australia Underground Utility Mapping Market Size & Growth Rate (2026-2032)
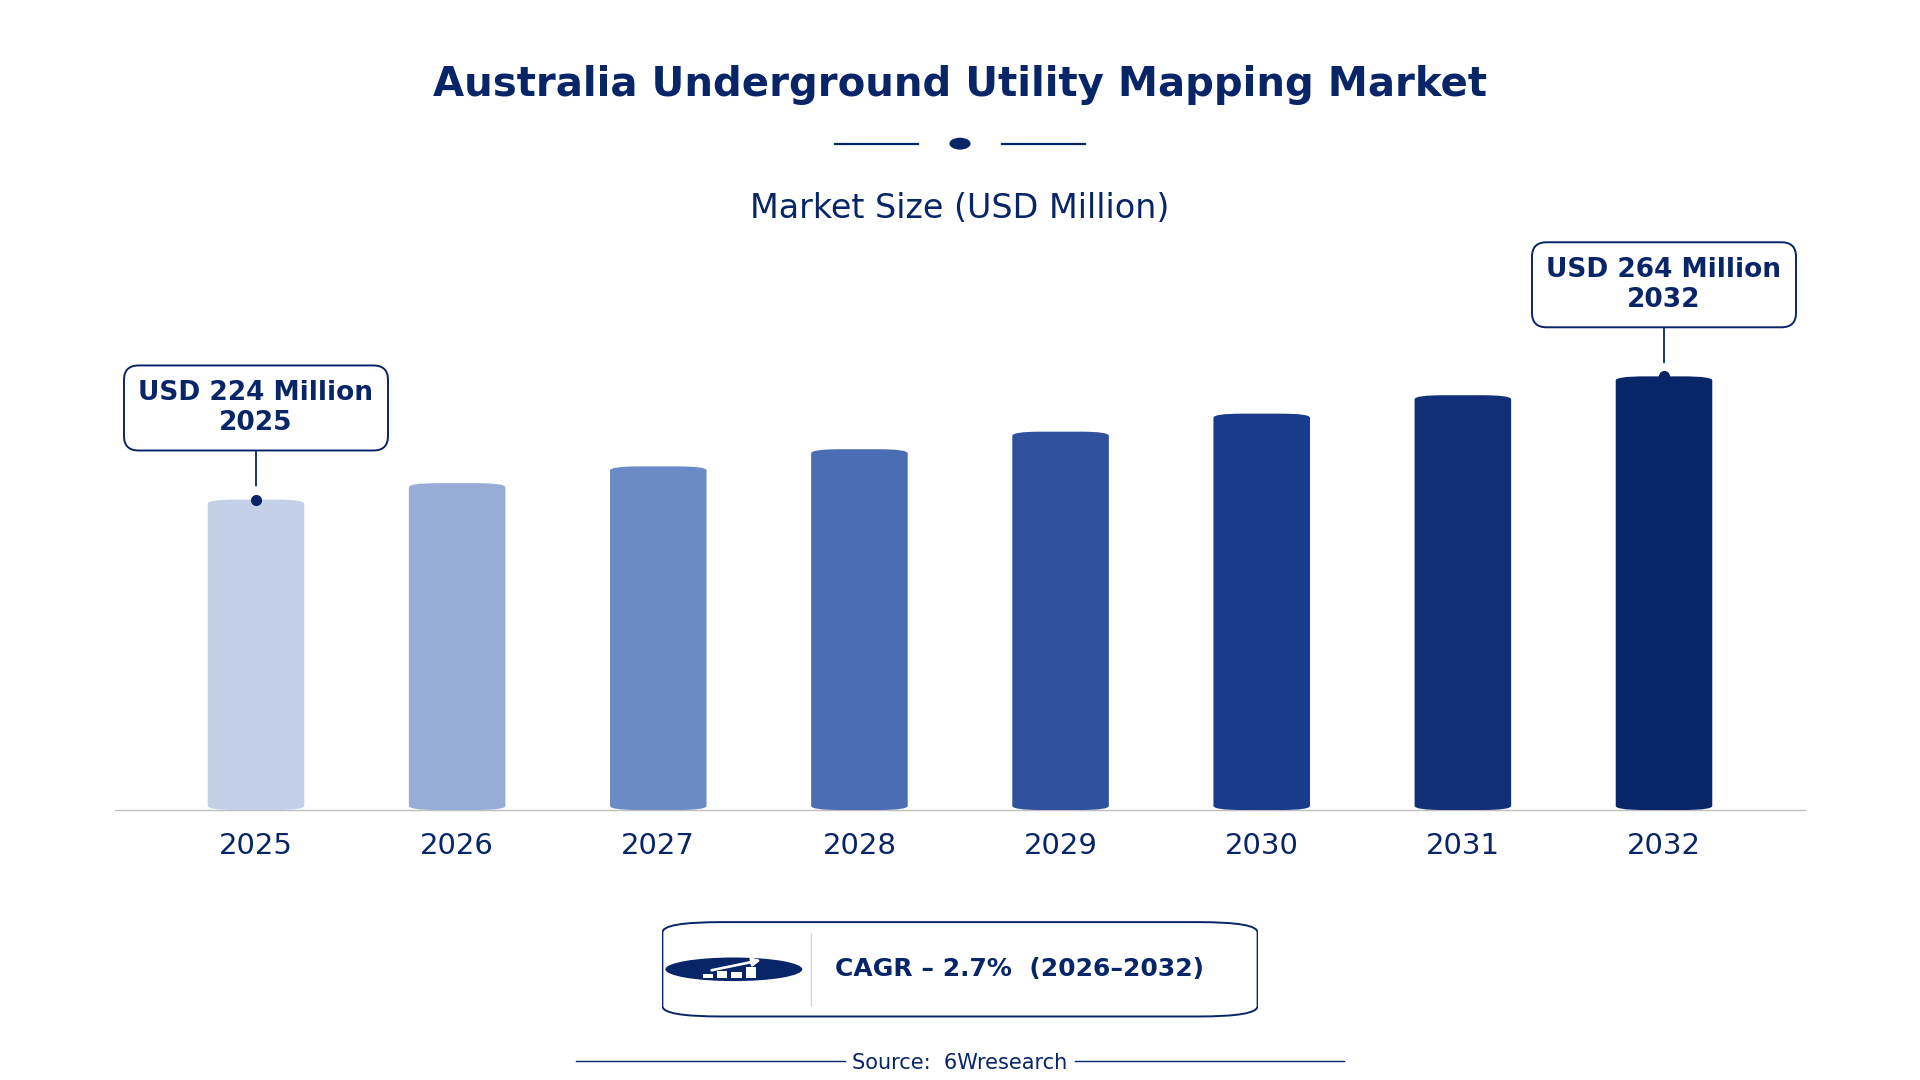
The Australia Underground Utility Mapping Market was estimated at USD 224 Million in 2025 and is projected to reach USD 264 Million by 2032, growing at a CAGR of 2.7% from 2026 to 2032.
Australia Underground Utility Mapping Market Synopsis
The urgent need for accurate underground utility mapping is the primary force driving the market in Australia. As urban centers expand, the stakes for precise mapping grow, with the potential for costly accidents and delays looming over construction and maintenance projects.
Technological advancements in geospatial tools, such as ground-penetrating radar and electromagnetic locators, are revolutionizing the way utilities are mapped. These innovations not only enhance accuracy but also contribute to better asset management, which is becoming increasingly crucial amid rising infrastructure demands.
Australia Underground Utility Mapping Market Year-wise Growth Rate and Key Drivers
This graph illustrates the annual growth rates of the Australia Underground Utility Mapping Market from 2021 to 2032, highlighting a steady upward trajectory and projected expansion over the forecast period.
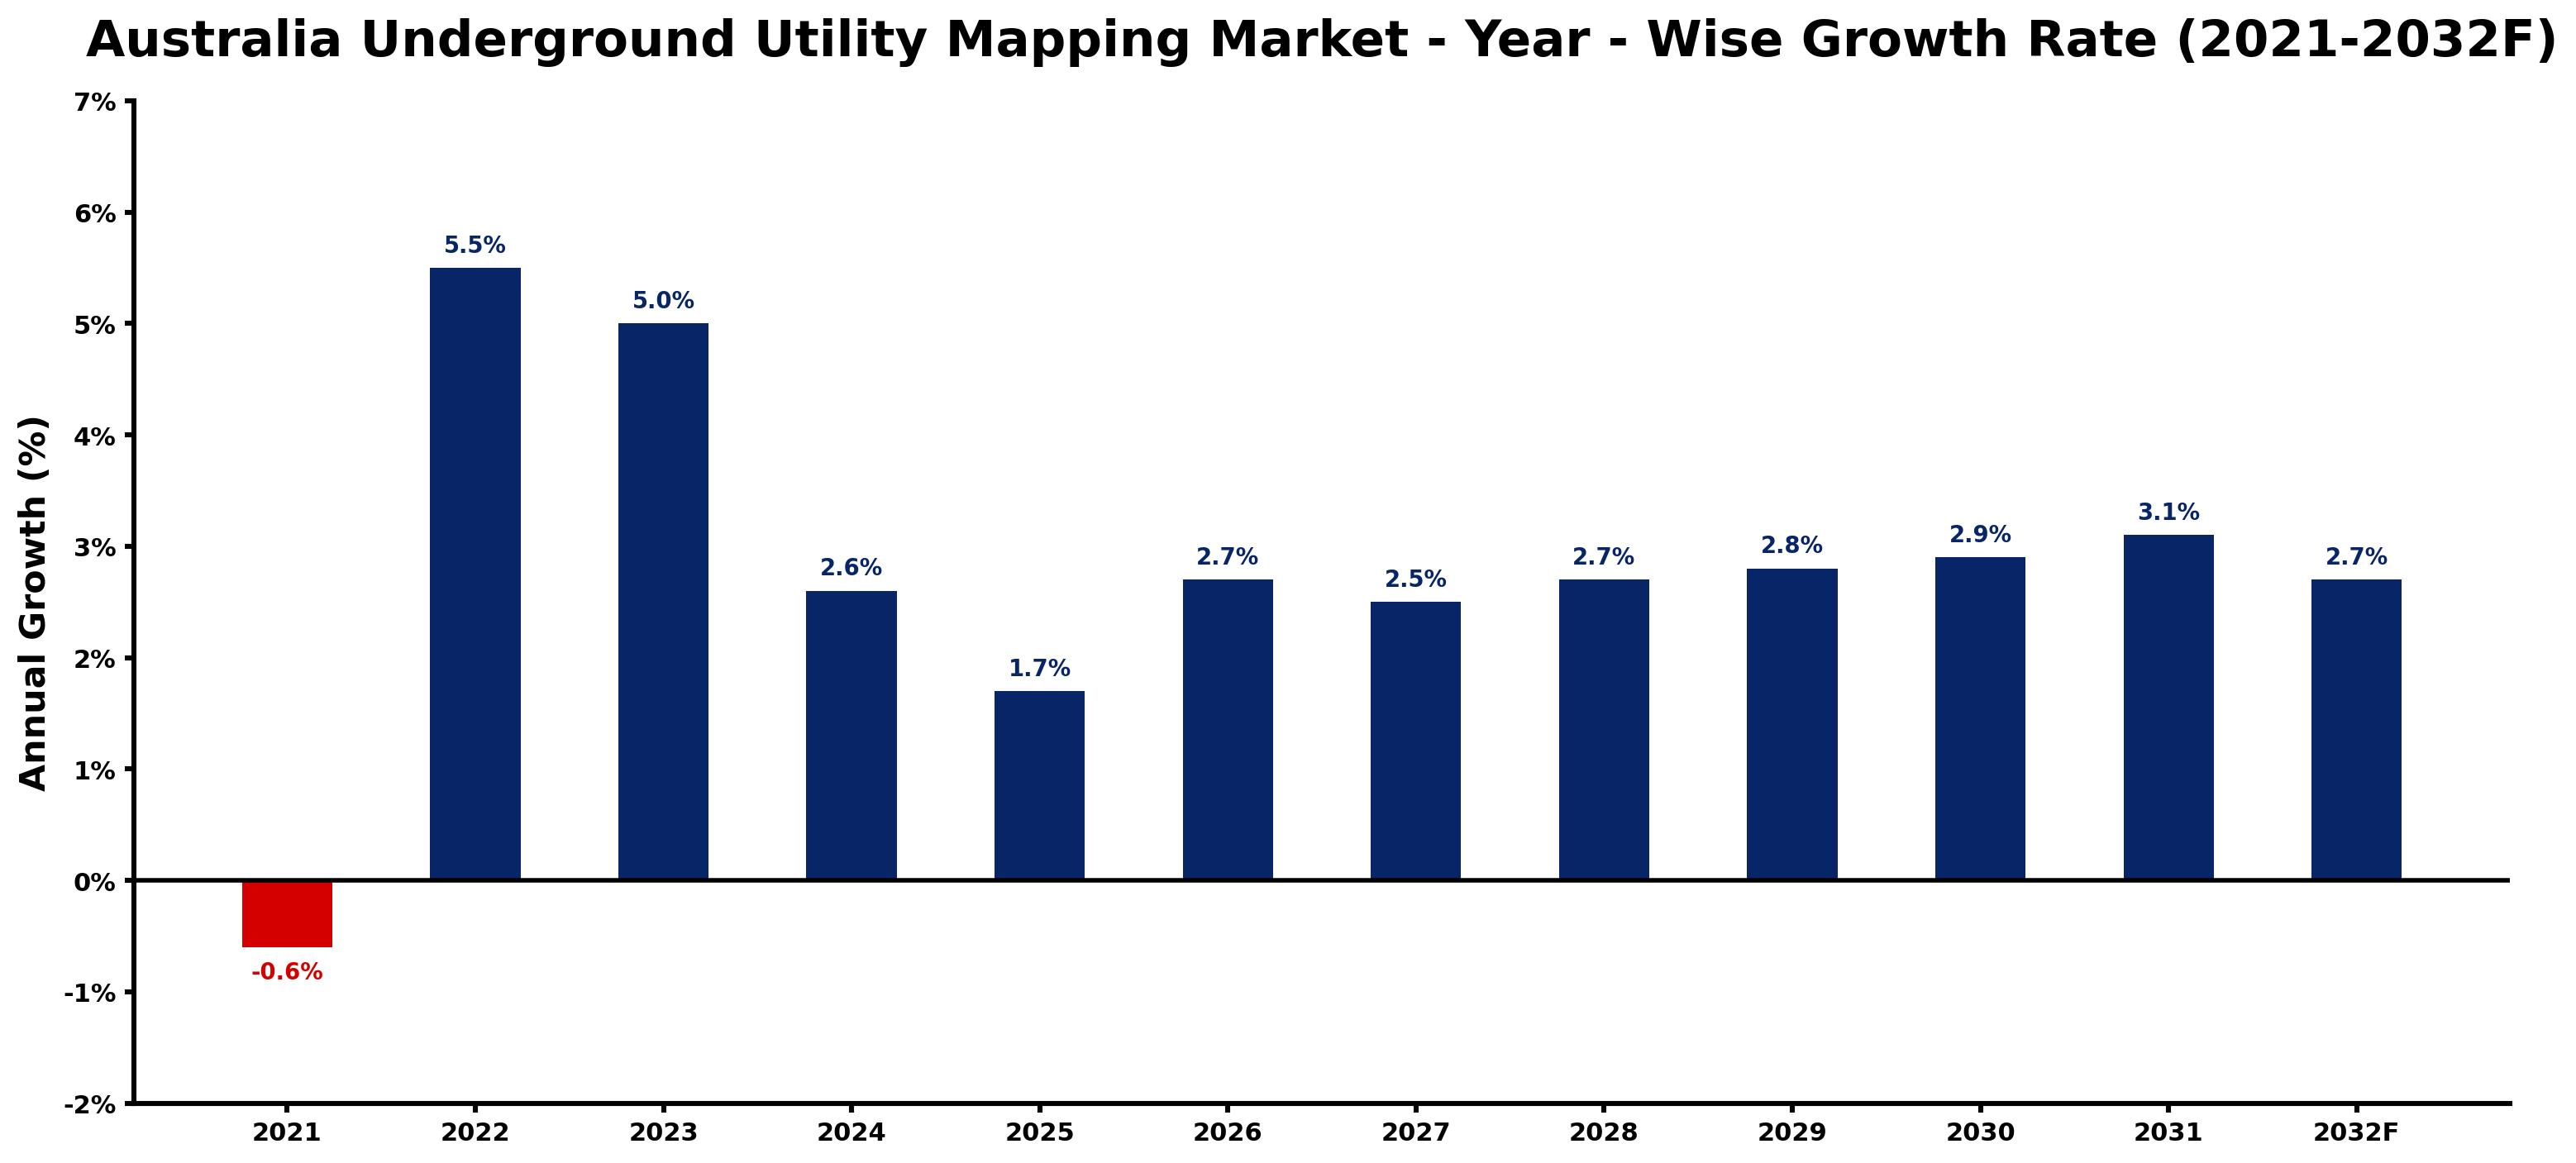
The table below presents the year‑wise growth rates along with the key drivers influencing the market
| Year | Growth Rate | Major Drivers |
| 2021 | -0.6% | COVID-19 restrictions delayed infrastructure project approvals. |
| 2022 | 5.5% | New regulatory standards by AS5488 for mapping accuracy |
| 2023 | 5.0% | Increased infrastructure investments from Australian government initiatives |
| 2024 | 2.6% | Growing adoption of digital twin technologies in utilities |
| 2025 | 1.7% | Enhanced demand for utility protection against aging assets |
| 2026 | 2.7% | Widespread implementation of GIS in local projects |
| 2027 | 2.5% | Rising pressure for improved environmental site assessments |
| 2028 | 2.7% | Demand for skilled labor in underground mapping technologies |
| 2029 | 2.8% | Urban redevelopment projects driving utility mapping requirements |
| 2030 | 2.9% | Government incentives for sustainable underground infrastructure projects |
| 2031 | 3.1% | Technological advances in ground penetrating radar applications |
| 2032 | 2.7% | Increasing collaboration between utilities for data sharing |
Note: Market size estimations and growth projections presented in this report are based on 6Wresearch's proprietary forecasting methodology, utilizing the latest available industry data, government publications, and primary research inputs.
Australia Underground Utility Mapping Market Key Takeaways
Below are some of the specific key takeaways from the market, including:
- The market is witnessing a steady growth trajectory, driven by urbanization and infrastructure expansion.
- Technological innovations are enhancing mapping accuracy and efficiency, significantly reducing risks associated with utility strikes.
- Government regulations are increasingly mandating detailed mapping practices to enhance safety and operational efficiency.
- The complexity of existing underground infrastructure presents ongoing challenges for accurate utility mapping.
- Demand for advanced asset management solutions is pushing utility mapping services into a more critical role in project planning.
Evaluation of Restraints in Australia Underground Utility Mapping Market
The underground utility mapping market faces several constraints that could impact its growth. One major issue is the intricate nature of existing underground networks, which complicates the mapping process. Limited access to reliable data on underground utilities further exacerbates this problem. Additionally, the high cost associated with advanced mapping technologies can deter smaller firms from investing in these essential services. The challenge of ensuring data accuracy while minimizing disruptions to ongoing infrastructure projects remains a crucial hurdle for service providers.
Australia Underground Utility Mapping Market Trends
As demand for accurate mapping increases, several notable trends are emerging in the Australia Underground Utility Mapping Market. The integration of artificial intelligence and machine learning into mapping technologies is gaining traction, allowing for predictive analysis and improved decision-making processes. on top of that, there is a growing emphasis on data sharing among utility companies, which enhances the accuracy of mapping and reduces operational redundancies. Sustainability concerns are also prompting utilities to adopt greener technologies, influencing mapping practices towards more environmentally friendly approaches.
Australia Underground Utility Mapping Market Opportunities
The landscape for underground utility mapping in Australia is rich with opportunities. With government investments in infrastructure development, firms specializing in utility mapping can expect increased demand for their services. The push for enhanced asset management solutions provides additional avenues for growth, particularly for companies that can integrate advanced technologies into their offerings. Collaborations between private companies and government entities also present potential avenues for expansion, particularly in high-density urban areas where utility mapping is critical.
Government Initiatives in the Australia Underground Utility Mapping Market
Government policies are playing a crucial role in shaping the Australia Underground Utility Mapping Market. The regulatory environment is increasingly focused on enhancing public safety and infrastructure management. New regulations mandate accurate mapping of underground utilities to mitigate risks associated with excavation and construction activities. This growing emphasis on precision mapping is fostering the adoption of advanced technologies within the sector.
- A national digital infrastructure upgrade programme was launched in 2024, focusing on integrating advanced mapping technologies across various sectors.
- A current initiative aims to standardize utility mapping practices among utility companies, promoting a unified approach to data accuracy and sharing.
- Upcoming regulations expected to roll out in 2026 will require enhanced mapping protocols for all major construction projects, emphasizing the need for compliance.
- A public-private partnership initiative is underway to improve utility mapping services in urban areas, enhancing safety and efficiency in construction operations.
- Recent workshops organized by the government have focused on educating stakeholders about the importance of accurate mapping and the technologies available.
Future Insights of the Australia Underground Utility Mapping Market
Looking ahead to 2026-2032, the Australia Underground Utility Mapping Market is expected to continue its growth trajectory. As urbanization intensifies and infrastructure projects multiply, the demand for precise utility mapping will only increase. The integration of new technologies, including AI and machine learning, will enhance mapping capabilities, paving the way for improved asset management and safety protocols. Market players that can adapt to these technological advancements and regulatory changes will be well-positioned for success.
Australia Underground Utility Mapping Market Latest Developments
Recent developments in the Australia Underground Utility Mapping Market reflect a dynamic and responsive industry. Over the past year, companies have actively sought to enhance their service offerings and integrate new technologies to meet the rising demands of infrastructure projects.
- A leading regional operator introduced a new ground-penetrating radar system in early 2025, aimed at improving detection rates for underground utilities.
- A major technology vendor is currently developing an enhanced mapping software that integrates real-time data analytics, expected to be available by mid-2026.
- An initiative focused on training personnel in advanced utility mapping techniques began in Q2 2025 and remains underway, emphasizing workforce development.
- A planned rollout of a nationwide data-sharing platform is expected to begin in late 2026, aimed at facilitating better collaboration among utility companies.
- In mid-2025, a partnership was formed between several local governments to standardize mapping practices across their jurisdictions, enhancing efficiency and safety.
Australia Underground Utility Mapping Market - Key Attractiveness of the Report
- 10 Years of Market Numbers
- Historical Data Starting from 2022 to 2025
- Base Year: 2025
- Forecast Data until 2032
- Key Performance Indicators Impacting the Market
- Major Upcoming Developments and Projects
Key Highlights of the Report:
- Australia Underground Utility Mapping Market Outlook
- Market Size of Australia Underground Utility Mapping Market, 2025
- Forecast of Australia Underground Utility Mapping Market, 2032
- Historical Data and Forecast of Australia Underground Utility Mapping Revenues & Volume for the Period 2022-2032F
- Australia Underground Utility Mapping Market Trend Evolution
- Australia Underground Utility Mapping Market Drivers and Challenges
- Australia Underground Utility Mapping Price Trends
- Australia Underground Utility Mapping Porter's Five Forces
- Australia Underground Utility Mapping Industry Life Cycle
- Historical Data and Forecast of Australia Underground Utility Mapping Market Revenues & Volume By Component for the Period 2022-2032F
- Historical Data and Forecast of Australia Underground Utility Mapping Market Revenues & Volume By Technological Solutions for the Period 2022-2032F
- Historical Data and Forecast of Australia Underground Utility Mapping Market Revenues & Volume By Services for the Period 2022-2032F
- Historical Data and Forecast of Australia Underground Utility Mapping Market Revenues & Volume By Vertical for the Period 2022-2032F
- Historical Data and Forecast of Australia Underground Utility Mapping Market Revenues & Volume By Oil & Gas for the Period 2022-2032F
- Historical Data and Forecast of Australia Underground Utility Mapping Market Revenues & Volume By Electricity for the Period 2022-2032F
- Historical Data and Forecast of Australia Underground Utility Mapping Market Revenues & Volume By Government & Public Safety for the Period 2022-2032F
- Historical Data and Forecast of Australia Underground Utility Mapping Market Revenues & Volume By Construction for the Period 2022-2032F
- Historical Data and Forecast of Australia Underground Utility Mapping Market Revenues & Volume By Telecommunication for the Period 2022-2032F
- Historical Data and Forecast of Australia Underground Utility Mapping Market Revenues & Volume By Others for the Period 2022-2032F
- Australia Underground Utility Mapping Import Export Trade Statistics
- Market Opportunity Assessment By Component
- Market Opportunity Assessment By Vertical
- Australia Underground Utility Mapping Top Companies Market Share
- Australia Underground Utility Mapping Competitive Benchmarking By Technical and Operational Parameters
- Australia Underground Utility Mapping Company Profiles
- Australia Underground Utility Mapping Key Strategic Recommendations