Australia Used Car Market (2026-2032) | Outlook, Size, Value, Growth, Share, Companies, Revenue, Trends, Forecast, Industry & Analysis
Market Forecast By Vehicle Type (Passenger, SUV, LCV - Utes, LCV - Vans & Buses), By Vendor (Private, Dealer), By Fuel Type (Petrol, Diesel, Hybrid, EVs, Others (LPG and PHEVs)) And Competitive Landscape
| Product Code: ETC039256 | Publication Date: Jan 2021 | Updated Date: Apr 2026 | Product Type: Report | |
| Publisher: 6Wresearch | Author: Ravi Bhandari | No. of Pages: 64 | No. of Figures: 14 | No. of Tables: 5 |
Topics Covered in Australia Used Car Market Report
Australia Used Car Market Report thoroughly covers the market by vehicle type, vendor and fuel type. Australia Used Car Market Outlook report provides an unbiased and detailed analysis of the ongoing Australia Used Car Market trends, opportunities/high growth areas, and market drivers. This would help stakeholders devise and align their market strategies according to the current and future market dynamics.
Australia Used Car Market Synopsis
The Australia used car market has witnessed steady expansion, supported by rising vehicle parc and strong new car sales reaching at high units in 2025, which has increased the availability of used vehicles. Demand has been further driven by affordability considerations and strong recovery in tourism, with high international visits in 2024, boosting rental and second-hand vehicle demand. Additionally, the growing penetration of electric vehicles, with EV sales rising significantly and used EV supply increasing, has expanded the pool of available vehicles and diversified consumer choices. Further, increasing replacement cycles and higher new car prices have encouraged consumers to shift toward pre-owned vehicles. This trend is particularly evident among urban buyers seeking cost-effective mobility solutions without compromising on features.
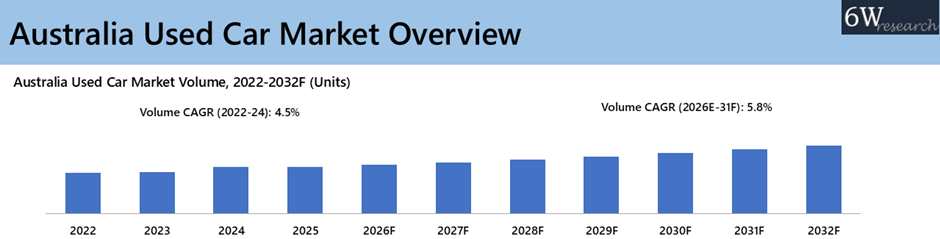
According to 6Wresearch, the Australia Used Car Market is projected to grow at a CAGR of 5.8% in Volume from 2026 to 2032, driven by increasing affordability pressures, rising disposable income, and expanding digital platforms. Australia’s GDP per capita has grown in recent years, enabling consumers to shift towards cost-effective used vehicles. Government initiatives such as legalization of imported used cars and supportive policies have further improved supply, while online platforms are enhancing accessibility, transparency, and transaction efficiency. In addition, favorable financing options and increasing availability of certified pre-owned vehicles are improving buyer confidence. The integration of digital tools such as AI-based pricing and virtual inspections is further streamlining transactions
Market Segmentation By Vehicle Type
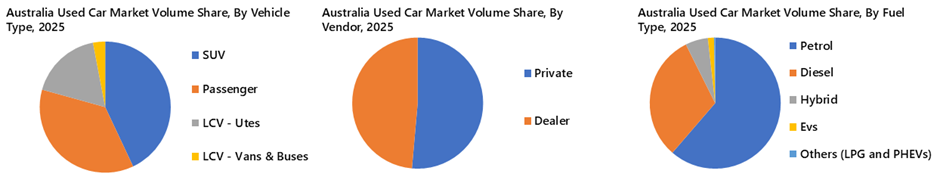
SUVs are projected to record the highest growth in Australia’s used car market, driven by rising consumer preference for spacious, versatile, and family-friendly vehicles. Increasing availability of compact and crossover SUVs, along with improving fuel efficiency, is further supporting their demand in the second-hand market.
Market Segmentation By Vendor
Private vendors are projected to record the highest growth in Australia’s used car market, driven by rising adoption of online marketplaces and increasing preference for direct transactions. Lower costs, flexible pricing, and faster deal closures further support their growth.
Market Segmentation By Fuel Type
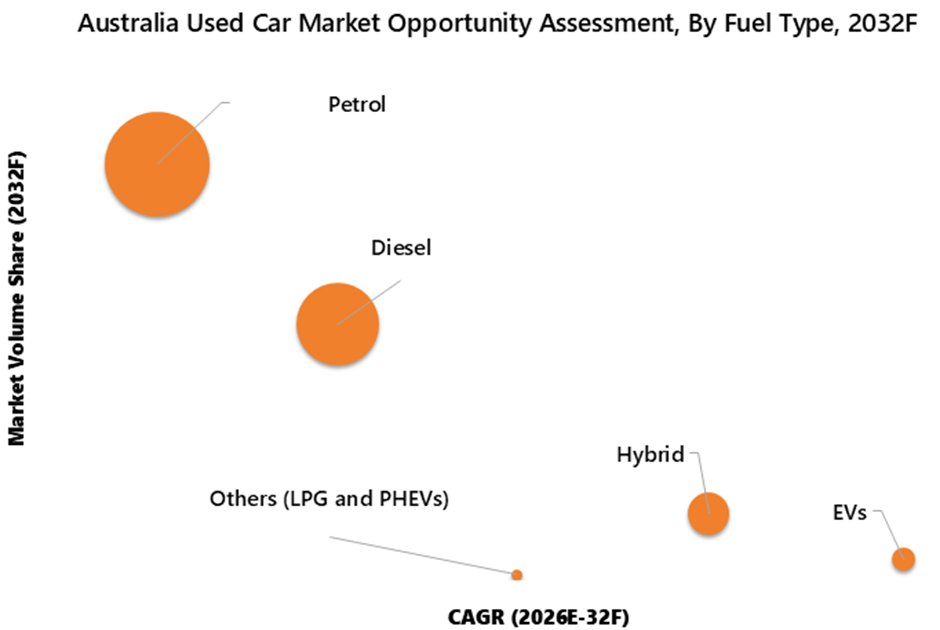
EVs are projected to record the highest growth in Australia’s used car market, driven by rising environmental awareness, government incentives, and expanding charging infrastructure. Improving affordability and battery advancements are further accelerating their adoption in the second-hand market.
Key Attractiveness of the Report
- 10 Years Market Numbers.
- Historical Data Starting from 2022 to 2025
- Base Year: 2025
- Forecast Data until 2032
- Key Performance Indicators Impacting the Market.
- Major Upcoming Developments and Projects.
Key Highlights of the Report:
- Australia Used Car Market Overview
- Australia Used Car Market Outlook
- Australia Used Car Market Forecast
- Historical Data and Forecast of Australia Used Car Market Volume Share and Volume for the Period 2022-2032F
- Historical Data and Forecast of Market Volume Share and Volume, By Vehicle Type, for the Period 2022-2032F
- Historical Data and Forecast of Market Volume Share and Volume, By Vendor, for the Period 2022-2032F
- Historical Data and Forecast of Market Volume Share and Volume, By Fuel Type, for the Period 2022-2032F
- Australia Used Car Market Drivers and Restraints
- Industry Life Cycle
- Porter’s Five Force Analysis
- Australia Used Car Evolution & Trends
- Market Opportunity Assessment
- Australia Used Car Market Volume Ranking, By Companies
- Competitive Benchmarking
- Company Profiles
- Key Strategic Recommendations
Market Scope and Segmentation
The report provides a detailed analysis of the following market segments:
By Vehicle Type
- Passenger
- SUV
- LCV - Utes
- LCV - Vans & Buses
By Vendor
- Private
- Dealer
By Fuel Type
- Petrol
- Diesel
- Hybrid
- EVs
- Others (LPG and PHEVs)
Australia Used Car Market (2026-2032): FAQs
Australia Used Car Market is projected to grow at a CAGR of 5.8% in Volume from 2026 to 2032F.
Shift Towards Electric Vehicles and Rising Disposable Income are driving the growth of market.
The market faces restraints due to Regulatory Pressure, Emission Standards, Structural & Inventory Constraints.
Digital platforms are expanding market size by improving transparency, integrating financing and inspections, and creating new revenue opportunities for organized vendors.
Australia Used Car Market Report thoroughly covers the market by vehicle type, vendor and fuel type.
6Wresearch actively monitors the Australia Used Car Market and publishes its comprehensive annual report, highlighting emerging trends, growth drivers, revenue analysis, and forecast outlook. Our insights help businesses to make data-backed strategic decisions with ongoing market dynamics. Our analysts track relevent industries related to the Australia Used Car Market, allowing our clients with actionable intelligence and reliable forecasts tailored to emerging regional needs.
Yes, we provide customisation as per your requirements. To learn more, feel free to contact us on sales@6wresearch.com
| 1. Executive Summary |
| 2. Introduction |
| 2.1 Report Description |
| 2.2 Key Highlights of the Report |
| 2.3 Market Scope and Segmentation |
| 2.4 Research Methodology |
| 2.5 Assumptions |
| 3. Global Used Car Market Overview |
| 3.1 Global Used Car Market Volume (2022-2032F) |
| 4. Australia Used Car Market Overview |
| 4.1 Australia Macro Economic Indicators |
| 4.2 Australia Used Car Market Volume (2022-2042F) |
| 4.3 Australia Used Car Market Industry Life Cycle |
| 4.4 Australia Used Car Market Porter Five Forces |
| 5. Australia Used Car Market Dynamics |
| 5.1 Impact Analysis |
| 5.2 Market Drivers |
| 5.3 Market Restraints |
| 6. Australia Used Car Market Trends & Evolution |
| 7. Australia Used Car Market Overview, By Vehicle Type |
| 7.1 Australia Used Car Market Volume Share, By Vehicle Type (2022-2032F) |
| 7.1.1 Australia Used Car Market Volume, By Passenger (2022-2032F) |
| 7.1.2 Australia Used Car Market Volume, By SUV (2022-2032F) |
| 7.1.3 Australia Used Car Market Volume, By LCV - Utes (2022-2032F) |
| 7.1.4 Australia Used Car Market Volume, By LCV - Vans & Buses (2022-2032F) |
| 8. Australia Used Car Market Overview, By Vendor |
| 8.1 Australia Used Car Market Volume Share, By Vendor (2022-2032F) |
| 8.1.1 Australia Used Car Market Volume, By Private (2022-2032F) |
| 8.1.2 Australia Used Car Market Volume, By Dealer (2022-2032F) |
| 9. Australia Used Car Market Overview, By Fuel Type |
| 9.1 Australia Used Car Market Volume Share, By Fuel Type (2022-2032F) |
| 9.1.1 Australia Used Car Market Volume, By Petrol (2022-2032F) |
| 9.1.2 Australia Used Car Market Volume, By Diesel (2022-2032F) |
| 9.1.3 Australia Used Car Market Volume, By Hybrid (2022-2032F) |
| 9.1.4 Australia Used Car Market Volume, By EVs (2022-2032F) |
| 9.1.5 Australia Used Car Market Volume, By Others (LPG and PHEVs) (2022-2032F) |
| 10. Australia Used Car Market Key Performance Indicators |
| 11. Australia Used Car Market Opportunity Assessment |
| 11.1 Australia Used Car Market Opportunity Assessment, By Vehicle Type (2032F) |
| 11.2 Australia Used Car Market Opportunity Assessment, By Vendor (2032F) |
| 11.3 Australia Used Car Market Opportunity Assessment, By Fuel Type (2032F) |
| 12. Australia Used Car Market Competitive Benchmarking |
| 12.1 Australia Used Car Market Volume Rankings (2024), By Top 3 Companies |
| 12.2 Australia Used Car Market Competitive Benchmarking, By Operating Parameters |
| 13. Company Profiles |
| 13.1 Eagers Automotive Limited |
| 13.2 Car City |
| 13.3 Dutton One |
| 13.4 Westside Auto |
| 13.5 Peter Warren Automotive |
| 13.6 Scotts Motor Group |
| 13.7 Australian Automotive Group |
| 13.8 Jefferson Automotive Group |
| 14. Key Strategic Recommendations |
| 15. Disclaimer |
| List of Figures |
| 1. Global Used Car Market Volume, 2022-2032F (Thousand Units) |
| 2. Australia Used Car Market Volume, 2022-2032F (Units) |
| 3. Australia Total Electric Vehicle Sales, 2021-2025 (Units) |
| 4. Australia Secondhand BEV Vehicles Sales vs Supply, H1 2024-H1 2025 (Units) |
| 5. Australia GDP Per Capita, 2021-2030F (In $) |
| 6. Australia Used Car Market Volume Share, By Vehicle Type, 2025 & 2032F |
| 7. Australia Used Car Market Volume Share, By Vendor, 2025 & 2032F |
| 8. Australia Used Car Market Volume Share, By Fuel Type, 2025 & 2032F |
| 9. Australia Top 5 Sold Used Vehicles, 2024 (Units) |
| 10. Number of International Visitors in Australia, Jan 2021-Jan 2025, (In Thousands) |
| 11. Australia Used Car Market Opportunity Assessment, By Vehicle Type, 2032F |
| 12. Australia Used Car Market Opportunity Assessment, By Vendor, 2032F |
| 13. Australia Used Car Market Opportunity Assessment, By Fuel Type, 2032F |
| 14. Australia Used Car Market Volume Ranking, By Companies, 2024 |
| List of tables |
| 1. Australia Used Car Market Volume, By Vehicle Type, 2022-2032F (Units) |
| 2. Australia Used Car Market Volume, By Vendor, 2022-2032F (Units) |
| 3. Australia Used Car Market Volume, By Fuel Type, 2022-2032F (Units) |
| 4. Australia Motor vehicle registrations by state and territory, 2021 |
| 5. Highest number of International Visitors at Australia Airports In October 2025 (In Thousand) |
Global Go To Market Strategy - 2030
Export potential enables firms to identify high-growth global markets with greater confidence by combining advanced trade intelligence with a structured quantitative methodology. The framework analyzes emerging demand trends and country-level import patterns while integrating macroeconomic and trade datasets such as GDP and population forecasts, bilateral import–export flows, tariff structures, elasticity differentials between developed and developing economies, geographic distance, and import demand projections. Using weighted trade values from 2020–2024 as the base period to project country-to-country export potential for 2030, these inputs are operationalized through calculated drivers such as gravity model parameters, tariff impact factors, and projected GDP per-capita growth. Through an analysis of hidden potentials, demand hotspots, and market conditions that are most favorable to success, this method enables firms to focus on target countries, maximize returns, and global expansion with data, backed by accuracy.
By factoring in the projected importer demand gap that is currently unmet and could be potential opportunity, it identifies the potential for the Exporter (Country) among 190 countries, against the general trade analysis, which identifies the biggest importer or exporter.
To discover high-growth global markets and optimize your business strategy:
Click Here
Pricing
- Single User License$ 1,995
- Department License$ 2,400
- Site License$ 3,120
- Global License$ 3,795

Leadership Perspectives from Industry Events
Search
Thought Leadership and Analyst Meet


Our Clients
6WResearch In News
- India Air Conditioner Market Set for Strong Rebound in 2026 After Weather-Led Correction and GST-Driven Recovery: 6Wresearch
- ADAS in India: How Automatic Emergency Braking, Blind Spot Detection & Driver Monitoring are Transforming Road Safety
- Doha a strategic location for EV manufacturing hub: IPA Qatar
- Demand for luxury TVs surging in the GCC, says Samsung
- Empowering Growth: The Thriving Journey of Bangladesh’s Cable Industry
- Demand for luxury TVs surging in the GCC, says Samsung
Latest Reports
- Poland Fire Protection Systems Market (2026-2032)
- Cape Verde Portable Hand-Thrown Extinguisher Market (2026-2032)
- Canada Portable Hand-Thrown Extinguisher Market (2026-2032)
- Cameroon Portable Hand-Thrown Extinguisher Market (2026-2032)
- Burundi Portable Hand-Thrown Extinguisher Market (2026-2032)
- Burkina Faso Portable Hand-Thrown Extinguisher Market (2026-2032)
- Bulgaria Portable Hand-Thrown Extinguisher Market (2026-2032)
- Brunei Portable Hand-Thrown Extinguisher Market (2026-2032)
- Botswana Portable Hand-Thrown Extinguisher Market (2026-2032)
- Bosnia and Herzegovina Portable Hand-Thrown Extinguisher Market (2026-2032)
Industry Events and Analyst Meet

HIMTEX 2026

India Refining Summit 2026

India EV Show 2026

EV tech India Expo 2026

Auto Tech Asia 2026
Whitepaper
- Middle East & Africa Commercial Security Market Click here to view more.
- Middle East & Africa Fire Safety Systems & Equipment Market Click here to view more.
- GCC Drone Market Click here to view more.
- Middle East Lighting Fixture Market Click here to view more.
- GCC Physical & Perimeter Security Market Click here to view more.