Australia Vitamin C Ingredients Market (2026-2032) Outlook | Revenue, Share, Companies, Size, Analysis, Value, Trends, Growth, Industry & Forecast
Market Forecast By Product Type (Ascorbic Acid, Sodium Ascorbate, Calcium Ascorbate, Coated Vitamin C, Others), By Form (Powder, Granules, Others), By Source (Natural, Synthetic), By Process (Reichstein Process, Two-Stage Fermentation Process), By End Use (Food & Beverages, Cosmetics & Personal Care Products, Pharmaceuticals, Animal Feed) And Competitive Landscape
| Product Code: ETC351755 | Publication Date: Aug 2022 | Updated Date: Jul 2026 | Product Type: Market Research Report | |
| Publisher: 6Wresearch | Author: Shubham Padhi | No. of Pages: 75 | No. of Figures: 35 | No. of Tables: 20 |
Australia Vitamin C Ingredients Market Size, Share & Growth Rate
The Australia Vitamin C Ingredients Market was estimated at USD 103 Million in 2025 and is projected to reach USD 121 Million by 2032, growing at a CAGR of 2.3% from 2026 to 2032. This growth trajectory is fueled by a significant shift in consumer behavior towards preventive healthcare, with vitamin C gaining traction as a key ingredient in dietary supplements and fortified foods. The heightened focus on immunity-boosting products, particularly in a post-pandemic landscape, is reinforcing this demand.
Australia Vitamin C Ingredients Market Growth Rate Analysis (2021-2032)
The Australian Vitamin C ingredients market has shown noteworthy fluctuations in growth rates over the past few years. Following a slight decline of 0.7% in 2021, the market rebounded strongly with a growth of 5.5% in 2022. This turnaround can be attributed to rising consumer awareness around health and wellness, leading to increased demand for Vitamin C in dietary supplements and functional foods. Although growth moderated to 4.4% in 2023 and is projected to gradually decrease to around 2.2% by 2028, investments in innovative production technologies and sustainable sourcing practices are expected to sustain interest. Additionally, the ongoing trend of digitalization in marketing strategies is enhancing consumer engagement, supporting steady demand in the coming years.
Australia Vitamin C Ingredients Market Year-wise Growth Rate and Key Drivers
This graph highlights how the Australia Vitamin C Ingredients Market has steadily grown over the past five years, supported by major growth factors.
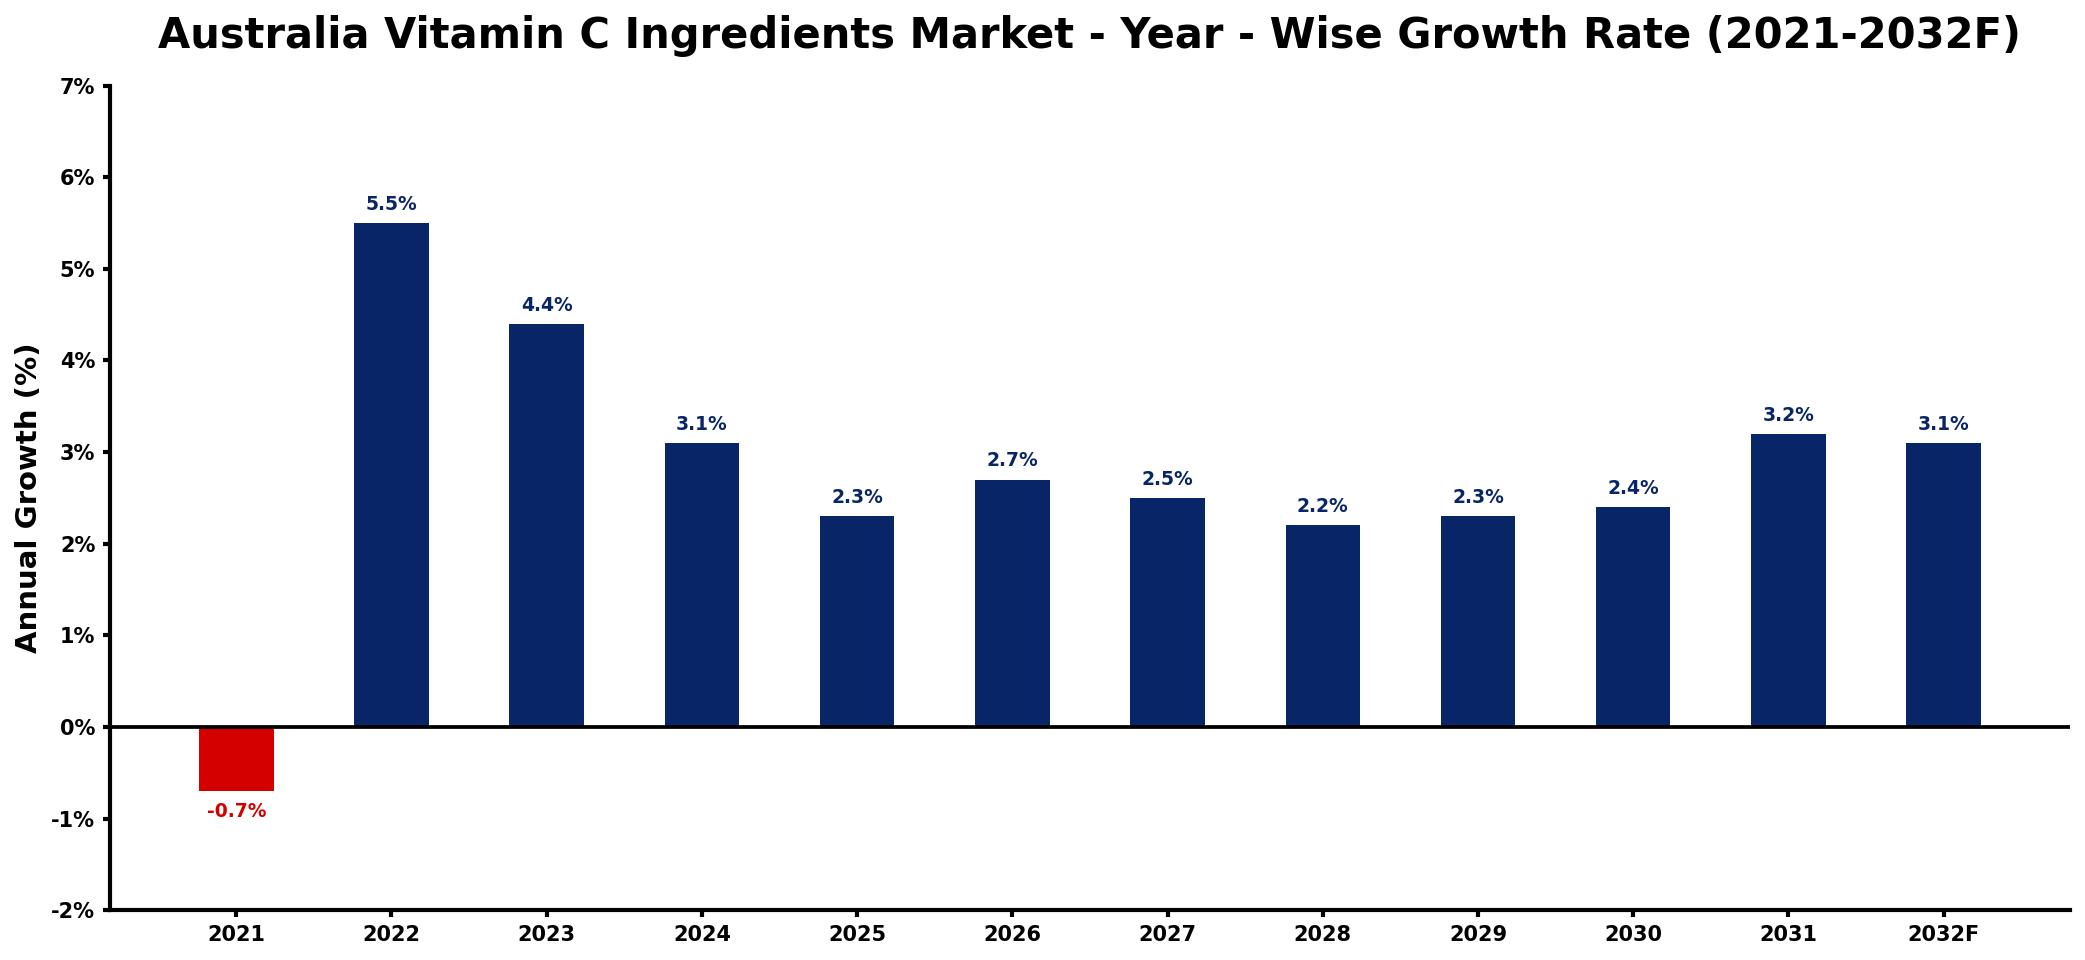
The table below presents the year‑wise growth rates along with the key drivers influencing the market
| Year | Growth Rate | Major Drivers |
| 2021 | -0.7% | decreased consumer health awareness |
| 2022 | 5.5% | rising demand for supplements |
| 2023 | 4.4% | increased investment in research |
| 2024 | 3.1% | growing health consciousness trend |
| 2025 | 2.3% | expansion of online retail channels |
| 2026 | 2.7% | emergence of new health trends |
| 2027 | 2.5% | increased focus on immunity products |
| 2028 | 2.2% | growing preference for natural options |
| 2029 | 2.3% | enhanced marketing strategies adopted |
| 2030 | 2.4% | rising collaborations with influencers |
| 2031 | 3.2% | increased consumer education initiatives |
| 2032 | 3.1% | growing popularity of functional foods |
Note: Market size estimations and growth projections presented in this report are based on 6Wresearch's proprietary forecasting methodology, utilizing the latest available industry data, government publications, and primary research inputs.
Australia Vitamin C Ingredients Market Synopsis
Currently, the Australian market is witnessing a remarkable surge in the consumption of vitamin C ingredients, largely driven by health-conscious consumers seeking natural alternatives. There is a marked preference for clean-label products, compelling manufacturers to innovate and explore diverse sources of vitamin C, particularly from fruits and botanicals.
Moreover, the integration of vitamin C into a variety of products—ranging from supplements to beverages—underscores its versatility and appeal. As awareness around nutritional benefits continues to rise, the vitamin C ingredients market is poised for sustained growth, characterized by evolving consumer preferences and industry dynamics.
Australia Vitamin C Ingredients Market Key Takeaways
- The market is experiencing robust growth due to increasing consumer awareness of health benefits associated with vitamin C.
- Innovation in sourcing natural and clean-label vitamin C ingredients is becoming a crucial competitive edge for manufacturers.
- Regulatory frameworks ensure the safety and efficacy of vitamin C ingredients, enhancing consumer trust.
- Emerging demand for functional foods and beverages presents lucrative opportunities for market players.
- Challenges around sourcing quality ingredients sustainably are pushing companies towards ethical supply chains.
Evaluation of Restraints in Australia Vitamin C Ingredients Market
Despite the promising growth, several restraints hinder the market's full potential. One significant challenge is the sourcing of high-quality vitamin C ingredients that align with competitive pricing and sustainability standards. Manufacturers often grapple with ensuring stability and bioavailability in their formulations, complicating product development processes. Furthermore, fluctuating global supply chains can disrupt local availability, impacting the overall market dynamics.
Australia Vitamin C Ingredients Market Trends
Current trends in the Australian Vitamin C ingredients market highlight a shift towards holistic health and wellness. Consumers are increasingly drawn to supplements that emphasize immune support, and this has led to a boom in innovative product formulations that combine vitamin C with other beneficial nutrients. Additionally, the rise of e-commerce platforms has transformed the way consumers access these products, making health supplements more convenient to purchase.
Australia Vitamin C Ingredients Market Opportunities
The market is ripe with opportunities, particularly in the areas of functional foods and beverages that cater to health-conscious consumers. As more Australians embrace healthy lifestyles, the demand for fortified products that feature vitamin C is expected to soar. Manufacturers that can effectively market their vitamin C-rich offerings with a focus on natural sourcing and health benefits will likely capture significant market share.
Government Initiatives in the Australia Vitamin C Ingredients Market
The Australian government plays a vital role in regulating vitamin C ingredients, ensuring compliance with safety and efficacy standards established by the Therapeutic Goods Administration (TGA). These regulations not only enhance consumer confidence but also incentivize local production of vitamin C-rich foods. Furthermore, government initiatives aimed at promoting nutritional education and awareness encourage the consumption of vitamin C, driving market growth.
Future Insights of the Australia Vitamin C Ingredients Market
Looking ahead to the period between 2026 and 2032, the Australia Vitamin C ingredients market is expected to evolve significantly. With a continued emphasis on health and wellness, coupled with growing consumer demand for natural products, manufacturers are likely to explore innovative extraction and formulation techniques. The market landscape will be shaped by technological advancements and an increasingly competitive environment, potentially leading to new partnerships and collaborations aimed at enhancing product offerings.
Australia Vitamin C Ingredients Market Latest Developments (2025 - 2026)
Recent developments in the Australia Vitamin C ingredients market indicate a growing interest in sustainable sourcing and production practices. Companies are actively investing in research to enhance the bioavailability of vitamin C in various formulations. Additionally, the trend toward plant-based and natural ingredients is driving innovations in product lines, with several manufacturers launching new vitamin C-enriched offerings tailored to consumer preferences.
Australia Vitamin C Ingredients Market - Key Attractiveness of the Report
- 10 Years of Market Numbers
- Historical Data Starting from 2022 to 2025
- Base Year: 2025
- Forecast Data until 2032
- Key Performance Indicators Impacting the Market
- Major Upcoming Developments and Projects
Key Highlights of the Report:
- Australia Vitamin C Ingredients Market Outlook
- Market Size of Australia Vitamin C Ingredients Market, 2025
- Forecast of Australia Vitamin C Ingredients Market, 2032
- Historical Data and Forecast of Australia Vitamin C Ingredients Revenues & Volume for the Period 2022-2032F
- Australia Vitamin C Ingredients Market Trend Evolution
- Australia Vitamin C Ingredients Market Drivers and Challenges
- Australia Vitamin C Ingredients Price Trends
- Australia Vitamin C Ingredients Porter's Five Forces
- Australia Vitamin C Ingredients Industry Life Cycle
- Historical Data and Forecast of Australia Vitamin C Ingredients Market Revenues & Volume By Product Type for the Period 2022-2032F
- Historical Data and Forecast of Australia Vitamin C Ingredients Market Revenues & Volume By Ascorbic Acid for the Period 2022-2032F
- Historical Data and Forecast of Australia Vitamin C Ingredients Market Revenues & Volume By Sodium Ascorbate for the Period 2022-2032F
- Historical Data and Forecast of Australia Vitamin C Ingredients Market Revenues & Volume By Calcium Ascorbate for the Period 2022-2032F
- Historical Data and Forecast of Australia Vitamin C Ingredients Market Revenues & Volume By Coated Vitamin C for the Period 2022-2032F
- Historical Data and Forecast of Australia Vitamin C Ingredients Market Revenues & Volume By Others for the Period 2022-2032F
- Historical Data and Forecast of Australia Vitamin C Ingredients Market Revenues & Volume By Form for the Period 2022-2032F
- Historical Data and Forecast of Australia Vitamin C Ingredients Market Revenues & Volume By Powder for the Period 2022-2032F
- Historical Data and Forecast of Australia Vitamin C Ingredients Market Revenues & Volume By Granules for the Period 2022-2032F
- Historical Data and Forecast of Australia Vitamin C Ingredients Market Revenues & Volume By Others for the Period 2022-2032F
- Historical Data and Forecast of Australia Vitamin C Ingredients Market Revenues & Volume By Source for the Period 2022-2032F
- Historical Data and Forecast of Australia Vitamin C Ingredients Market Revenues & Volume By Natural for the Period 2022-2032F
- Historical Data and Forecast of Australia Vitamin C Ingredients Market Revenues & Volume By Synthetic for the Period 2022-2032F
- Historical Data and Forecast of Australia Vitamin C Ingredients Market Revenues & Volume By Process for the Period 2022-2032F
- Historical Data and Forecast of Australia Vitamin C Ingredients Market Revenues & Volume By Reichstein Process for the Period 2022-2032F
- Historical Data and Forecast of Australia Vitamin C Ingredients Market Revenues & Volume By Two-Stage Fermentation Process for the Period 2022-2032F
- Historical Data and Forecast of Australia Vitamin C Ingredients Market Revenues & Volume By End Use for the Period 2022-2032F
- Historical Data and Forecast of Australia Vitamin C Ingredients Market Revenues & Volume By Food & Beverages for the Period 2022-2032F
- Historical Data and Forecast of Australia Vitamin C Ingredients Market Revenues & Volume By Cosmetics & Personal Care Products for the Period 2022-2032F
- Historical Data and Forecast of Australia Vitamin C Ingredients Market Revenues & Volume By Pharmaceuticals for the Period 2022-2032F
- Historical Data and Forecast of Australia Vitamin C Ingredients Market Revenues & Volume By Animal Feed for the Period 2022-2032F
- Australia Vitamin C Ingredients Import Export Trade Statistics
- Market Opportunity Assessment By Product Type
- Market Opportunity Assessment By Form
- Market Opportunity Assessment By Source
- Market Opportunity Assessment By Process
- Market Opportunity Assessment By End Use
- Australia Vitamin C Ingredients Top Companies Market Share
- Australia Vitamin C Ingredients Competitive Benchmarking By Technical and Operational Parameters
- Australia Vitamin C Ingredients Company Profiles
- Australia Vitamin C Ingredients Key Strategic Recommendations
Frequently Asked Questions About the Market Study (FAQs):
The growth is primarily driven by increased consumer awareness about health benefits, the demand for natural products, and the rising popularity of immunity-boosting supplements.
The regulatory framework established by the TGA ensures that all vitamin C ingredients used in consumer products meet safety and efficacy standards, thereby enhancing consumer confidence in these products.
The Australia Vitamin C Ingredients Market was estimated at USD 103 Million in 2025 and is projected to reach USD 121 Million by 2032, growing at a CAGR of 2.3% from 2026 to 2032.
Emerging trends include a focus on plant-based sources, clean-label products, and the integration of vitamin C into functional foods and beverages aimed at health-conscious consumers.
Opportunities lie in developing innovative products that cater to the health trends, particularly in fortified foods and beverages that emphasize vitamin C's immune-supporting benefits.
Manufacturers are increasingly focused on establishing ethical supply chains and investing in technology to ensure quality and sustainability in sourcing vitamin C ingredients.
6Wresearch actively monitors the Australia Vitamin C Ingredients Market and publishes its comprehensive annual report, highlighting emerging trends, growth drivers, revenue analysis, and forecast outlook. Our insights help businesses to make data-backed strategic decisions with ongoing market dynamics. Our analysts track relevent industries related to the Australia Vitamin C Ingredients Market, allowing our clients with actionable intelligence and reliable forecasts tailored to emerging regional needs.
Yes, we provide customisation as per your requirements. To learn more, feel free to contact us on sales@6wresearch.com
1 Executive Summary |
2 Introduction |
2.1 Key Highlights of the Report |
2.2 Report Description |
2.3 Market Scope & Segmentation |
2.4 Research Methodology |
2.5 Assumptions |
3 Australia Vitamin C Ingredients Market Overview |
3.1 Australia Country Macro Economic Indicators |
3.2 Australia Vitamin C Ingredients Market Revenues & Volume, 2022 & 2032F |
3.3 Australia Vitamin C Ingredients Market - Industry Life Cycle |
3.4 Australia Vitamin C Ingredients Market - Porter's Five Forces |
3.5 Australia Vitamin C Ingredients Market Revenues & Volume Share, By Product Type, 2022 & 2032F |
3.6 Australia Vitamin C Ingredients Market Revenues & Volume Share, By Form, 2022 & 2032F |
3.7 Australia Vitamin C Ingredients Market Revenues & Volume Share, By Source, 2022 & 2032F |
3.8 Australia Vitamin C Ingredients Market Revenues & Volume Share, By Process, 2022 & 2032F |
3.9 Australia Vitamin C Ingredients Market Revenues & Volume Share, By End Use, 2022 & 2032F |
4 Australia Vitamin C Ingredients Market Dynamics |
4.1 Impact Analysis |
4.2 Market Drivers |
4.2.1 Increasing consumer awareness about the health benefits of vitamin C |
4.2.2 Growing demand for natural and organic ingredients in the food and beverage industry |
4.2.3 Rising focus on preventive healthcare and wellness trends |
4.3 Market Restraints |
4.3.1 Fluctuating prices of raw materials and ingredients |
4.3.2 Stringent regulations and standards governing the production and sale of vitamin C ingredients |
4.3.3 Intense competition from alternative sources of vitamin C and other health supplements |
5 Australia Vitamin C Ingredients Market Trends |
6 Australia Vitamin C Ingredients Market, By Types |
6.1 Australia Vitamin C Ingredients Market, By Product Type |
6.1.1 Overview and Analysis |
6.1.2 Australia Vitamin C Ingredients Market Revenues & Volume, By Product Type, 2022-2032F |
6.1.3 Australia Vitamin C Ingredients Market Revenues & Volume, By Ascorbic Acid, 2022-2032F |
6.1.4 Australia Vitamin C Ingredients Market Revenues & Volume, By Sodium Ascorbate, 2022-2032F |
6.1.5 Australia Vitamin C Ingredients Market Revenues & Volume, By Calcium Ascorbate, 2022-2032F |
6.1.6 Australia Vitamin C Ingredients Market Revenues & Volume, By Coated Vitamin C, 2022-2032F |
6.1.7 Australia Vitamin C Ingredients Market Revenues & Volume, By Others, 2022-2032F |
6.2 Australia Vitamin C Ingredients Market, By Form |
6.2.1 Overview and Analysis |
6.2.2 Australia Vitamin C Ingredients Market Revenues & Volume, By Powder, 2022-2032F |
6.2.3 Australia Vitamin C Ingredients Market Revenues & Volume, By Granules, 2022-2032F |
6.2.4 Australia Vitamin C Ingredients Market Revenues & Volume, By Others, 2022-2032F |
6.3 Australia Vitamin C Ingredients Market, By Source |
6.3.1 Overview and Analysis |
6.3.2 Australia Vitamin C Ingredients Market Revenues & Volume, By Natural, 2022-2032F |
6.3.3 Australia Vitamin C Ingredients Market Revenues & Volume, By Synthetic, 2022-2032F |
6.4 Australia Vitamin C Ingredients Market, By Process |
6.4.1 Overview and Analysis |
6.4.2 Australia Vitamin C Ingredients Market Revenues & Volume, By Reichstein Process, 2022-2032F |
6.4.3 Australia Vitamin C Ingredients Market Revenues & Volume, By Two-Stage Fermentation Process, 2022-2032F |
6.5 Australia Vitamin C Ingredients Market, By End Use |
6.5.1 Overview and Analysis |
6.5.2 Australia Vitamin C Ingredients Market Revenues & Volume, By Food & Beverages, 2022-2032F |
6.5.3 Australia Vitamin C Ingredients Market Revenues & Volume, By Cosmetics & Personal Care Products, 2022-2032F |
6.5.4 Australia Vitamin C Ingredients Market Revenues & Volume, By Pharmaceuticals, 2022-2032F |
6.5.5 Australia Vitamin C Ingredients Market Revenues & Volume, By Animal Feed, 2022-2032F |
7 Australia Vitamin C Ingredients Market Import-Export Trade Statistics |
7.1 Australia Vitamin C Ingredients Market Export to Major Countries |
7.2 Australia Vitamin C Ingredients Market Imports from Major Countries |
8 Australia Vitamin C Ingredients Market Key Performance Indicators |
8.1 Percentage of food and beverage products in Australia containing added vitamin C |
8.2 Number of new product launches featuring vitamin C ingredients in the Australian market |
8.3 Consumer surveys measuring awareness and perception of the importance of vitamin C in daily diet |
9 Australia Vitamin C Ingredients Market - Opportunity Assessment |
9.1 Australia Vitamin C Ingredients Market Opportunity Assessment, By Product Type, 2022 & 2032F |
9.2 Australia Vitamin C Ingredients Market Opportunity Assessment, By Form, 2022 & 2032F |
9.3 Australia Vitamin C Ingredients Market Opportunity Assessment, By Source, 2022 & 2032F |
9.4 Australia Vitamin C Ingredients Market Opportunity Assessment, By Process, 2022 & 2032F |
9.5 Australia Vitamin C Ingredients Market Opportunity Assessment, By End Use, 2022 & 2032F |
10 Australia Vitamin C Ingredients Market - Competitive Landscape |
10.1 Australia Vitamin C Ingredients Market Revenue Share, By Companies, 2025 |
10.2 Australia Vitamin C Ingredients Market Competitive Benchmarking, By Operating and Technical Parameters |
11 Company Profiles |
12 Recommendations |
13 Disclaimer |
Global Go To Market Strategy - 2030
Export potential enables firms to identify high-growth global markets with greater confidence by combining advanced trade intelligence with a structured quantitative methodology. The framework analyzes emerging demand trends and country-level import patterns while integrating macroeconomic and trade datasets such as GDP and population forecasts, bilateral import–export flows, tariff structures, elasticity differentials between developed and developing economies, geographic distance, and import demand projections. Using weighted trade values from 2020–2024 as the base period to project country-to-country export potential for 2030, these inputs are operationalized through calculated drivers such as gravity model parameters, tariff impact factors, and projected GDP per-capita growth. Through an analysis of hidden potentials, demand hotspots, and market conditions that are most favorable to success, this method enables firms to focus on target countries, maximize returns, and global expansion with data, backed by accuracy.
By factoring in the projected importer demand gap that is currently unmet and could be potential opportunity, it identifies the potential for the Exporter (Country) among 190 countries, against the general trade analysis, which identifies the biggest importer or exporter.
To discover high-growth global markets and optimize your business strategy:
Click Here
Pricing
- Single User License$ 1,995
- Department License$ 2,400
- Site License$ 3,120
- Global License$ 3,795

Leadership Perspectives from Industry Events
Search
Thought Leadership and Analyst Meet


Our Clients
6WResearch In News
- India Air Conditioner Market Set for Strong Rebound in 2026 After Weather-Led Correction and GST-Driven Recovery: 6Wresearch
- ADAS in India: How Automatic Emergency Braking, Blind Spot Detection & Driver Monitoring are Transforming Road Safety
- Doha a strategic location for EV manufacturing hub: IPA Qatar
- Demand for luxury TVs surging in the GCC, says Samsung
- Empowering Growth: The Thriving Journey of Bangladesh’s Cable Industry
- Demand for luxury TVs surging in the GCC, says Samsung
Latest Reports
- Nicaragua RPG Gaming Market (2026-2032)
- New Zealand RPG Gaming Market (2026-2032)
- Netherlands RPG Gaming Market (2026-2032)
- Nauru RPG Gaming Market (2026-2032)
- Namibia RPG Gaming Market (2026-2032)
- Mozambique RPG Gaming Market (2026-2032)
- Montenegro RPG Gaming Market (2026-2032)
- Mongolia RPG Gaming Market (2026-2032)
- Monaco RPG Gaming Market (2026-2032)
- Micronesia RPG Gaming Market (2026-2032)
Industry Events and Analyst Meet

HIMTEX 2026

India Refining Summit 2026

India EV Show 2026

EV tech India Expo 2026

Auto Tech Asia 2026
Whitepaper
- Middle East & Africa Commercial Security Market Click here to view more.
- Middle East & Africa Fire Safety Systems & Equipment Market Click here to view more.
- GCC Drone Market Click here to view more.
- Middle East Lighting Fixture Market Click here to view more.
- GCC Physical & Perimeter Security Market Click here to view more.