Austria Bio Compatible Dental Materials Market (2026-2032) | Value, Competitive, Trends, Analysis, Strategy, Strategic Insights, Investment Trends, Size, Segments, Demand, Forecast, Competition, Challenges, Growth, Consumer Insights, Opportunities, Industry, Supply, Companies, Revenue, Outlook, Drivers, Segmentation, Restraints, Share, Pricing Analysis
Market Forecast By Material Type (Bio-Ceramics, Bio-Polymers, Bio-Metals), By Application (Dental Crowns, Braces, Dental Implants), By End User (Clinics, Orthodontics, Dental Labs), By Source (Biomass, Plant-Based, Sugar-Based), By Environmental Impact (Biodegradable, Non-Toxic, Durable) And Competitive Landscape
| Product Code: ETC11452734 | Publication Date: Apr 2025 | Updated Date: Apr 2026 | Product Type: Market Research Report | |
| Publisher: 6Wresearch | No. of Pages: 65 | No. of Figures: 34 | No. of Tables: 19 | |
Austria Bio Compatible Dental Materials Market Size (2020-2030)
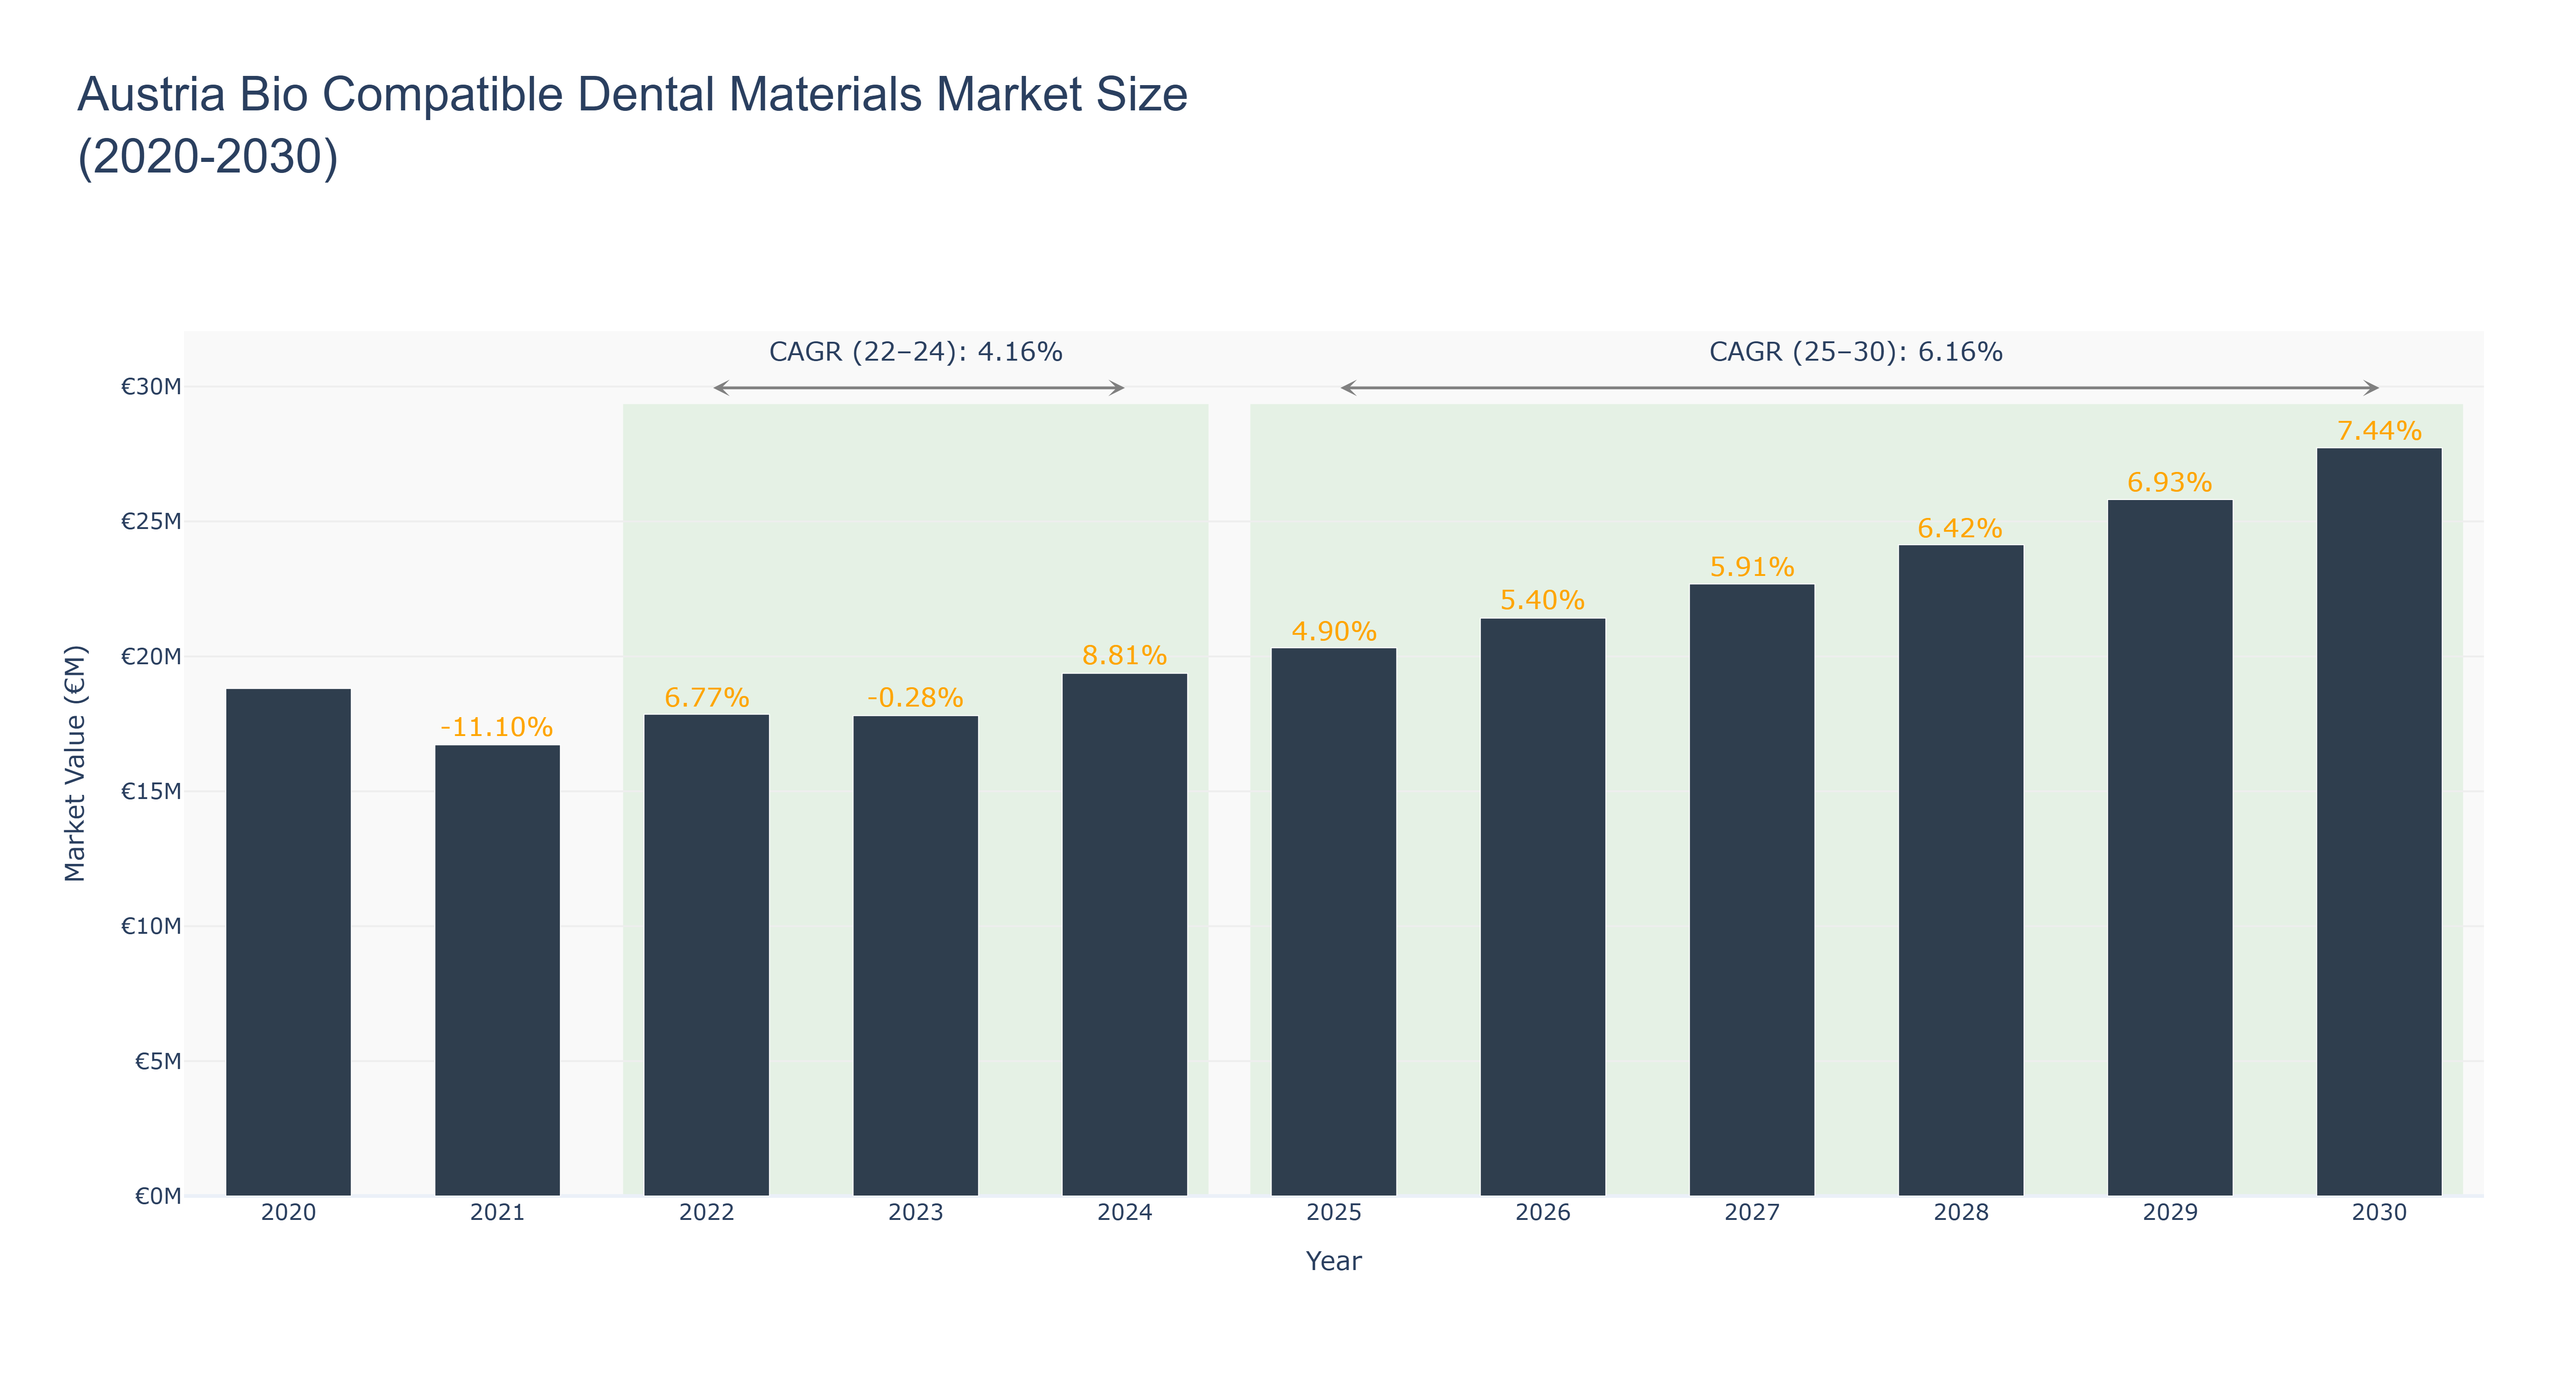
Austria Bio Compatible Dental Materials Market has shown a steady growth trajectory over the years. The peak market size of €27.73 million is forecasted for 2030. Notably, the market experienced a slight dip in 2021 with a size of €16.72 million but quickly recovered and surged to €19.37 million in 2024. The CAGR for the period 2022-24 stands at 4.16%, while for 2025-30, it is projected at 6.16%. The market's resilience can be attributed to the increasing demand for bio-compatible dental materials driven by advancements in dental technology and rising awareness about oral health. Looking ahead, Austria is set to witness a surge in dental tourism, with the government investing in state-of-the-art dental facilities to attract international patients and boost the local market further.
Austria Bio Compatible Dental Materials Market: Production & Trade Performance (2019-2025)
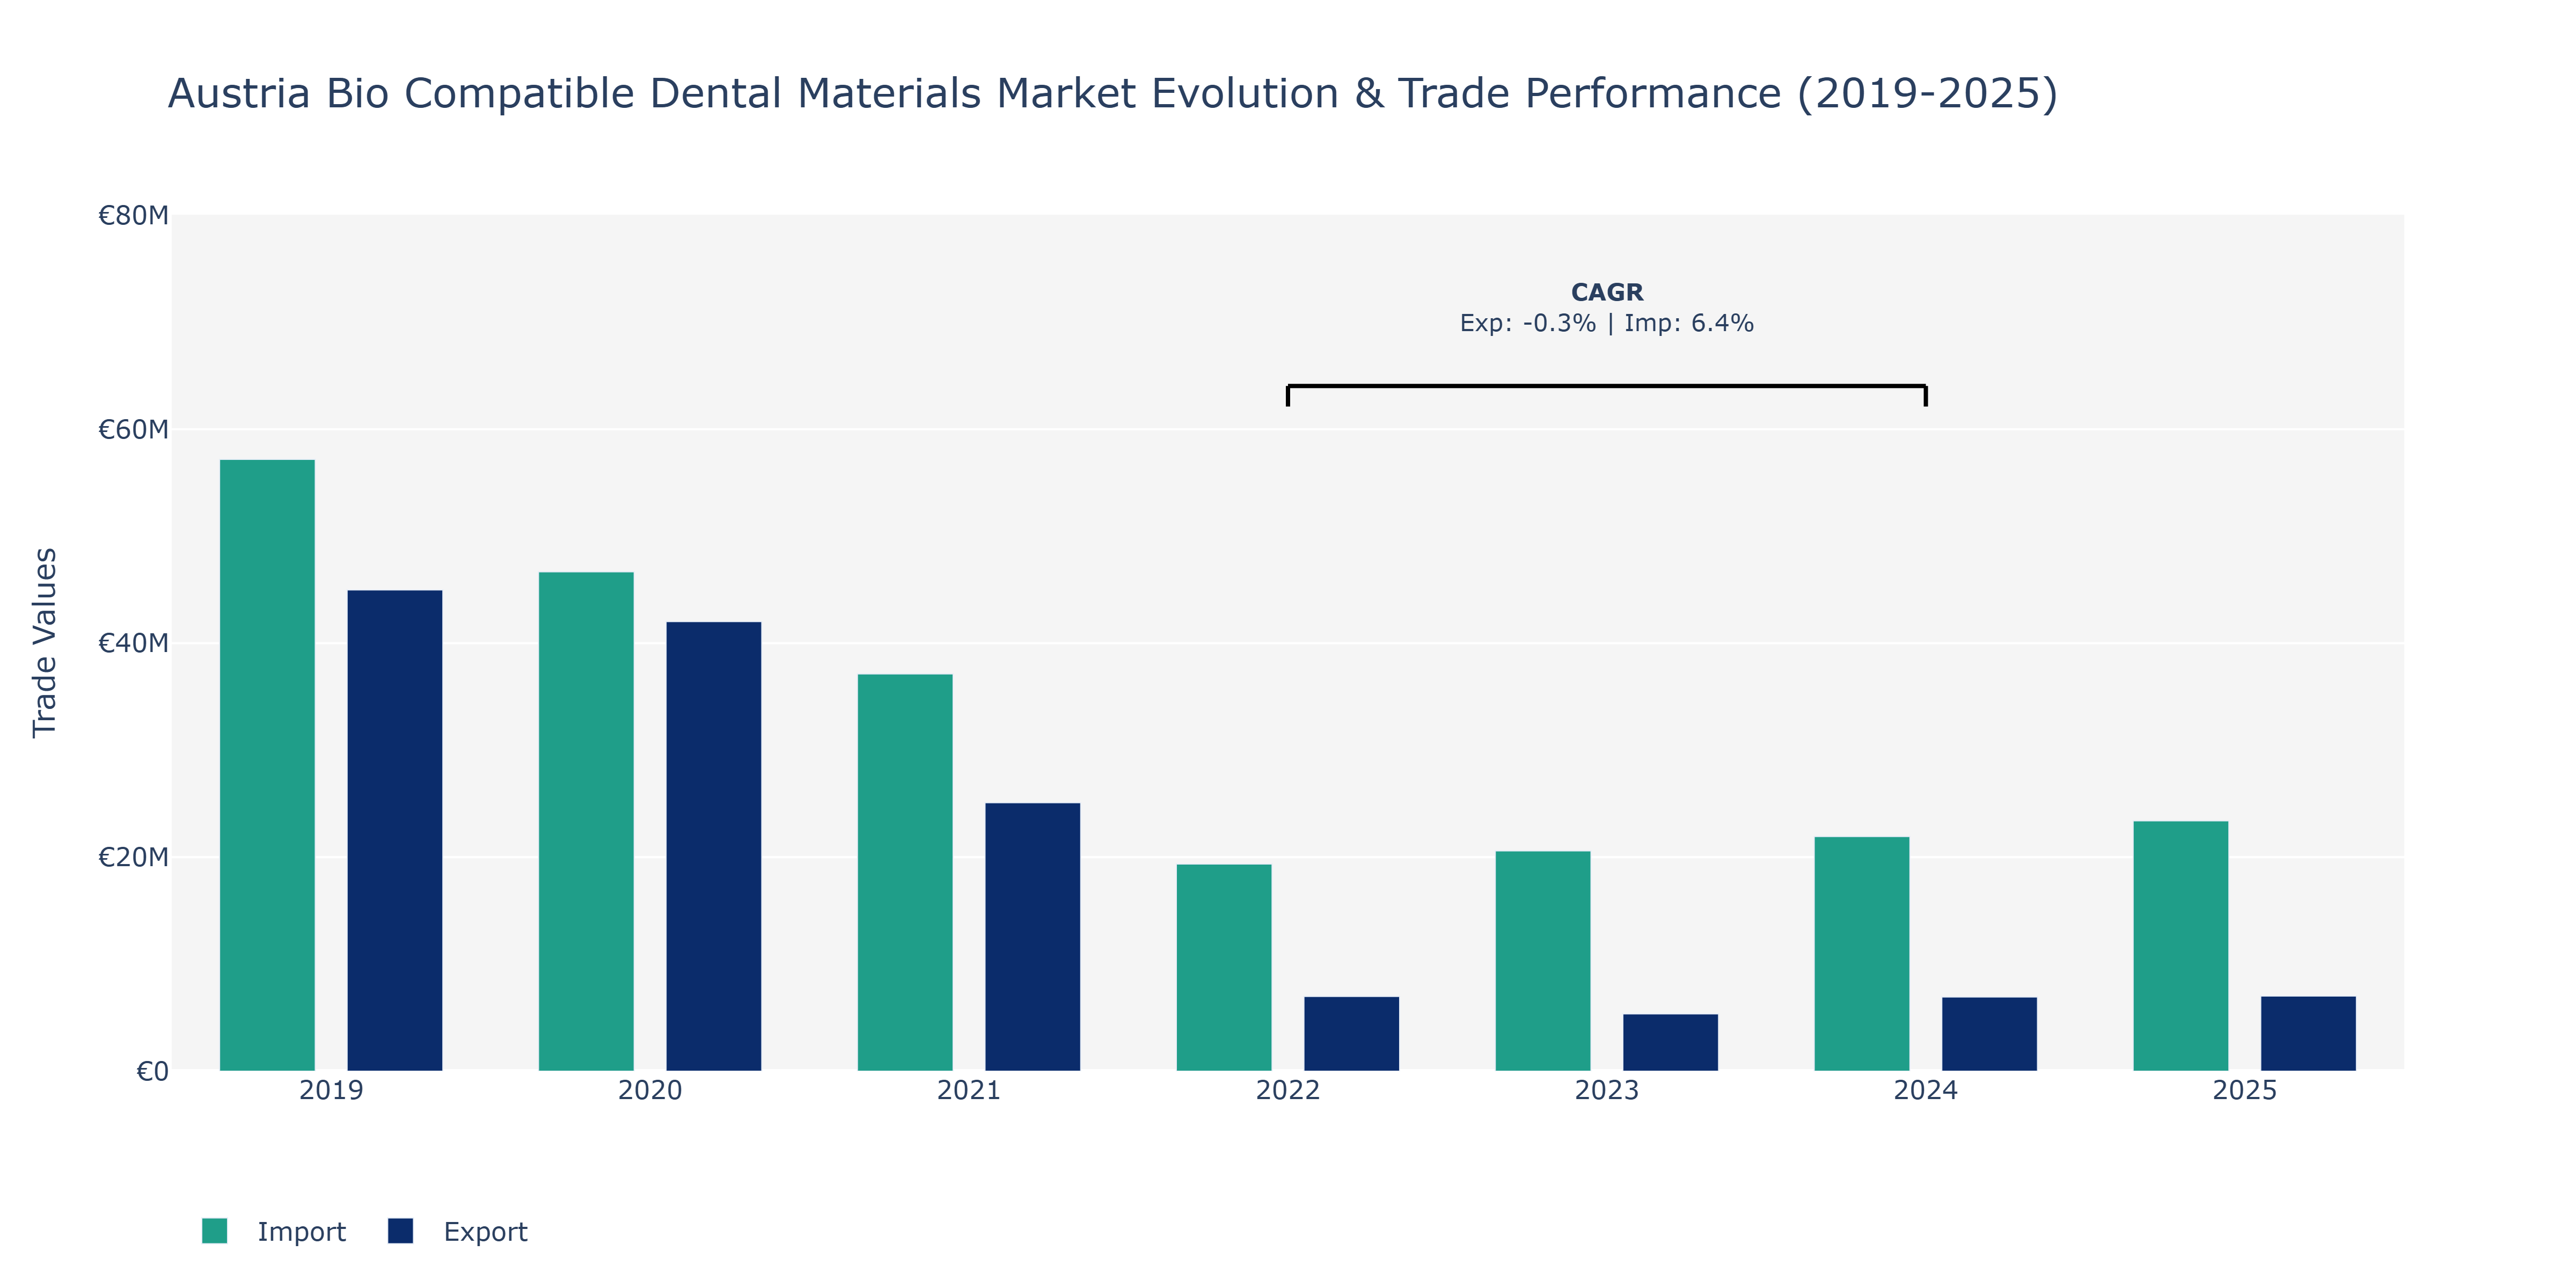
In the Austria Bio Compatible Dental Materials Market, exports and imports show varying trends over the specified years. Between 2019 and 2020, both exports and imports saw a decrease, with exports falling from €44.98 million to €42.02 million, and imports declining from €57.18 million to €46.67 million. The year 2021 witnessed a substantial drop in exports to €25.09 million, while imports decreased to €37.13 million. However, a slight recovery was observed in 2022, where exports amounted to €6.98 million and imports reached €19.36 million. From 2022 to 2025, a gradual increase in both exports and imports was noted, with exports rising to around €7.03 million and imports to approximately €23.4 million. The market's performance may be influenced by factors such as technological advancements in dental materials, changing consumer preferences towards bio-compatible products, and evolving regulations in the dental industry, driving the demand for such materials in Austria.
Key Highlights of the Report:
- Austria Bio Compatible Dental Materials Market Outlook
- Market Size of Austria Bio Compatible Dental Materials Market, 2025
- Forecast of Austria Bio Compatible Dental Materials Market, 2032
- Historical Data and Forecast of Austria Bio Compatible Dental Materials Revenues & Volume for the Period 2022-2032F
- Austria Bio Compatible Dental Materials Market Trend Evolution
- Austria Bio Compatible Dental Materials Market Drivers and Challenges
- Austria Bio Compatible Dental Materials Price Trends
- Austria Bio Compatible Dental Materials Porter's Five Forces
- Austria Bio Compatible Dental Materials Industry Life Cycle
- Historical Data and Forecast of Austria Bio Compatible Dental Materials Market Revenues & Volume By Material Type for the Period 2022-2032F
- Historical Data and Forecast of Austria Bio Compatible Dental Materials Market Revenues & Volume By Bio-Ceramics for the Period 2022-2032F
- Historical Data and Forecast of Austria Bio Compatible Dental Materials Market Revenues & Volume By Bio-Polymers for the Period 2022-2032F
- Historical Data and Forecast of Austria Bio Compatible Dental Materials Market Revenues & Volume By Bio-Metals for the Period 2022-2032F
- Historical Data and Forecast of Austria Bio Compatible Dental Materials Market Revenues & Volume By Application for the Period 2022-2032F
- Historical Data and Forecast of Austria Bio Compatible Dental Materials Market Revenues & Volume By Dental Crowns for the Period 2022-2032F
- Historical Data and Forecast of Austria Bio Compatible Dental Materials Market Revenues & Volume By Braces for the Period 2022-2032F
- Historical Data and Forecast of Austria Bio Compatible Dental Materials Market Revenues & Volume By Dental Implants for the Period 2022-2032F
- Historical Data and Forecast of Austria Bio Compatible Dental Materials Market Revenues & Volume By End User for the Period 2022-2032F
- Historical Data and Forecast of Austria Bio Compatible Dental Materials Market Revenues & Volume By Clinics for the Period 2022-2032F
- Historical Data and Forecast of Austria Bio Compatible Dental Materials Market Revenues & Volume By Orthodontics for the Period 2022-2032F
- Historical Data and Forecast of Austria Bio Compatible Dental Materials Market Revenues & Volume By Dental Labs for the Period 2022-2032F
- Historical Data and Forecast of Austria Bio Compatible Dental Materials Market Revenues & Volume By Source for the Period 2022-2032F
- Historical Data and Forecast of Austria Bio Compatible Dental Materials Market Revenues & Volume By Biomass for the Period 2022-2032F
- Historical Data and Forecast of Austria Bio Compatible Dental Materials Market Revenues & Volume By Plant-Based for the Period 2022-2032F
- Historical Data and Forecast of Austria Bio Compatible Dental Materials Market Revenues & Volume By Sugar-Based for the Period 2022-2032F
- Historical Data and Forecast of Austria Bio Compatible Dental Materials Market Revenues & Volume By Environmental Impact for the Period 2022-2032F
- Historical Data and Forecast of Austria Bio Compatible Dental Materials Market Revenues & Volume By Biodegradable for the Period 2022-2032F
- Historical Data and Forecast of Austria Bio Compatible Dental Materials Market Revenues & Volume By Non-Toxic for the Period 2022-2032F
- Historical Data and Forecast of Austria Bio Compatible Dental Materials Market Revenues & Volume By Durable for the Period 2022-2032F
- Austria Bio Compatible Dental Materials Import Export Trade Statistics
- Market Opportunity Assessment By Material Type
- Market Opportunity Assessment By Application
- Market Opportunity Assessment By End User
- Market Opportunity Assessment By Source
- Market Opportunity Assessment By Environmental Impact
- Austria Bio Compatible Dental Materials Top Companies Market Share
- Austria Bio Compatible Dental Materials Competitive Benchmarking By Technical and Operational Parameters
- Austria Bio Compatible Dental Materials Company Profiles
- Austria Bio Compatible Dental Materials Key Strategic Recommendations
Frequently Asked Questions About the Market Study (FAQs):
6Wresearch actively monitors the Austria Bio Compatible Dental Materials Market and publishes its comprehensive annual report, highlighting emerging trends, growth drivers, revenue analysis, and forecast outlook. Our insights help businesses to make data-backed strategic decisions with ongoing market dynamics. Our analysts track relevent industries related to the Austria Bio Compatible Dental Materials Market, allowing our clients with actionable intelligence and reliable forecasts tailored to emerging regional needs.
Yes, we provide customisation as per your requirements. To learn more, feel free to contact us on sales@6wresearch.com
1 Executive Summary |
2 Introduction |
2.1 Key Highlights of the Report |
2.2 Report Description |
2.3 Market Scope & Segmentation |
2.4 Research Methodology |
2.5 Assumptions |
3 Austria Bio Compatible Dental Materials Market Overview |
3.1 Austria Country Macro Economic Indicators |
3.2 Austria Bio Compatible Dental Materials Market Revenues & Volume, 2022 & 2032F |
3.3 Austria Bio Compatible Dental Materials Market - Industry Life Cycle |
3.4 Austria Bio Compatible Dental Materials Market - Porter's Five Forces |
3.5 Austria Bio Compatible Dental Materials Market Revenues & Volume Share, By Material Type, 2022 & 2032F |
3.6 Austria Bio Compatible Dental Materials Market Revenues & Volume Share, By Application, 2022 & 2032F |
3.7 Austria Bio Compatible Dental Materials Market Revenues & Volume Share, By End User, 2022 & 2032F |
3.8 Austria Bio Compatible Dental Materials Market Revenues & Volume Share, By Source, 2022 & 2032F |
3.9 Austria Bio Compatible Dental Materials Market Revenues & Volume Share, By Environmental Impact, 2022 & 2032F |
4 Austria Bio Compatible Dental Materials Market Dynamics |
4.1 Impact Analysis |
4.2 Market Drivers |
4.2.1 Increasing demand for cosmetic dentistry and aesthetic dental procedures |
4.2.2 Growing awareness about the benefits of bio-compatible dental materials |
4.2.3 Technological advancements in dental materials leading to improved performance and durability |
4.3 Market Restraints |
4.3.1 High costs associated with bio-compatible dental materials |
4.3.2 Limited availability of skilled professionals for handling bio-compatible materials |
4.3.3 Stringent regulations and standards for dental materials testing and approval |
5 Austria Bio Compatible Dental Materials Market Trends |
6 Austria Bio Compatible Dental Materials Market, By Types |
6.1 Austria Bio Compatible Dental Materials Market, By Material Type |
6.1.1 Overview and Analysis |
6.1.2 Austria Bio Compatible Dental Materials Market Revenues & Volume, By Material Type, 2022 - 2032F |
6.1.3 Austria Bio Compatible Dental Materials Market Revenues & Volume, By Bio-Ceramics, 2022 - 2032F |
6.1.4 Austria Bio Compatible Dental Materials Market Revenues & Volume, By Bio-Polymers, 2022 - 2032F |
6.1.5 Austria Bio Compatible Dental Materials Market Revenues & Volume, By Bio-Metals, 2022 - 2032F |
6.2 Austria Bio Compatible Dental Materials Market, By Application |
6.2.1 Overview and Analysis |
6.2.2 Austria Bio Compatible Dental Materials Market Revenues & Volume, By Dental Crowns, 2022 - 2032F |
6.2.3 Austria Bio Compatible Dental Materials Market Revenues & Volume, By Braces, 2022 - 2032F |
6.2.4 Austria Bio Compatible Dental Materials Market Revenues & Volume, By Dental Implants, 2022 - 2032F |
6.3 Austria Bio Compatible Dental Materials Market, By End User |
6.3.1 Overview and Analysis |
6.3.2 Austria Bio Compatible Dental Materials Market Revenues & Volume, By Clinics, 2022 - 2032F |
6.3.3 Austria Bio Compatible Dental Materials Market Revenues & Volume, By Orthodontics, 2022 - 2032F |
6.3.4 Austria Bio Compatible Dental Materials Market Revenues & Volume, By Dental Labs, 2022 - 2032F |
6.4 Austria Bio Compatible Dental Materials Market, By Source |
6.4.1 Overview and Analysis |
6.4.2 Austria Bio Compatible Dental Materials Market Revenues & Volume, By Biomass, 2022 - 2032F |
6.4.3 Austria Bio Compatible Dental Materials Market Revenues & Volume, By Plant-Based, 2022 - 2032F |
6.4.4 Austria Bio Compatible Dental Materials Market Revenues & Volume, By Sugar-Based, 2022 - 2032F |
6.5 Austria Bio Compatible Dental Materials Market, By Environmental Impact |
6.5.1 Overview and Analysis |
6.5.2 Austria Bio Compatible Dental Materials Market Revenues & Volume, By Biodegradable, 2022 - 2032F |
6.5.3 Austria Bio Compatible Dental Materials Market Revenues & Volume, By Non-Toxic, 2022 - 2032F |
6.5.4 Austria Bio Compatible Dental Materials Market Revenues & Volume, By Durable, 2022 - 2032F |
7 Austria Bio Compatible Dental Materials Market Import-Export Trade Statistics |
7.1 Austria Bio Compatible Dental Materials Market Export to Major Countries |
7.2 Austria Bio Compatible Dental Materials Market Imports from Major Countries |
8 Austria Bio Compatible Dental Materials Market Key Performance Indicators |
8.1 Percentage of dentists using bio-compatible materials in their practices |
8.2 Number of research studies published on the benefits of bio-compatible dental materials |
8.3 Adoption rate of bio-compatible materials in dental schools and training programs |
9 Austria Bio Compatible Dental Materials Market - Opportunity Assessment |
9.1 Austria Bio Compatible Dental Materials Market Opportunity Assessment, By Material Type, 2022 & 2032F |
9.2 Austria Bio Compatible Dental Materials Market Opportunity Assessment, By Application, 2022 & 2032F |
9.3 Austria Bio Compatible Dental Materials Market Opportunity Assessment, By End User, 2022 & 2032F |
9.4 Austria Bio Compatible Dental Materials Market Opportunity Assessment, By Source, 2022 & 2032F |
9.5 Austria Bio Compatible Dental Materials Market Opportunity Assessment, By Environmental Impact, 2022 & 2032F |
10 Austria Bio Compatible Dental Materials Market - Competitive Landscape |
10.1 Austria Bio Compatible Dental Materials Market Revenue Share, By Companies, 2025 |
10.2 Austria Bio Compatible Dental Materials Market Competitive Benchmarking, By Operating and Technical Parameters |
11 Company Profiles |
12 Recommendations |
13 Disclaimer |
Global Go To Market Strategy - 2030
Export potential enables firms to identify high-growth global markets with greater confidence by combining advanced trade intelligence with a structured quantitative methodology. The framework analyzes emerging demand trends and country-level import patterns while integrating macroeconomic and trade datasets such as GDP and population forecasts, bilateral import–export flows, tariff structures, elasticity differentials between developed and developing economies, geographic distance, and import demand projections. Using weighted trade values from 2020–2024 as the base period to project country-to-country export potential for 2030, these inputs are operationalized through calculated drivers such as gravity model parameters, tariff impact factors, and projected GDP per-capita growth. Through an analysis of hidden potentials, demand hotspots, and market conditions that are most favorable to success, this method enables firms to focus on target countries, maximize returns, and global expansion with data, backed by accuracy.
By factoring in the projected importer demand gap that is currently unmet and could be potential opportunity, it identifies the potential for the Exporter (Country) among 190 countries, against the general trade analysis, which identifies the biggest importer or exporter.
To discover high-growth global markets and optimize your business strategy:
Click Here
Pricing
- Single User License$ 1,995
- Department License$ 2,400
- Site License$ 3,120
- Global License$ 3,795

Leadership Perspectives from Industry Events
Search
Thought Leadership and Analyst Meet


Our Clients
6WResearch In News
- Doha a strategic location for EV manufacturing hub: IPA Qatar
- Demand for luxury TVs surging in the GCC, says Samsung
- Empowering Growth: The Thriving Journey of Bangladesh’s Cable Industry
- Demand for luxury TVs surging in the GCC, says Samsung
- Video call with a traditional healer? Once unthinkable, it’s now common in South Africa
- Intelligent Buildings To Smooth GCC’s Path To Net Zero
Latest Reports
- Taiwan Airport Wireless Infrastructure Market (2026-2032)
- Vietnam Airport Wireless Infrastructure Market (2026-2032)
- Thailand Airport Wireless Infrastructure Market (2026-2032)
- South Korea Airport Wireless Infrastructure Market (2026-2032)
- Romania Airport Wireless Infrastructure Market (2026-2032)
- Qatar Airport Wireless Infrastructure Market (2026-2032)
- Philippines Airport Wireless Infrastructure Market (2026-2032)
- Japan Airport Wireless Infrastructure Market (2026-2032)
- Taiwan Airport Winter Services Market (2026-2032)
- Vietnam Airport Winter Services Market (2026-2032)
Industry Events and Analyst Meet

HIMTEX 2026

India Refining Summit 2026

India EV Show 2026

EV tech India Expo 2026

Auto Tech Asia 2026
Whitepaper
- Middle East & Africa Commercial Security Market Click here to view more.
- Middle East & Africa Fire Safety Systems & Equipment Market Click here to view more.
- GCC Drone Market Click here to view more.
- Middle East Lighting Fixture Market Click here to view more.
- GCC Physical & Perimeter Security Market Click here to view more.