Austria Ferrosilicon Market (2026-2032) | Trends, Value, Outlook, Growth, Industry, Analysis, Revenue, Companies, Share, Size, Segmentation & Forecast
Market Forecast By Application (Deoxidizer, Inoculant, Others), By End-users (Carbon & other alloy steel, Stainless steel, Electric steel, Cast iron, Others) And Competitive Landscape
| Product Code: ETC4691707 | Publication Date: Nov 2023 | Updated Date: Apr 2026 | Product Type: Market Research Report | |
| Publisher: 6Wresearch | Author: Shubham Padhi | No. of Pages: 60 | No. of Figures: 30 | No. of Tables: 5 |
Austria Ferrosilicon Market Size (2020-2030)
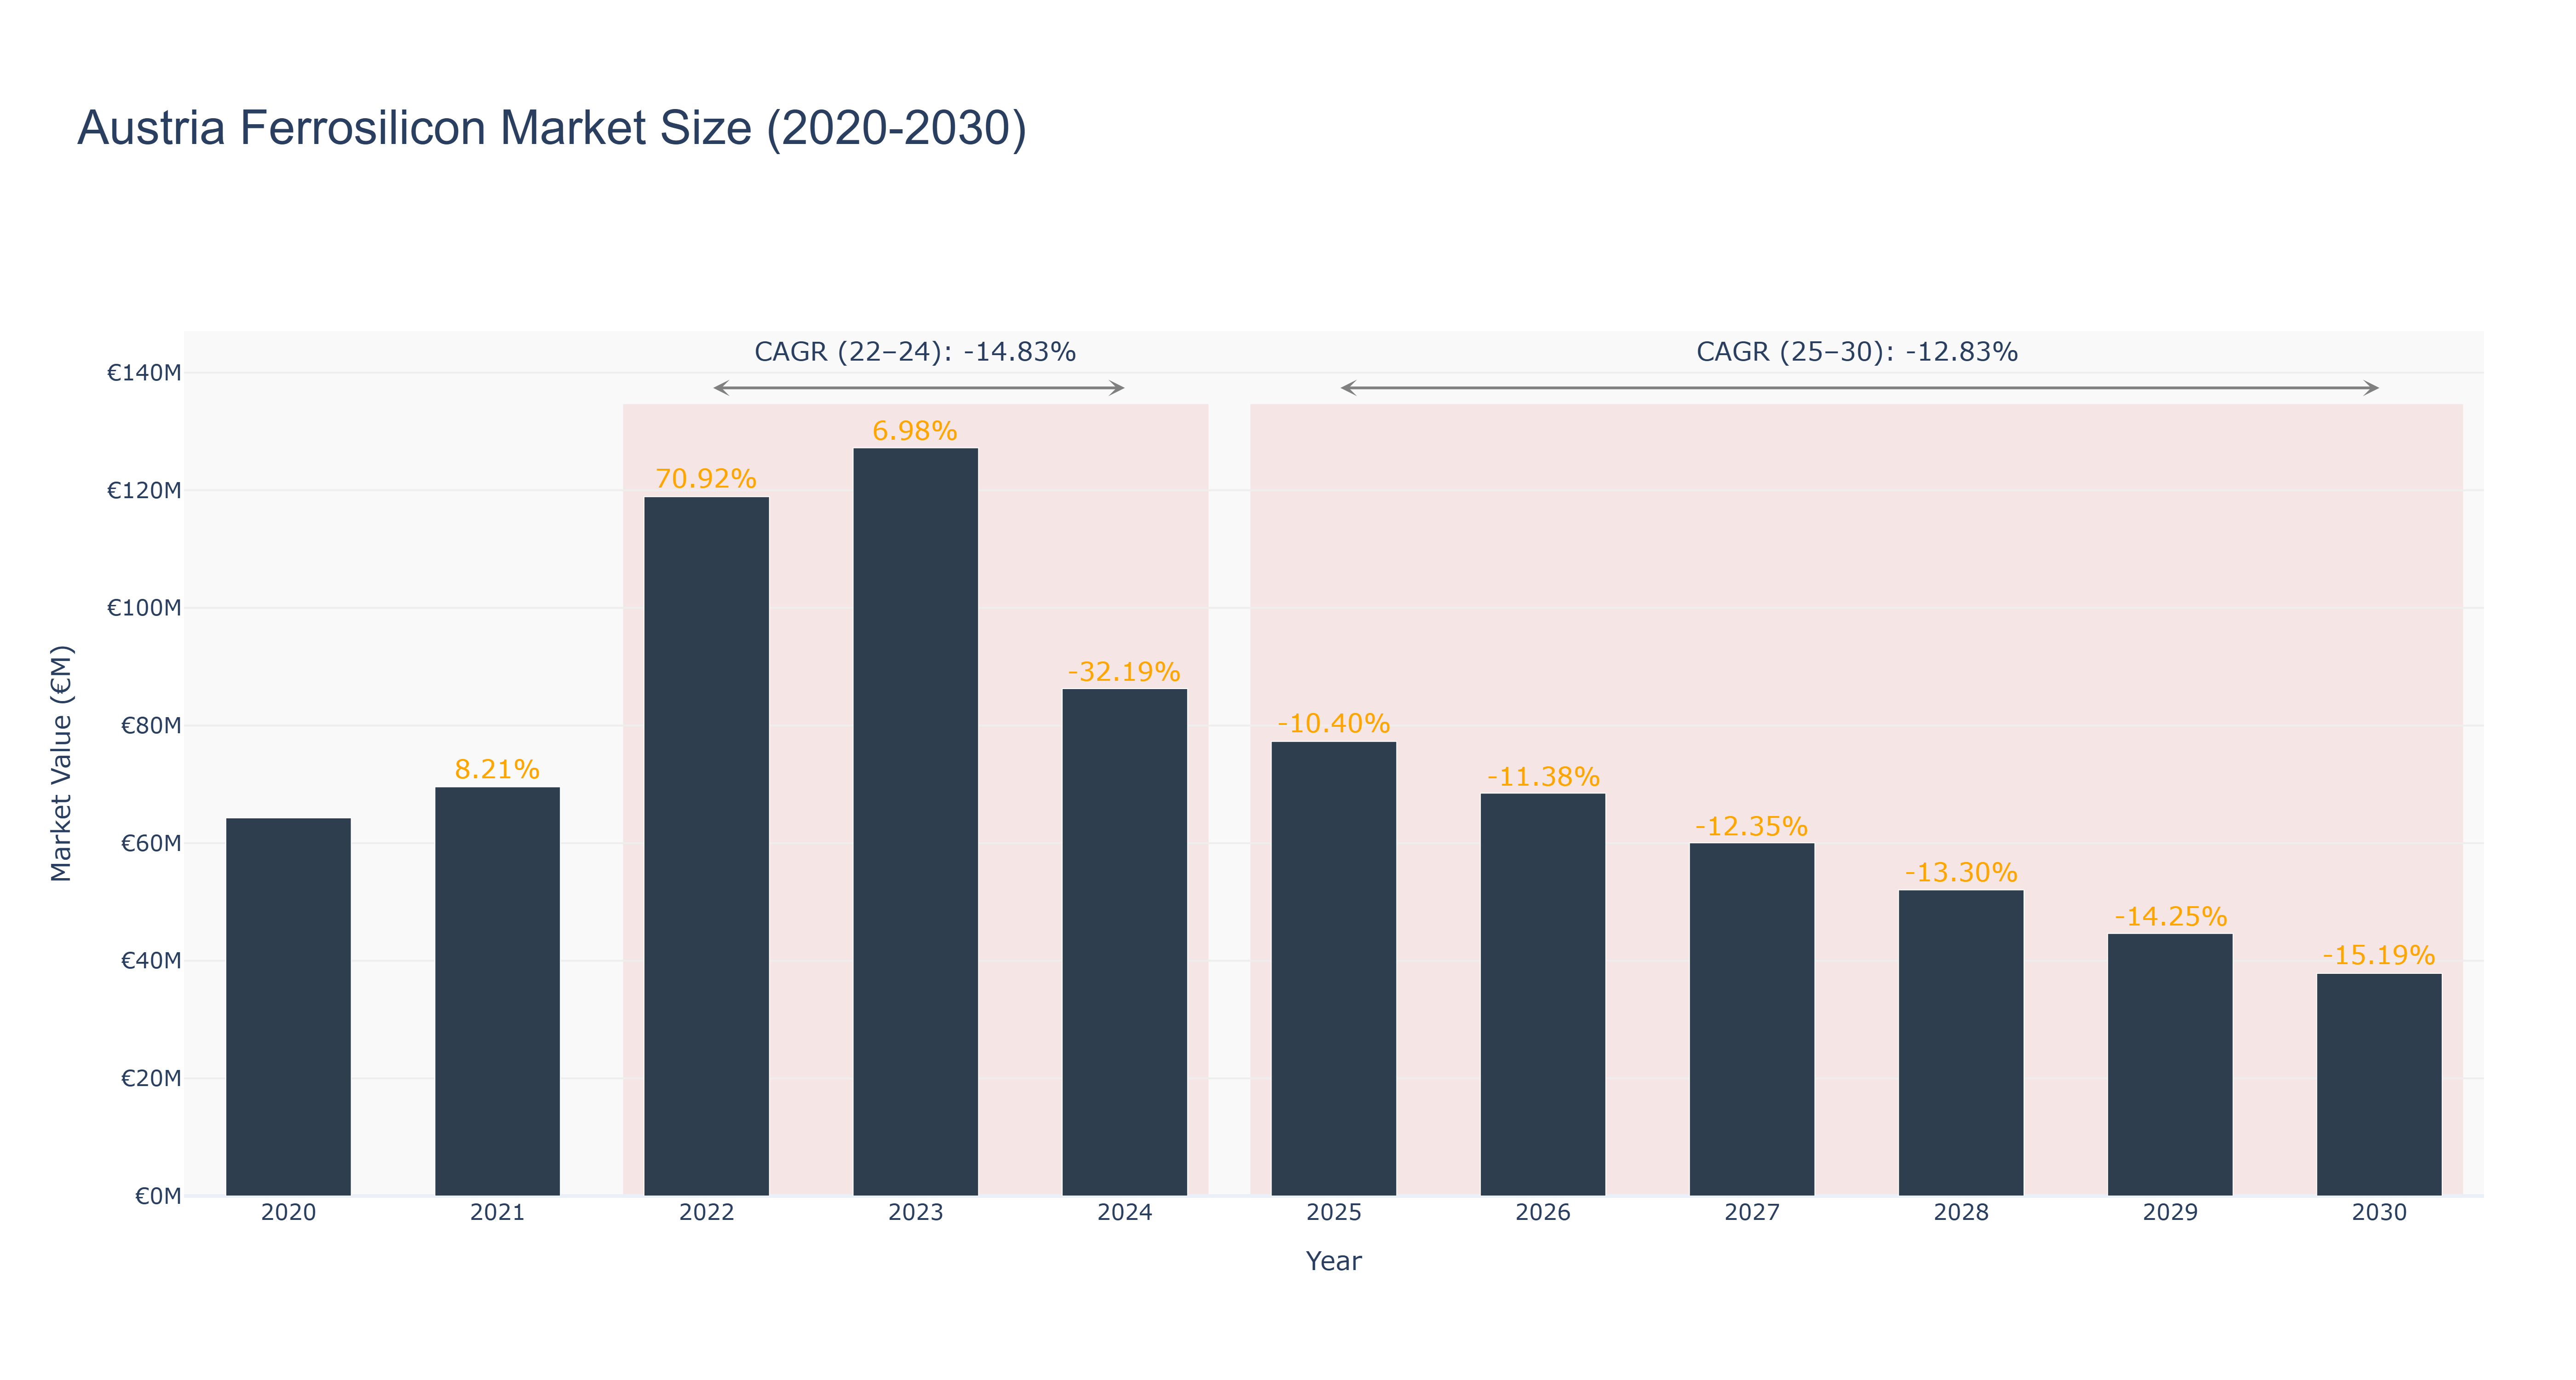
The Austria Ferrosilicon Market experienced a peak market size of €127.22 million in 2023. From 2020 to 2024, the market size decreased steadily, reaching €86.27 million in 2024. The forecasted market size from 2025 to 2030 shows a continued decline, with the market expected to reach €37.86 million in 2030. The CAGR for the period 2022-24 was -14.83%, while for 2025-30 it is projected to be -12.83%. The market downturn can be attributed to global economic challenges, fluctuating raw material prices, and evolving consumer preferences towards alternative materials. Despite the current market trend, future developments in Austria's ferrosilicon market include increased focus on sustainable production methods and technological advancements to enhance product quality and efficiency. These initiatives aim to revitalize the market and adapt to changing industry drivers for long-term sustainability and growth.
Austria Ferrosilicon Market: Production & Trade Performance (2019-2025)
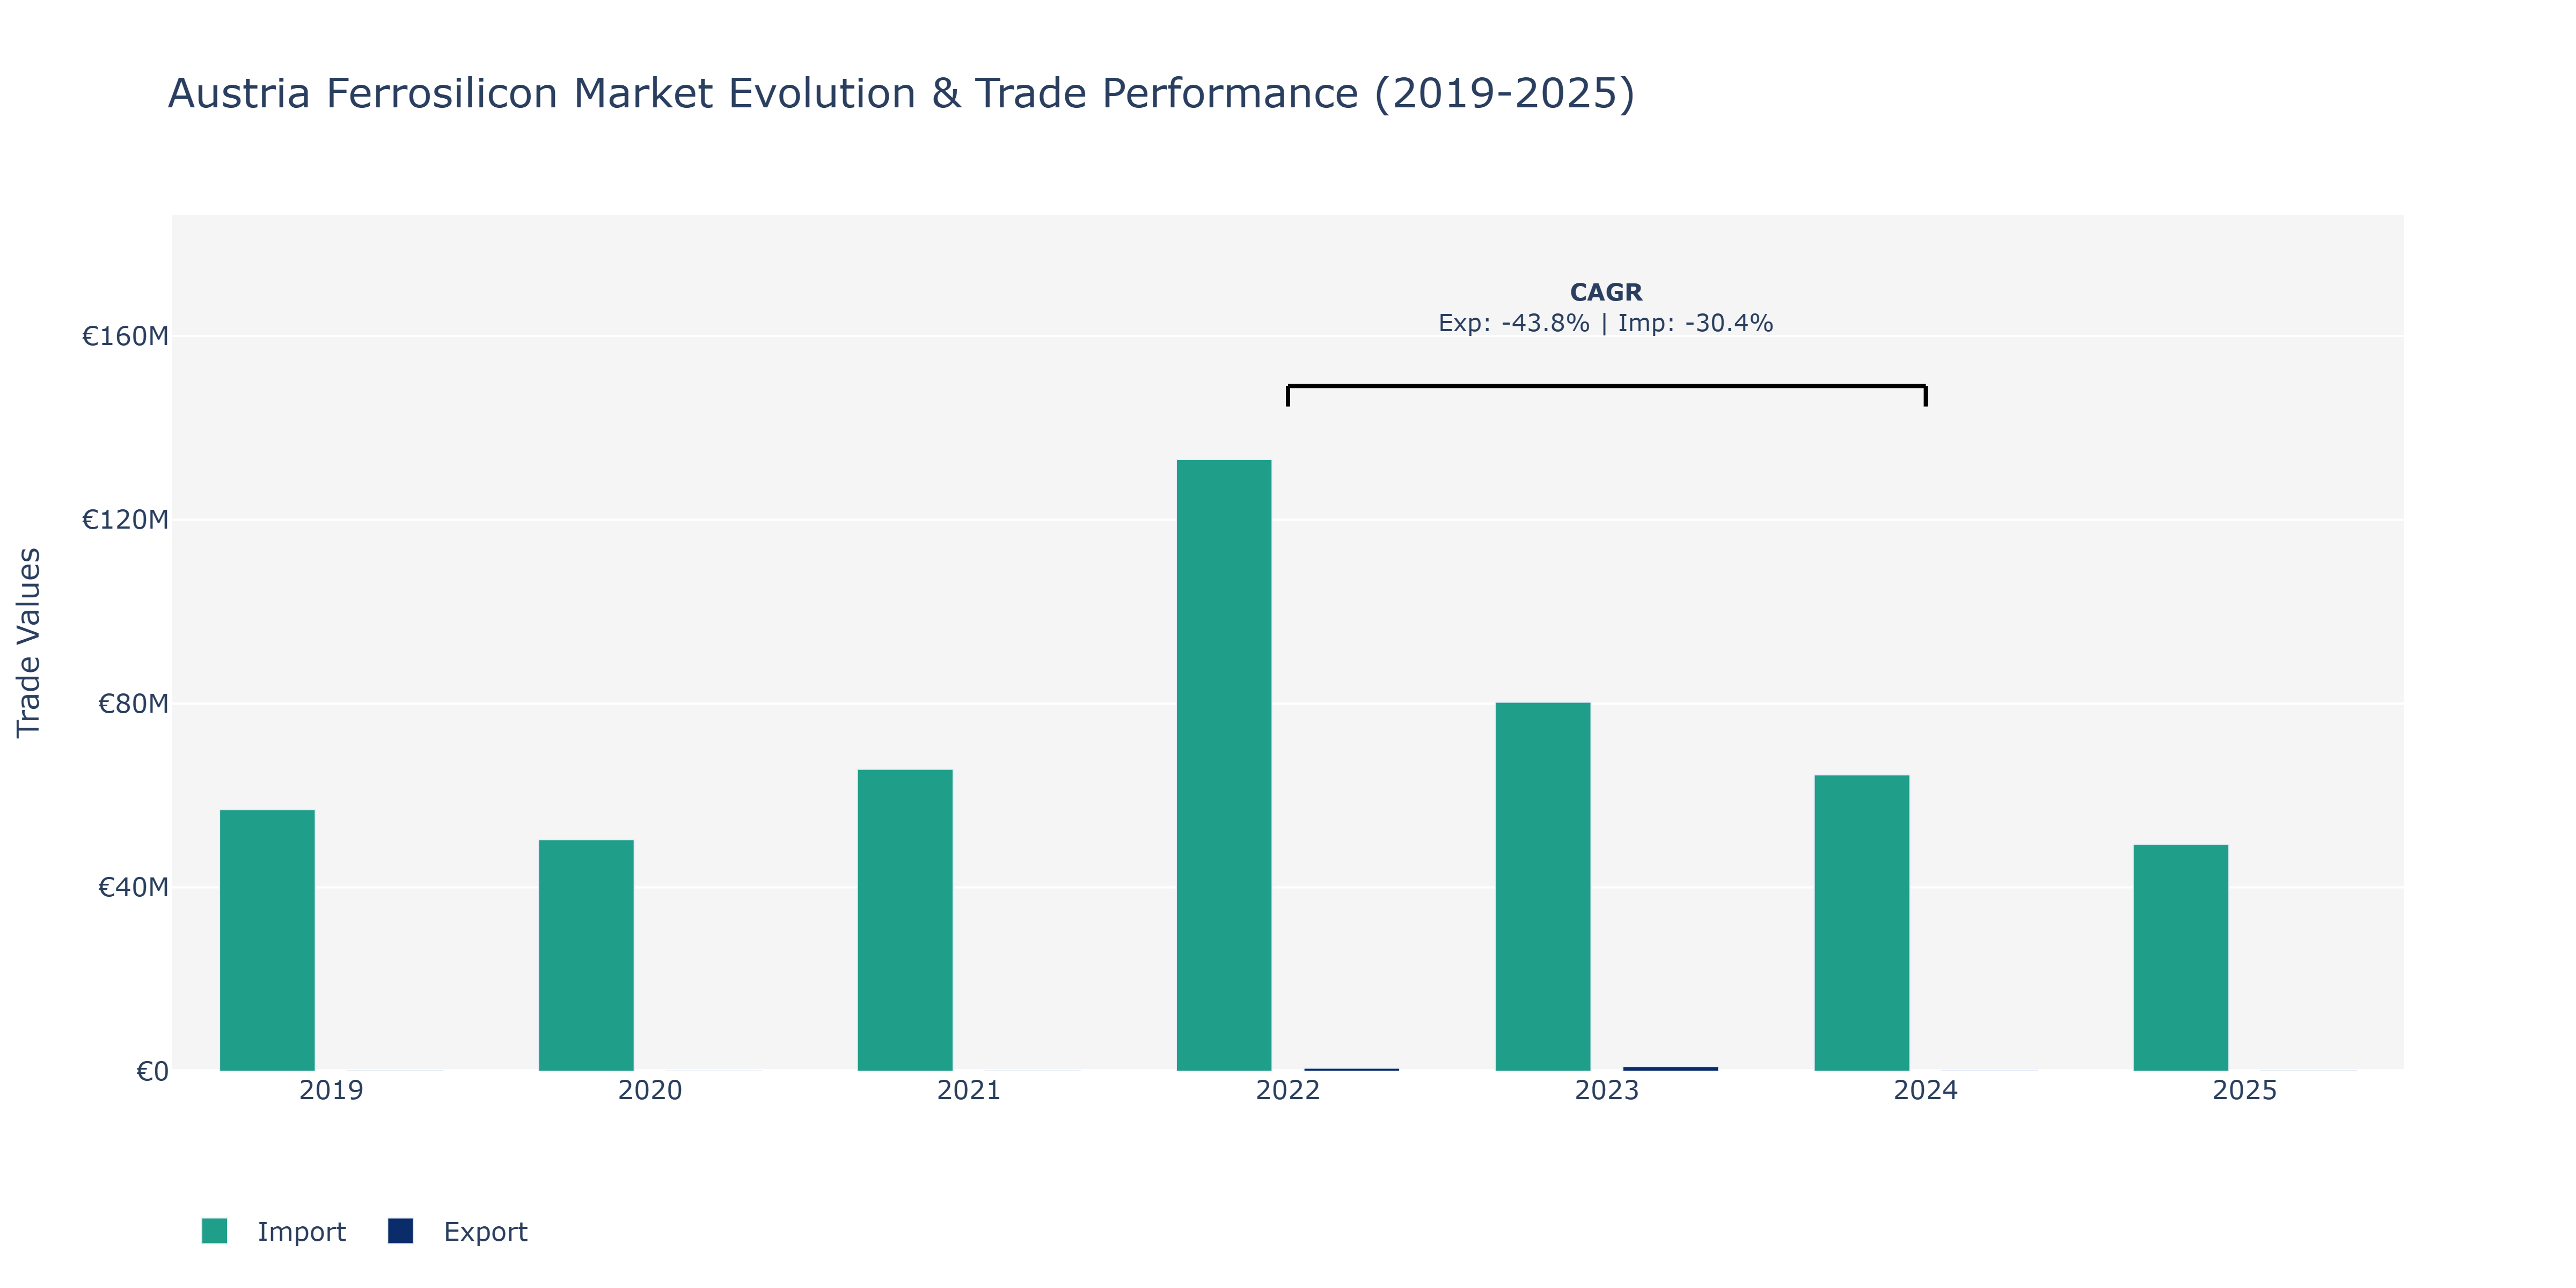
Between 2019 and 2025, Austria's Ferrosilicon market witnessed fluctuations in both exports and imports. In 2019, exports were at €137.63 thousand, dropping significantly to €62.92 thousand in 2020, before gradually recovering in 2021 to €93.32 thousand. The market peaked in 2023 with exports reaching €1.01 million, followed by a decline to €205.2 thousand in 2024 and settling at €154.26 thousand in 2025. Imports, on the other hand, were at €56.93 million in 2019, decreased to €50.4 million in 2020, then surged in 2022 to €133.13 million, experienced a decrease to €80.29 million in 2023, dropping further to €64.5 million in 2024, and finally declining to €49.38 million in 2025. These fluctuations can be attributed to various factors such as global demand shifts, trade policies, and economic conditions affecting the Ferrosilicon industry. The decline in exports in 2024 could be due to increased competition in the international market, while the fluctuations in imports might be influenced by changes in domestic consumption patterns and raw material availability.
Key Highlights of the Report:
- Austria Ferrosilicon Market Outlook
- Market Size of Austria Ferrosilicon Market, 2025
- Forecast of Austria Ferrosilicon Market, 2032
- Historical Data and Forecast of Austria Ferrosilicon Revenues & Volume for the Period 2022-2032F
- Austria Ferrosilicon Market Trend Evolution
- Austria Ferrosilicon Market Drivers and Challenges
- Austria Ferrosilicon Price Trends
- Austria Ferrosilicon Porter`s Five Forces
- Austria Ferrosilicon Industry Life Cycle
- Historical Data and Forecast of Austria Ferrosilicon Market Revenues & Volume By Application for the Period 2022-2032F
- Historical Data and Forecast of Austria Ferrosilicon Market Revenues & Volume By Deoxidizer for the Period 2022-2032F
- Historical Data and Forecast of Austria Ferrosilicon Market Revenues & Volume By Inoculant for the Period 2022-2032F
- Historical Data and Forecast of Austria Ferrosilicon Market Revenues & Volume By Others for the Period 2022-2032F
- Historical Data and Forecast of Austria Ferrosilicon Market Revenues & Volume By End-users for the Period 2022-2032F
- Historical Data and Forecast of Austria Ferrosilicon Market Revenues & Volume By Carbon & other alloy steel for the Period 2022-2032F
- Historical Data and Forecast of Austria Ferrosilicon Market Revenues & Volume By Stainless steel for the Period 2022-2032F
- Historical Data and Forecast of Austria Ferrosilicon Market Revenues & Volume By Electric steel for the Period 2022-2032F
- Historical Data and Forecast of Austria Ferrosilicon Market Revenues & Volume By Cast iron for the Period 2022-2032F
- Historical Data and Forecast of Austria Ferrosilicon Market Revenues & Volume By Others for the Period 2022-2032F
- Austria Ferrosilicon Import Export Trade Statistics
- Market Opportunity Assessment By Application
- Market Opportunity Assessment By End-users
- Austria Ferrosilicon Top Companies Market Share
- Austria Ferrosilicon Competitive Benchmarking By Technical and Operational Parameters
- Austria Ferrosilicon Company Profiles
- Austria Ferrosilicon Key Strategic Recommendations
Frequently Asked Questions About the Market Study (FAQs):
6Wresearch actively monitors the Austria Ferrosilicon Market and publishes its comprehensive annual report, highlighting emerging trends, growth drivers, revenue analysis, and forecast outlook. Our insights help businesses to make data-backed strategic decisions with ongoing market dynamics. Our analysts track relevent industries related to the Austria Ferrosilicon Market, allowing our clients with actionable intelligence and reliable forecasts tailored to emerging regional needs.
Yes, we provide customisation as per your requirements. To learn more, feel free to contact us on sales@6wresearch.com
1 Executive Summary |
2 Introduction |
2.1 Key Highlights of the Report |
2.2 Report Description |
2.3 Market Scope & Segmentation |
2.4 Research Methodology |
2.5 Assumptions |
3 Austria Ferrosilicon Market Overview |
3.1 Austria Country Macro Economic Indicators |
3.2 Austria Ferrosilicon Market Revenues & Volume, 2022 & 2032F |
3.3 Austria Ferrosilicon Market - Industry Life Cycle |
3.4 Austria Ferrosilicon Market - Porter's Five Forces |
3.5 Austria Ferrosilicon Market Revenues & Volume Share, By Application, 2022 & 2032F |
3.6 Austria Ferrosilicon Market Revenues & Volume Share, By End-users, 2022 & 2032F |
4 Austria Ferrosilicon Market Dynamics |
4.1 Impact Analysis |
4.2 Market Drivers |
4.2.1 Growth in the steel industry, as ferrosilicon is used as a deoxidizer and alloying element in steel production. |
4.2.2 Increasing demand for ferrosilicon in the manufacturing of stainless steel due to its corrosion resistance properties. |
4.2.3 Technological advancements leading to the development of new applications for ferrosilicon in the automotive and electronics industries. |
4.3 Market Restraints |
4.3.1 Fluctuating raw material prices, such as silicon and iron ore, impacting the production cost of ferrosilicon. |
4.3.2 Environmental regulations and sustainability concerns affecting the production processes of ferrosilicon. |
4.3.3 Competition from substitute materials like ferromanganese and ferrochrome posing a challenge to the market growth. |
5 Austria Ferrosilicon Market Trends |
6 Austria Ferrosilicon Market Segmentations |
6.1 Austria Ferrosilicon Market, By Application |
6.1.1 Overview and Analysis |
6.1.2 Austria Ferrosilicon Market Revenues & Volume, By Deoxidizer, 2022-2032F |
6.1.3 Austria Ferrosilicon Market Revenues & Volume, By Inoculant, 2022-2032F |
6.1.4 Austria Ferrosilicon Market Revenues & Volume, By Others, 2022-2032F |
6.2 Austria Ferrosilicon Market, By End-users |
6.2.1 Overview and Analysis |
6.2.2 Austria Ferrosilicon Market Revenues & Volume, By Carbon & other alloy steel, 2022-2032F |
6.2.3 Austria Ferrosilicon Market Revenues & Volume, By Stainless steel, 2022-2032F |
6.2.4 Austria Ferrosilicon Market Revenues & Volume, By Electric steel, 2022-2032F |
6.2.5 Austria Ferrosilicon Market Revenues & Volume, By Cast iron, 2022-2032F |
6.2.6 Austria Ferrosilicon Market Revenues & Volume, By Others, 2022-2032F |
7 Austria Ferrosilicon Market Import-Export Trade Statistics |
7.1 Austria Ferrosilicon Market Export to Major Countries |
7.2 Austria Ferrosilicon Market Imports from Major Countries |
8 Austria Ferrosilicon Market Key Performance Indicators |
8.1 Average selling price of ferrosilicon indicating market pricing trends. |
8.2 Rate of adoption of ferrosilicon in new applications showcasing market expansion opportunities. |
8.3 Research and development investment in innovative ferrosilicon production methods reflecting future market competitiveness. |
9 Austria Ferrosilicon Market - Opportunity Assessment |
9.1 Austria Ferrosilicon Market Opportunity Assessment, By Application, 2022 & 2032F |
9.2 Austria Ferrosilicon Market Opportunity Assessment, By End-users, 2022 & 2032F |
10 Austria Ferrosilicon Market - Competitive Landscape |
10.1 Austria Ferrosilicon Market Revenue Share, By Companies, 2025 |
10.2 Austria Ferrosilicon Market Competitive Benchmarking, By Operating and Technical Parameters |
11 Company Profiles |
12 Recommendations | 13 Disclaimer |
Export potential assessment - trade Analytics for 2030
Export potential enables firms to identify high-growth global markets with greater confidence by combining advanced trade intelligence with a structured quantitative methodology. The framework analyzes emerging demand trends and country-level import patterns while integrating macroeconomic and trade datasets such as GDP and population forecasts, bilateral import–export flows, tariff structures, elasticity differentials between developed and developing economies, geographic distance, and import demand projections. Using weighted trade values from 2020–2024 as the base period to project country-to-country export potential for 2030, these inputs are operationalized through calculated drivers such as gravity model parameters, tariff impact factors, and projected GDP per-capita growth. Through an analysis of hidden potentials, demand hotspots, and market conditions that are most favorable to success, this method enables firms to focus on target countries, maximize returns, and global expansion with data, backed by accuracy.
By factoring in the projected importer demand gap that is currently unmet and could be potential opportunity, it identifies the potential for the Exporter (Country) among 190 countries, against the general trade analysis, which identifies the biggest importer or exporter.
To discover high-growth global markets and optimize your business strategy:
Click Here
Pricing
- Single User License$ 1,995
- Department License$ 2,400
- Site License$ 3,120
- Global License$ 3,795

Search
Thought Leadership and Analyst Meet


Our Clients
Latest Reports
- Canada Cloud CFD Market (2026-2032) | Size & Revenue, Industry, Growth, Competitive Landscape, Forecast, Segmentation, Value, Outlook, Trends, Share, Analysis, Companies
- Taiwan Food Delivery Platform Market (2026-2032) | Companies, Outlook, Analysis, Trends, Value, Revenue, Segmentation, Share, Forecast, Competitive Landscape, Growth, Size & Forecast
- United Kingdom (UK) Long-term Care Insurance Market (2026-2032) | Growth, Share, Consumer Insights, Drivers, Opportunities, Competition, Pricing Analysis, Segments, Restraints, Companies, Competitive, Value, Outlook, Size, Demand, Analysis, Challenges, Strategic Insights, Investment Trends, Revenue, Trends, Supply, Forecast
- United Kingdom (UK) Long Term Care Market (2026-2032) | Companies, Outlook, Analysis, Trends, Value, Revenue, Segmentation, Share, Forecast, Competitive Landscape, Growth, Size & Forecast
- Iraq Insulation and Waterproofing Market (2026-2032) | Outlook, Drivers, Growth, Size, Share, Industry, Revenue, Trends, Demand, Competitive, Strategic Insights, Opportunities, Segments, Companies, Challenges, Strategy, Consumer Insights, Analysis, Investment Trends, Value, Segmentation, Forecast, Restraints
- India Switchgear Market Outlook (2026-2032) | Size, Share, Trends, Growth, Revenue, Forecast, Analysis, Value, Outlook
- Pakistan Contraceptive Implants Market (2025-2031) | Demand, Growth, Size, Share, Industry, Pricing Analysis, Competitive, Strategic Insights, Strategy, Consumer Insights, Analysis, Investment Trends, Opportunities, Revenue, Segments, Value, Segmentation, Supply, Forecast, Restraints, Outlook, Competition, Drivers, Trends, Companies, Challenges
- Sri Lanka Packaging Market (2026-2032) | Outlook, Competition, Drivers, Trends, Demand, Pricing Analysis, Competitive, Strategic Insights, Companies, Challenges, Strategy, Consumer Insights, Analysis, Investment Trends, Opportunities, Growth, Size, Share, Industry, Revenue, Segments, Value, Segmentation, Supply, Forecast, Restraints
- India Kids Watches Market (2026-2032) | Strategy, Consumer Insights, Analysis, Investment Trends, Opportunities, Growth, Size, Share, Industry, Revenue, Segments, Value, Segmentation, Supply, Forecast, Restraints, Outlook, Competition, Drivers, Trends, Demand, Pricing Analysis, Competitive, Strategic Insights, Companies, Challenges
- Saudi Arabia Core Assurance Service Market (2025-2031) | Strategy, Consumer Insights, Analysis, Investment Trends, Opportunities, Growth, Size, Share, Industry, Revenue, Segments, Value, Segmentation, Supply, Forecast, Restraints, Outlook, Competition, Drivers, Trends, Demand, Pricing Analysis, Competitive, Strategic Insights, Companies, Challenges
Industry Events and Analyst Meet

India EV Show 2026

EV tech India Expo 2026

Auto Tech Asia 2026

Battery Tech India 2026

Smart Production Solutions Guangzhou 2026
Whitepaper
- Middle East & Africa Commercial Security Market Click here to view more.
- Middle East & Africa Fire Safety Systems & Equipment Market Click here to view more.
- GCC Drone Market Click here to view more.
- Middle East Lighting Fixture Market Click here to view more.
- GCC Physical & Perimeter Security Market Click here to view more.
6WResearch In News
- Doha a strategic location for EV manufacturing hub: IPA Qatar
- Demand for luxury TVs surging in the GCC, says Samsung
- Empowering Growth: The Thriving Journey of Bangladesh’s Cable Industry
- Demand for luxury TVs surging in the GCC, says Samsung
- Video call with a traditional healer? Once unthinkable, it’s now common in South Africa
- Intelligent Buildings To Smooth GCC’s Path To Net Zero