Austria Paving Stone Market (2026-2032) | Growth, Size, Outlook, Segments, Pricing Analysis, Strategic Insights, Consumer Insights, Analysis, Restraints, Industry, Supply, Investment Trends, Demand, Drivers, Challenges, Strategy, Share, Value, Competitive, Companies, Revenue, Forecast, Opportunities, Competition, Segmentation, Trends
Market Forecast By Type (Concrete Pavers, Brick Pavers, Stone Pavers, Rubber Pavers, Porcelain Pavers), By Material (Cement, Clay, Granite, Recycled Rubber, Porcelain), By Application (Driveways, Walkways, Patios, Garden Paths, Pool Decks), By Installation Method (Dry Laid, Wet Laid, Mortared, Permeable, Floating), By Finish (Polished, Tumbled, Flamed, Textured, Matte) And Competitive Landscape
| Product Code: ETC10745214 | Publication Date: Apr 2025 | Updated Date: Apr 2026 | Product Type: Market Research Report | |
| Publisher: 6Wresearch | No. of Pages: 65 | No. of Figures: 34 | No. of Tables: 19 | |
Austria Paving Stone Market Size (2020-2030)
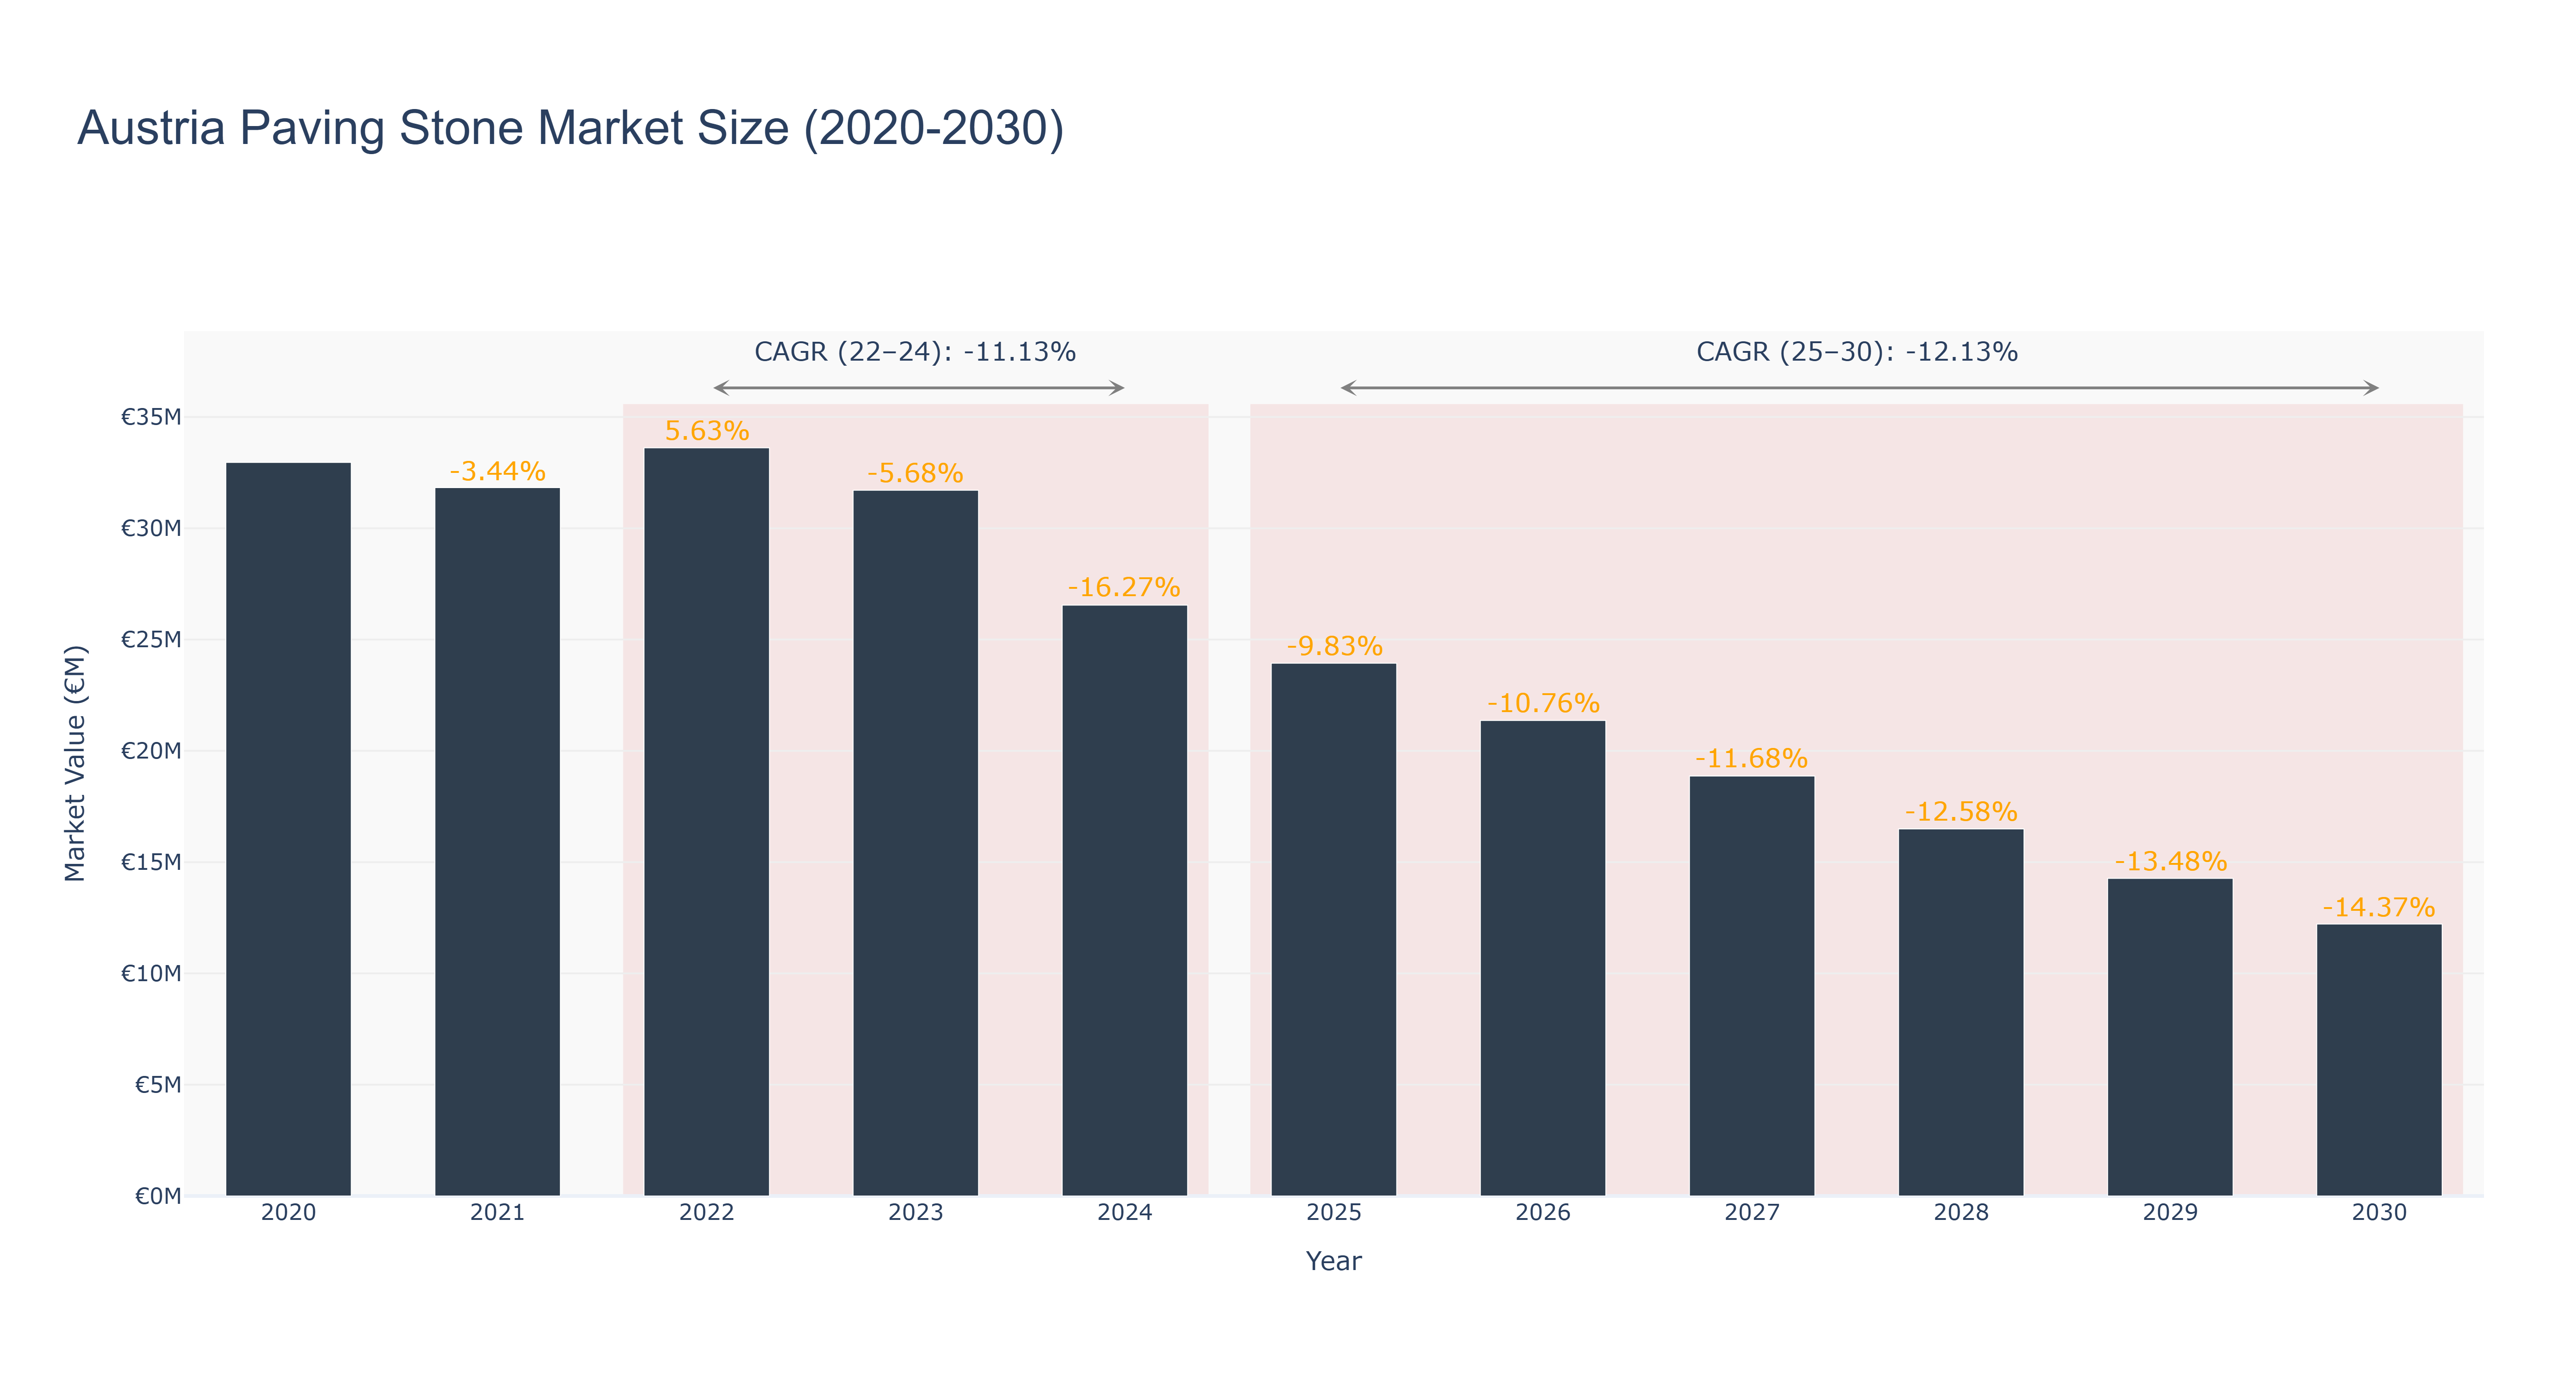
The Austria Paving Stone Market has seen a decline in market size over the past decade. The peak market size was in 2020 at €32.96 million, followed by a steady decrease to €12.22 million in 2030. The CAGR from 2022 to 2024 was -11.13%, while the CAGR from 2025 to 2030 is projected at -12.13%. The market faced challenges due to economic downturns and reduced infrastructure investments impacting demand for paving stones. Looking ahead, the market is expected to focus on sustainable and innovative paving solutions to attract customers and drive growth. Recent developments include partnerships with green technology companies to introduce eco-friendly paving materials, which align with the country's sustainability goals. Future projects may involve digitalization initiatives to enhance market efficiency and customer experience.
Austria Paving Stone Market: Production & Trade Performance (2019-2025)
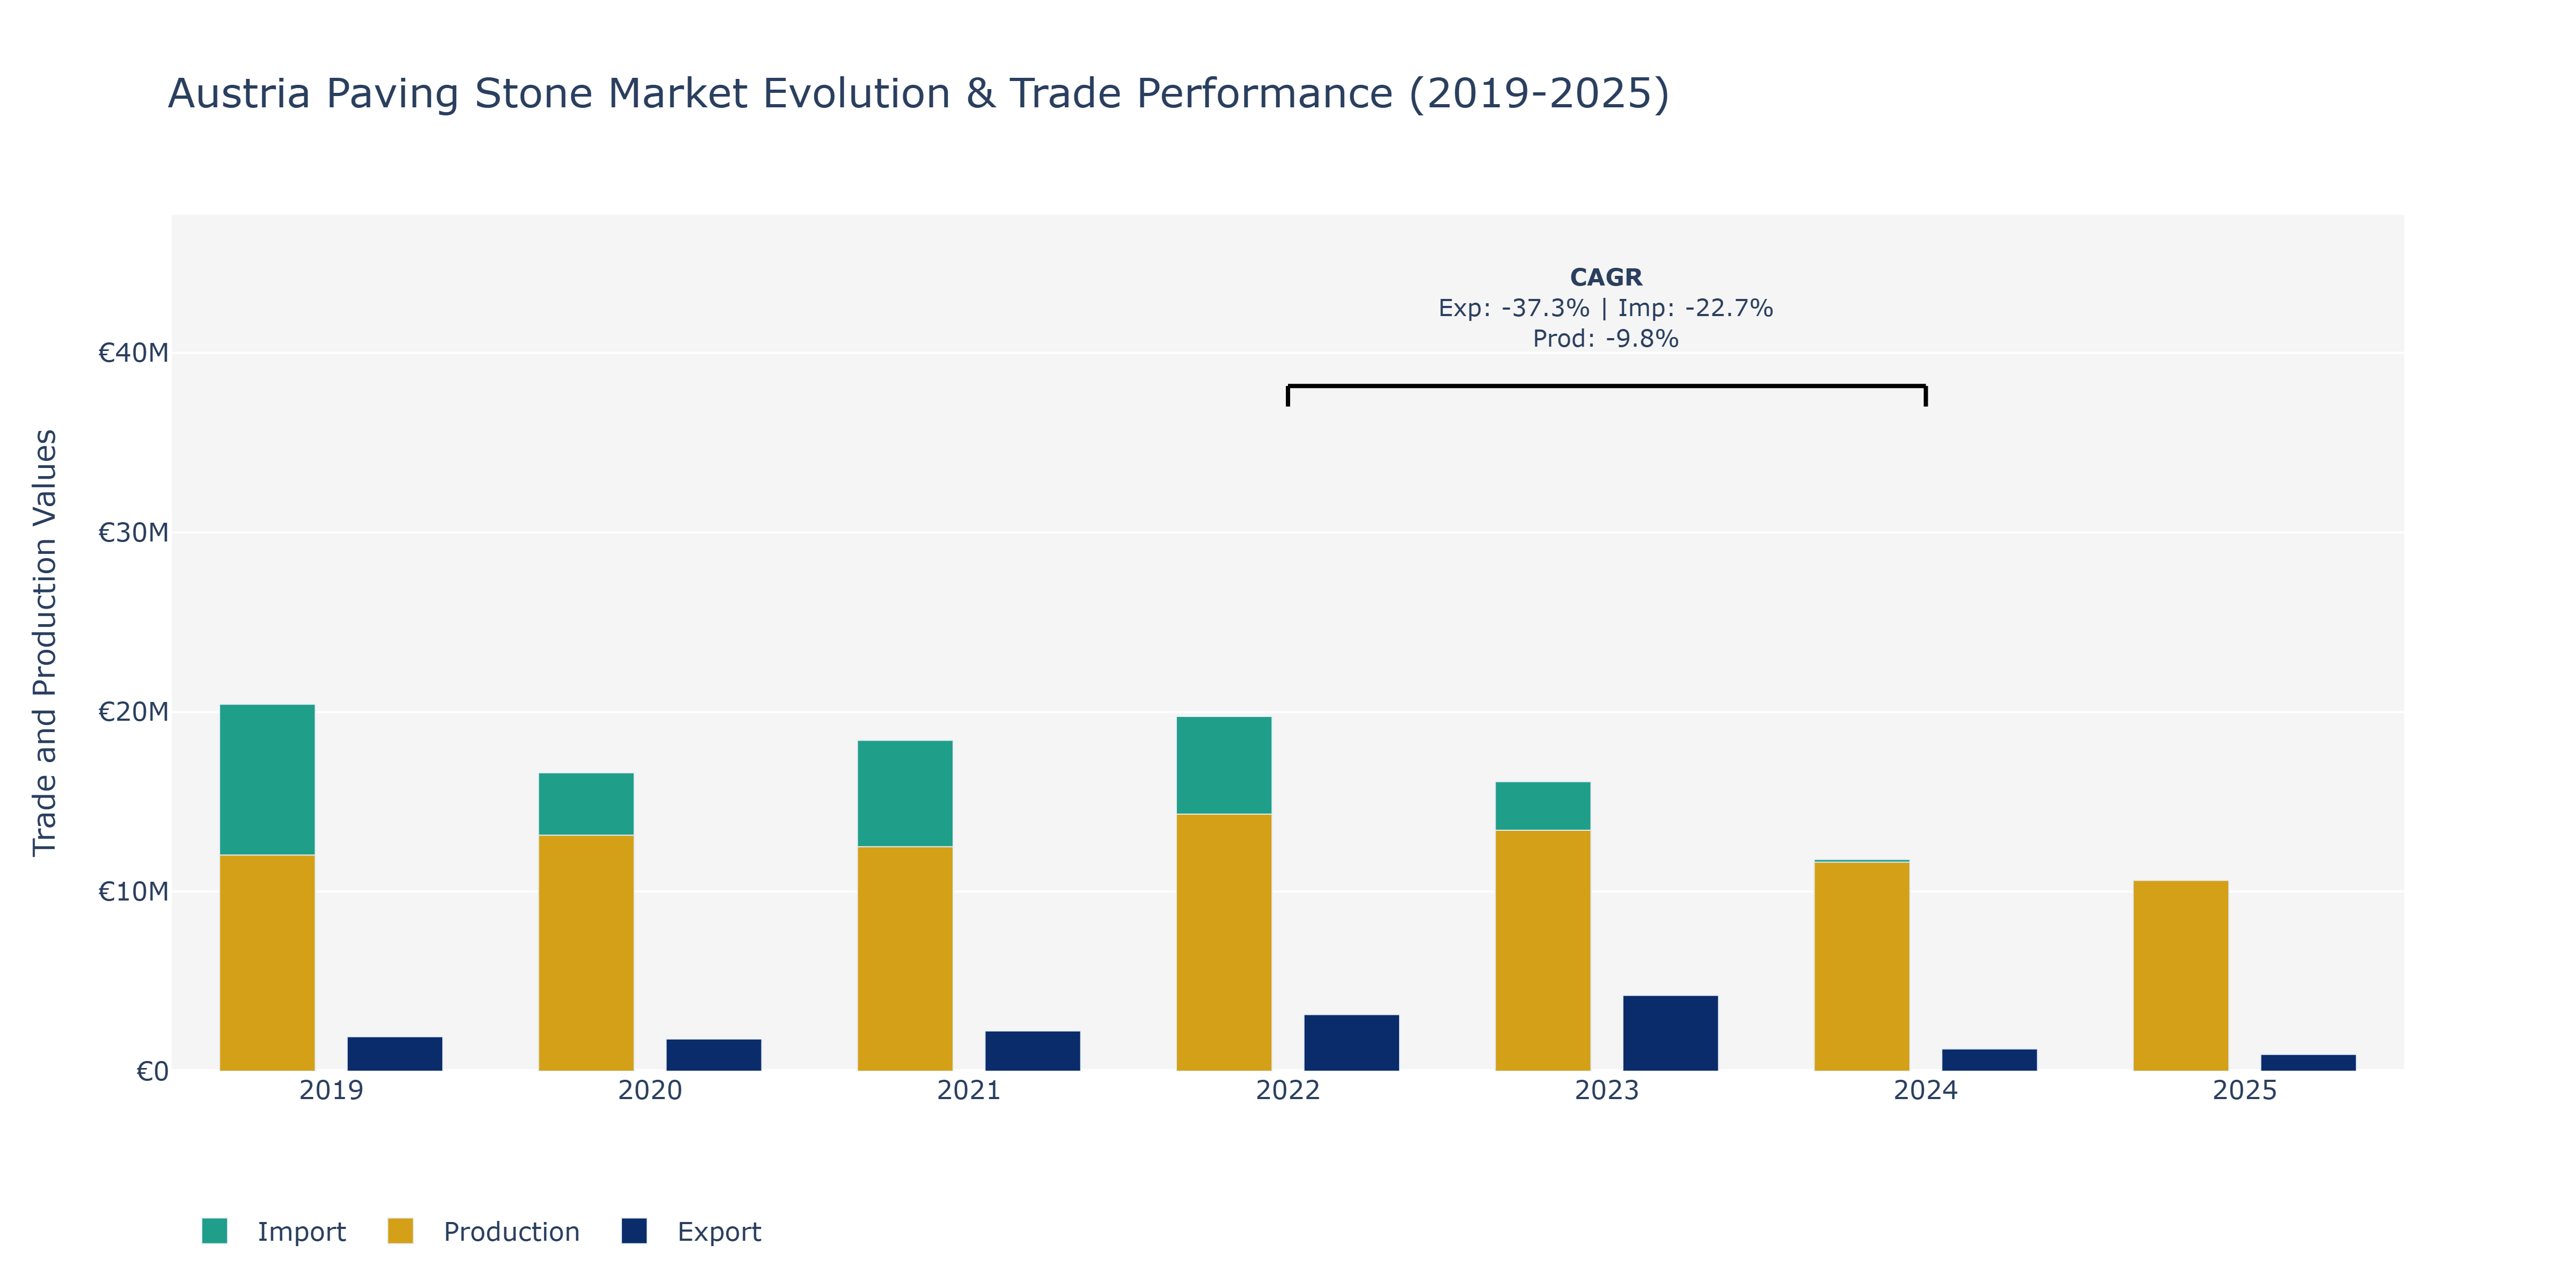
Between 2019 and 2025, the Austria Paving Stone Market witnessed varying trends in Exports, Imports, and Production. Exports started at €1.92 million in 2019, saw a significant increase to €4.22 million in 2023, before dropping to €932.16 thousand in 2025. Imports, which stood at €20.43 million in 2019, showed fluctuations, reaching a peak of €19.75 million in 2022, then decreasing to €9.49 million in 2025. Production value started at €12.04 billion in 2019, experienced a decline to €11.64 billion in 2024, and stood at €10.62 billion in 2025. The market's production capacity experienced a negative Compound Annual Growth Rate (CAGR) of -9.82% between 2022 and 2024, potentially influenced by fluctuating demand, raw material costs, and evolving construction trends in Austria. The fluctuations in exports and imports could be attributed to changing global market demands, trade agreements, and competitive pricing strategies in the paving stone industry. To adapt, market players may need to focus on enhancing product quality, exploring new markets, and optimizing supply chain efficiencies to navigate these turbulent market conditions effectively.
Key Highlights of the Report:
- Austria Paving Stone Market Outlook
- Market Size of Austria Paving Stone Market, 2025
- Forecast of Austria Paving Stone Market, 2032
- Historical Data and Forecast of Austria Paving Stone Revenues & Volume for the Period 2022-2032F
- Austria Paving Stone Market Trend Evolution
- Austria Paving Stone Market Drivers and Challenges
- Austria Paving Stone Price Trends
- Austria Paving Stone Porter's Five Forces
- Austria Paving Stone Industry Life Cycle
- Historical Data and Forecast of Austria Paving Stone Market Revenues & Volume By Type for the Period 2022-2032F
- Historical Data and Forecast of Austria Paving Stone Market Revenues & Volume By Concrete Pavers for the Period 2022-2032F
- Historical Data and Forecast of Austria Paving Stone Market Revenues & Volume By Brick Pavers for the Period 2022-2032F
- Historical Data and Forecast of Austria Paving Stone Market Revenues & Volume By Stone Pavers for the Period 2022-2032F
- Historical Data and Forecast of Austria Paving Stone Market Revenues & Volume By Rubber Pavers for the Period 2022-2032F
- Historical Data and Forecast of Austria Paving Stone Market Revenues & Volume By Porcelain Pavers for the Period 2022 - 2032F
- Historical Data and Forecast of Austria Paving Stone Market Revenues & Volume By Material for the Period 2022-2032F
- Historical Data and Forecast of Austria Paving Stone Market Revenues & Volume By Cement for the Period 2022-2032F
- Historical Data and Forecast of Austria Paving Stone Market Revenues & Volume By Clay for the Period 2022-2032F
- Historical Data and Forecast of Austria Paving Stone Market Revenues & Volume By Granite for the Period 2022-2032F
- Historical Data and Forecast of Austria Paving Stone Market Revenues & Volume By Recycled Rubber for the Period 2022-2032F
- Historical Data and Forecast of Austria Paving Stone Market Revenues & Volume By Porcelain for the Period 2022 - 2032F
- Historical Data and Forecast of Austria Paving Stone Market Revenues & Volume By Application for the Period 2022-2032F
- Historical Data and Forecast of Austria Paving Stone Market Revenues & Volume By Driveways for the Period 2022-2032F
- Historical Data and Forecast of Austria Paving Stone Market Revenues & Volume By Walkways for the Period 2022-2032F
- Historical Data and Forecast of Austria Paving Stone Market Revenues & Volume By Patios for the Period 2022-2032F
- Historical Data and Forecast of Austria Paving Stone Market Revenues & Volume By Garden Paths for the Period 2022-2032F
- Historical Data and Forecast of Austria Paving Stone Market Revenues & Volume By Pool Decks for the Period 2022 - 2032F
- Historical Data and Forecast of Austria Paving Stone Market Revenues & Volume By Installation Method for the Period 2022-2032F
- Historical Data and Forecast of Austria Paving Stone Market Revenues & Volume By Dry Laid for the Period 2022-2032F
- Historical Data and Forecast of Austria Paving Stone Market Revenues & Volume By Wet Laid for the Period 2022-2032F
- Historical Data and Forecast of Austria Paving Stone Market Revenues & Volume By Mortared for the Period 2022-2032F
- Historical Data and Forecast of Austria Paving Stone Market Revenues & Volume By Permeable for the Period 2022-2032F
- Historical Data and Forecast of Austria Paving Stone Market Revenues & Volume By Floating for the Period 2022 - 2032F
- Historical Data and Forecast of Austria Paving Stone Market Revenues & Volume By Finish for the Period 2022-2032F
- Historical Data and Forecast of Austria Paving Stone Market Revenues & Volume By Polished for the Period 2022-2032F
- Historical Data and Forecast of Austria Paving Stone Market Revenues & Volume By Tumbled for the Period 2022-2032F
- Historical Data and Forecast of Austria Paving Stone Market Revenues & Volume By Flamed for the Period 2022-2032F
- Historical Data and Forecast of Austria Paving Stone Market Revenues & Volume By Textured for the Period 2022 - 2032F
- Historical Data and Forecast of Austria Paving Stone Market Revenues & Volume By Matte for the Period 2022 - 2032F
- Austria Paving Stone Import Export Trade Statistics
- Market Opportunity Assessment By Type
- Market Opportunity Assessment By Material
- Market Opportunity Assessment By Application
- Market Opportunity Assessment By Installation Method
- Market Opportunity Assessment By Finish
- Austria Paving Stone Top Companies Market Share
- Austria Paving Stone Competitive Benchmarking By Technical and Operational Parameters
- Austria Paving Stone Company Profiles
- Austria Paving Stone Key Strategic Recommendations
Frequently Asked Questions About the Market Study (FAQs):
6Wresearch actively monitors the Austria Paving Stone Market and publishes its comprehensive annual report, highlighting emerging trends, growth drivers, revenue analysis, and forecast outlook. Our insights help businesses to make data-backed strategic decisions with ongoing market dynamics. Our analysts track relevent industries related to the Austria Paving Stone Market, allowing our clients with actionable intelligence and reliable forecasts tailored to emerging regional needs.
Yes, we provide customisation as per your requirements. To learn more, feel free to contact us on sales@6wresearch.com
1 Executive Summary |
2 Introduction |
2.1 Key Highlights of the Report |
2.2 Report Description |
2.3 Market Scope & Segmentation |
2.4 Research Methodology |
2.5 Assumptions |
3 Austria Paving Stone Market Overview |
3.1 Austria Country Macro Economic Indicators |
3.2 Austria Paving Stone Market Revenues & Volume, 2022 & 2032F |
3.3 Austria Paving Stone Market - Industry Life Cycle |
3.4 Austria Paving Stone Market - Porter's Five Forces |
3.5 Austria Paving Stone Market Revenues & Volume Share, By Type, 2022 & 2032F |
3.6 Austria Paving Stone Market Revenues & Volume Share, By Material, 2022 & 2032F |
3.7 Austria Paving Stone Market Revenues & Volume Share, By Application, 2022 & 2032F |
3.8 Austria Paving Stone Market Revenues & Volume Share, By Installation Method, 2022 & 2032F |
3.9 Austria Paving Stone Market Revenues & Volume Share, By Finish, 2022 & 2032F |
4 Austria Paving Stone Market Dynamics |
4.1 Impact Analysis |
4.2 Market Drivers |
4.2.1 Increasing urbanization and infrastructure development projects leading to higher demand for paving stones in Austria. |
4.2.2 Growing focus on sustainable and eco-friendly construction practices, driving the adoption of paving stones. |
4.2.3 Rising disposable income and changing consumer preferences towards aesthetically pleasing outdoor spaces, boosting the demand for paving stones. |
4.3 Market Restraints |
4.3.1 Fluctuating raw material prices impacting the production costs of paving stones. |
4.3.2 Seasonal variations affecting the demand for paving stones in Austria. |
4.3.3 Stringent regulations and environmental concerns related to the extraction and production of paving stones. |
5 Austria Paving Stone Market Trends |
6 Austria Paving Stone Market, By Types |
6.1 Austria Paving Stone Market, By Type |
6.1.1 Overview and Analysis |
6.1.2 Austria Paving Stone Market Revenues & Volume, By Type, 2022 - 2032F |
6.1.3 Austria Paving Stone Market Revenues & Volume, By Concrete Pavers, 2022 - 2032F |
6.1.4 Austria Paving Stone Market Revenues & Volume, By Brick Pavers, 2022 - 2032F |
6.1.5 Austria Paving Stone Market Revenues & Volume, By Stone Pavers, 2022 - 2032F |
6.1.6 Austria Paving Stone Market Revenues & Volume, By Rubber Pavers, 2022 - 2032F |
6.1.7 Austria Paving Stone Market Revenues & Volume, By Porcelain Pavers, 2022 - 2032F |
6.2 Austria Paving Stone Market, By Material |
6.2.1 Overview and Analysis |
6.2.2 Austria Paving Stone Market Revenues & Volume, By Cement, 2022 - 2032F |
6.2.3 Austria Paving Stone Market Revenues & Volume, By Clay, 2022 - 2032F |
6.2.4 Austria Paving Stone Market Revenues & Volume, By Granite, 2022 - 2032F |
6.2.5 Austria Paving Stone Market Revenues & Volume, By Recycled Rubber, 2022 - 2032F |
6.2.6 Austria Paving Stone Market Revenues & Volume, By Porcelain, 2022 - 2032F |
6.3 Austria Paving Stone Market, By Application |
6.3.1 Overview and Analysis |
6.3.2 Austria Paving Stone Market Revenues & Volume, By Driveways, 2022 - 2032F |
6.3.3 Austria Paving Stone Market Revenues & Volume, By Walkways, 2022 - 2032F |
6.3.4 Austria Paving Stone Market Revenues & Volume, By Patios, 2022 - 2032F |
6.3.5 Austria Paving Stone Market Revenues & Volume, By Garden Paths, 2022 - 2032F |
6.3.6 Austria Paving Stone Market Revenues & Volume, By Pool Decks, 2022 - 2032F |
6.4 Austria Paving Stone Market, By Installation Method |
6.4.1 Overview and Analysis |
6.4.2 Austria Paving Stone Market Revenues & Volume, By Dry Laid, 2022 - 2032F |
6.4.3 Austria Paving Stone Market Revenues & Volume, By Wet Laid, 2022 - 2032F |
6.4.4 Austria Paving Stone Market Revenues & Volume, By Mortared, 2022 - 2032F |
6.4.5 Austria Paving Stone Market Revenues & Volume, By Permeable, 2022 - 2032F |
6.4.6 Austria Paving Stone Market Revenues & Volume, By Floating, 2022 - 2032F |
6.5 Austria Paving Stone Market, By Finish |
6.5.1 Overview and Analysis |
6.5.2 Austria Paving Stone Market Revenues & Volume, By Polished, 2022 - 2032F |
6.5.3 Austria Paving Stone Market Revenues & Volume, By Tumbled, 2022 - 2032F |
6.5.4 Austria Paving Stone Market Revenues & Volume, By Flamed, 2022 - 2032F |
6.5.5 Austria Paving Stone Market Revenues & Volume, By Textured, 2022 - 2032F |
6.5.6 Austria Paving Stone Market Revenues & Volume, By Matte, 2022 - 2032F |
7 Austria Paving Stone Market Import-Export Trade Statistics |
7.1 Austria Paving Stone Market Export to Major Countries |
7.2 Austria Paving Stone Market Imports from Major Countries |
8 Austria Paving Stone Market Key Performance Indicators |
8.1 Average selling price of paving stones in Austria. |
8.2 Number of infrastructure development projects utilizing paving stones. |
8.3 Percentage of construction projects incorporating sustainable materials like paving stones. |
8.4 Innovation rate in paving stone designs and technologies. |
8.5 Customer satisfaction levels with the quality and durability of paving stones. |
9 Austria Paving Stone Market - Opportunity Assessment |
9.1 Austria Paving Stone Market Opportunity Assessment, By Type, 2022 & 2032F |
9.2 Austria Paving Stone Market Opportunity Assessment, By Material, 2022 & 2032F |
9.3 Austria Paving Stone Market Opportunity Assessment, By Application, 2022 & 2032F |
9.4 Austria Paving Stone Market Opportunity Assessment, By Installation Method, 2022 & 2032F |
9.5 Austria Paving Stone Market Opportunity Assessment, By Finish, 2022 & 2032F |
10 Austria Paving Stone Market - Competitive Landscape |
10.1 Austria Paving Stone Market Revenue Share, By Companies, 2025 |
10.2 Austria Paving Stone Market Competitive Benchmarking, By Operating and Technical Parameters |
11 Company Profiles |
12 Recommendations |
13 Disclaimer |
Global Go To Market Strategy - 2030
Export potential enables firms to identify high-growth global markets with greater confidence by combining advanced trade intelligence with a structured quantitative methodology. The framework analyzes emerging demand trends and country-level import patterns while integrating macroeconomic and trade datasets such as GDP and population forecasts, bilateral import–export flows, tariff structures, elasticity differentials between developed and developing economies, geographic distance, and import demand projections. Using weighted trade values from 2020–2024 as the base period to project country-to-country export potential for 2030, these inputs are operationalized through calculated drivers such as gravity model parameters, tariff impact factors, and projected GDP per-capita growth. Through an analysis of hidden potentials, demand hotspots, and market conditions that are most favorable to success, this method enables firms to focus on target countries, maximize returns, and global expansion with data, backed by accuracy.
By factoring in the projected importer demand gap that is currently unmet and could be potential opportunity, it identifies the potential for the Exporter (Country) among 190 countries, against the general trade analysis, which identifies the biggest importer or exporter.
To discover high-growth global markets and optimize your business strategy:
Click Here
Pricing
- Single User License$ 1,995
- Department License$ 2,400
- Site License$ 3,120
- Global License$ 3,795

Leadership Perspectives from Industry Events
Search
Thought Leadership and Analyst Meet


Our Clients
6WResearch In News
- Doha a strategic location for EV manufacturing hub: IPA Qatar
- Demand for luxury TVs surging in the GCC, says Samsung
- Empowering Growth: The Thriving Journey of Bangladesh’s Cable Industry
- Demand for luxury TVs surging in the GCC, says Samsung
- Video call with a traditional healer? Once unthinkable, it’s now common in South Africa
- Intelligent Buildings To Smooth GCC’s Path To Net Zero
Latest Reports
- Taiwan Airport Wireless Infrastructure Market (2026-2032)
- Vietnam Airport Wireless Infrastructure Market (2026-2032)
- Thailand Airport Wireless Infrastructure Market (2026-2032)
- South Korea Airport Wireless Infrastructure Market (2026-2032)
- Romania Airport Wireless Infrastructure Market (2026-2032)
- Qatar Airport Wireless Infrastructure Market (2026-2032)
- Philippines Airport Wireless Infrastructure Market (2026-2032)
- Japan Airport Wireless Infrastructure Market (2026-2032)
- Taiwan Airport Winter Services Market (2026-2032)
- Vietnam Airport Winter Services Market (2026-2032)
Industry Events and Analyst Meet

HIMTEX 2026

India Refining Summit 2026

India EV Show 2026

EV tech India Expo 2026

Auto Tech Asia 2026
Whitepaper
- Middle East & Africa Commercial Security Market Click here to view more.
- Middle East & Africa Fire Safety Systems & Equipment Market Click here to view more.
- GCC Drone Market Click here to view more.
- Middle East Lighting Fixture Market Click here to view more.
- GCC Physical & Perimeter Security Market Click here to view more.