Azerbaijan Chlorine Market (2025-2031) Outlook | Revenue, Share, Forecast, Size, Companies, Trends, Growth, Analysis, Value & Industry
Market Forecast By Application (EDC/PVC, Isocyanates and Oxygenates, Chloromethanes, Solvents and Epichlorohydrin, Inorganic Chemicals, Other Applications), By End-user Industry (Water Treatment, Pharmaceutical, Chemicals, Paper and Pulp, Plastic, Pesticides, Other End-user Industries) And Competitive Landscape
| Product Code: ETC191289 | Publication Date: May 2022 | Updated Date: Aug 2025 | Product Type: Market Research Report | |
| Publisher: 6Wresearch | Author: Ravi Bhandari | No. of Pages: 60 | No. of Figures: 40 | No. of Tables: 7 |
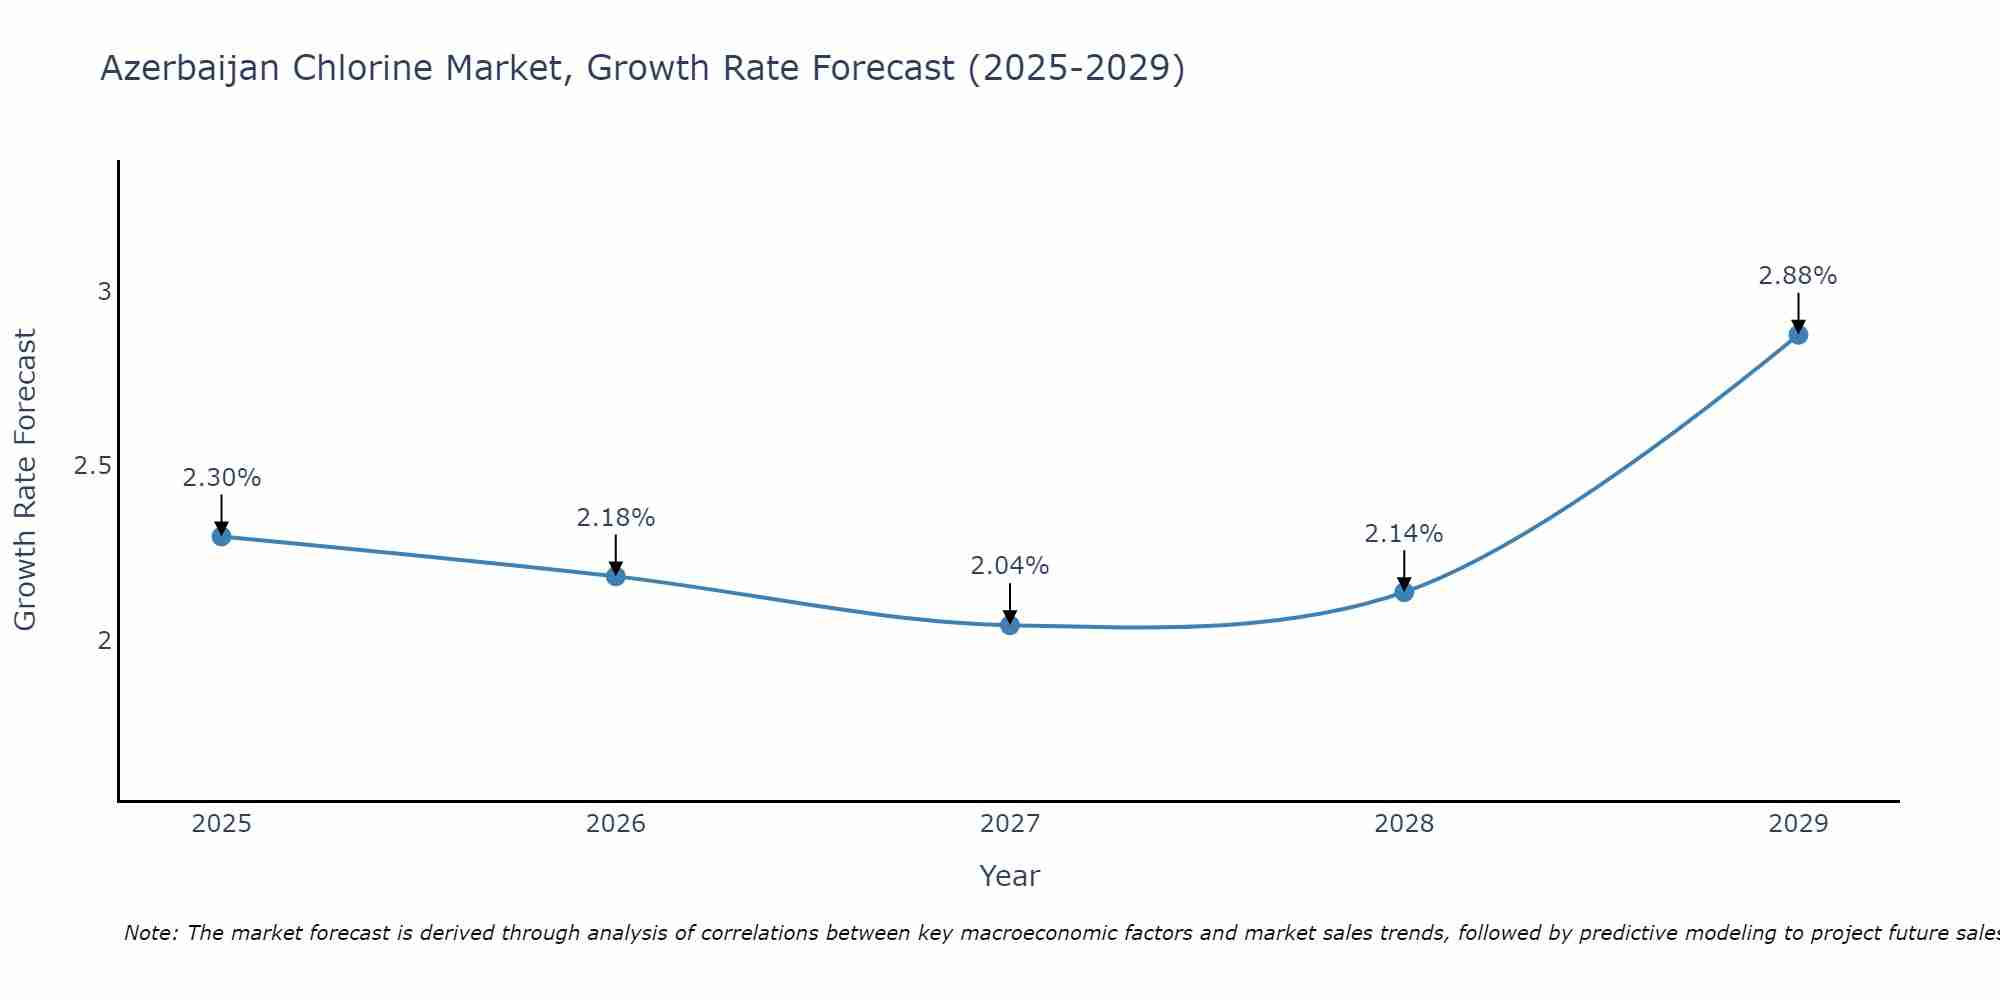
Azerbaijan Chlorine Market Size Growth Rate
The Azerbaijan Chlorine Market is projected to witness mixed growth rate patterns during 2025 to 2029. From 2.30% in 2025, the growth rate steadily ascends to 2.88% in 2029.
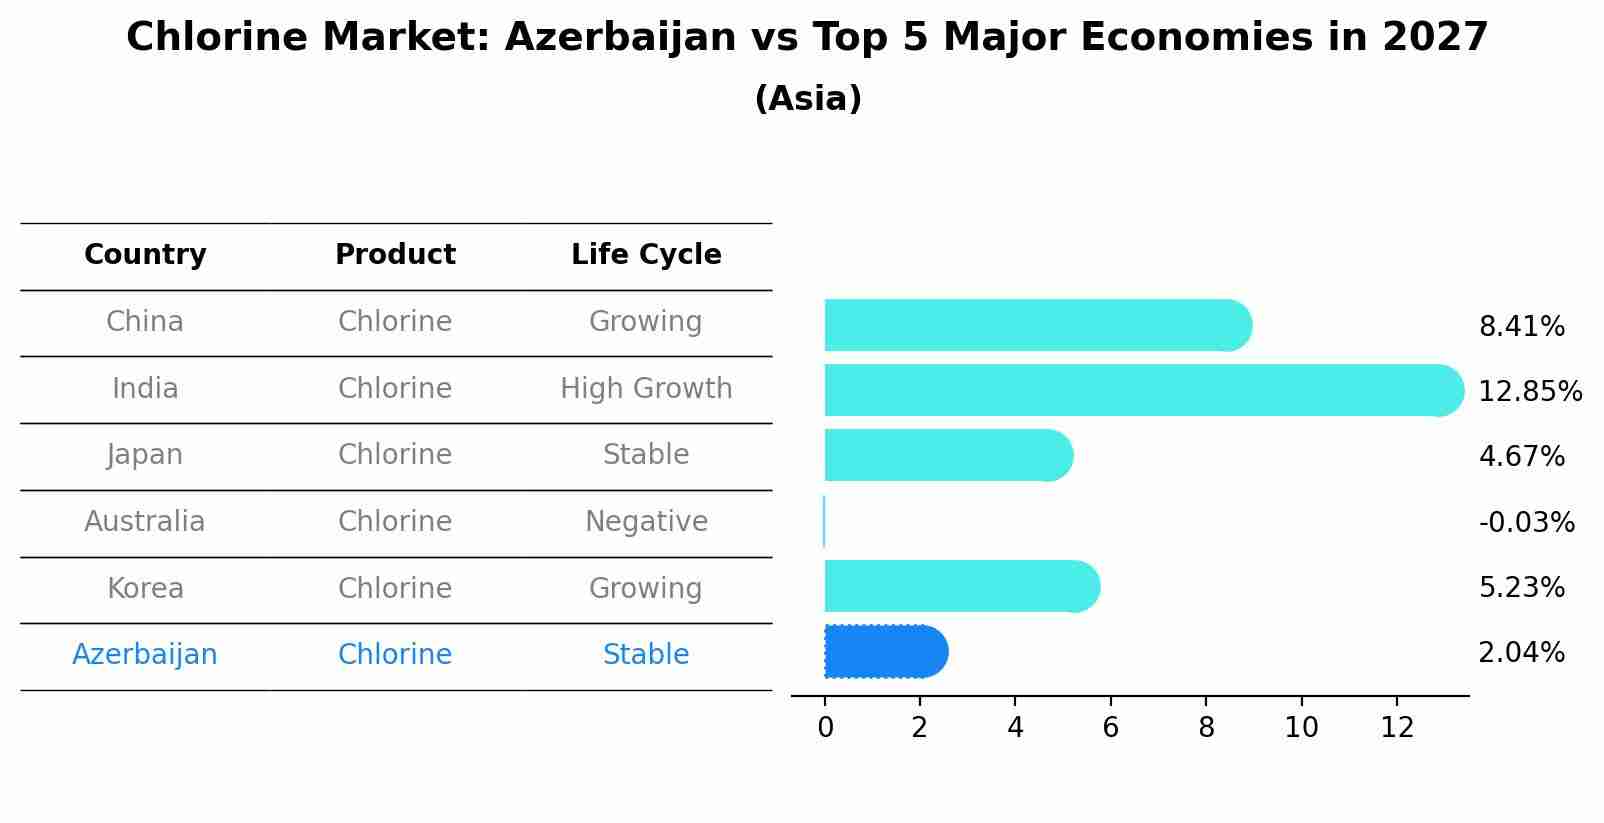
Chlorine Market: Azerbaijan vs Top 5 Major Economies in 2027 (Asia)
By 2027, Azerbaijan's Chlorine market is forecasted to achieve a stable growth rate of 2.04%, with China leading the Asia region, followed by India, Japan, Australia and South Korea.
Azerbaijan Chlorine Market Synopsis
The Chlorine market in Azerbaijan is experiencing growth due to the increasing demand for chlorine in various industrial applications such as water treatment, disinfection, chemicals manufacturing, and plastics production. Chlorine, a versatile chemical with strong oxidizing properties, is used in numerous processes, including water purification, sanitation, and bleaching. With industries focusing on water quality, hygiene, and product quality, the demand for chlorine is expected to rise. Challenges such as safety regulations, environmental concerns, and market volatility may impact market dynamics. However, investments in production technologies, process optimization, and sustainable practices could drive market growth and competitiveness.
Drivers of the market
The chlorine market in Azerbaijan is driven by factors such as chemical manufacturing, water treatment, and sanitation applications. Chlorine is a versatile chemical used for disinfection, bleaching, and manufacturing of various products. Factors such as population growth, urbanization, and industrialization contribute to the demand for chlorine in Azerbaijan.
Challenges of the market
The Azerbaijan chlorine market faces several challenges despite being a fundamental chemical with diverse applications in water treatment, chemicals manufacturing, and pharmaceuticals. One significant challenge is the environmental and safety concerns associated with chlorine production, storage, and usage, including the risk of accidental releases and exposure to chlorine gas. Regulatory compliance with safety and environmental standards adds complexity to chlorine manufacturing and handling processes, requiring investments in risk mitigation measures and emergency response capabilities. Additionally, fluctuations in chlorine demand and production volumes, as well as competition from alternative disinfection and water treatment technologies, impact market dynamics and pricing strategies for chlorine suppliers. Moreover, technological advancements in chlorine production and usage drive the demand for innovative and sustainable chlorine solutions. Addressing these challenges demands a strategic approach, including investment in safety protocols, environmental stewardship, and market diversification to ensure sustainable and responsible chlorine production and usage.
Government Policy of the market
In Azerbaijan, the government likely implements policies to regulate and support the chlorine market, ensuring product quality, safety, and environmental sustainability. These policies may include standards for chlorine production processes, product specifications, and safety protocols to meet industry requirements and regulatory standards. Additionally, regulations may address waste management, emissions control, and environmental protection measures to minimize the environmental impact of chlorine production and use. The government may also provide incentives for research and development in chlorine technology and innovation. Furthermore, initiatives may focus on promoting industry collaboration, capacity-building, and technology transfer to strengthen the domestic chlorine manufacturing sector. The government`s objective is likely to promote the growth of a sustainable and resilient chlorine market while safeguarding public health and environmental well-being.
Key Highlights of the Report:
- Azerbaijan Chlorine Market Outlook
- Market Size of Azerbaijan Chlorine Market, 2024
- Forecast of Azerbaijan Chlorine Market, 2031
- Historical Data and Forecast of Azerbaijan Chlorine Revenues & Volume for the Period 2021-2031
- Azerbaijan Chlorine Market Trend Evolution
- Azerbaijan Chlorine Market Drivers and Challenges
- Azerbaijan Chlorine Price Trends
- Azerbaijan Chlorine Porter's Five Forces
- Azerbaijan Chlorine Industry Life Cycle
- Historical Data and Forecast of Azerbaijan Chlorine Market Revenues & Volume By Application for the Period 2021-2031
- Historical Data and Forecast of Azerbaijan Chlorine Market Revenues & Volume By EDC/PVC for the Period 2021-2031
- Historical Data and Forecast of Azerbaijan Chlorine Market Revenues & Volume By Isocyanates and Oxygenates for the Period 2021-2031
- Historical Data and Forecast of Azerbaijan Chlorine Market Revenues & Volume By Chloromethanes for the Period 2021-2031
- Historical Data and Forecast of Azerbaijan Chlorine Market Revenues & Volume By Solvents and Epichlorohydrin for the Period 2021-2031
- Historical Data and Forecast of Azerbaijan Chlorine Market Revenues & Volume By Inorganic Chemicals for the Period 2021-2031
- Historical Data and Forecast of Azerbaijan Chlorine Market Revenues & Volume By Other Applications for the Period 2021-2031
- Historical Data and Forecast of Azerbaijan Chlorine Market Revenues & Volume By End-user Industry for the Period 2021-2031
- Historical Data and Forecast of Azerbaijan Chlorine Market Revenues & Volume By Water Treatment for the Period 2021-2031
- Historical Data and Forecast of Azerbaijan Chlorine Market Revenues & Volume By Pharmaceutical for the Period 2021-2031
- Historical Data and Forecast of Azerbaijan Chlorine Market Revenues & Volume By Chemicals for the Period 2021-2031
- Historical Data and Forecast of Azerbaijan Chlorine Market Revenues & Volume By Paper and Pulp for the Period 2021-2031
- Historical Data and Forecast of Azerbaijan Chlorine Market Revenues & Volume By Plastic for the Period 2021-2031
- Historical Data and Forecast of Azerbaijan Chlorine Market Revenues & Volume By Pesticides for the Period 2021-2031
- Historical Data and Forecast of Azerbaijan Chlorine Market Revenues & Volume By Other End-user Industries for the Period 2021-2031
- Azerbaijan Chlorine Import Export Trade Statistics
- Market Opportunity Assessment By Application
- Market Opportunity Assessment By End-user Industry
- Azerbaijan Chlorine Top Companies Market Share
- Azerbaijan Chlorine Competitive Benchmarking By Technical and Operational Parameters
- Azerbaijan Chlorine Company Profiles
- Azerbaijan Chlorine Key Strategic Recommendations
Frequently Asked Questions About the Market Study (FAQs):
6Wresearch actively monitors the Azerbaijan Chlorine Market and publishes its comprehensive annual report, highlighting emerging trends, growth drivers, revenue analysis, and forecast outlook. Our insights help businesses to make data-backed strategic decisions with ongoing market dynamics. Our analysts track relevent industries related to the Azerbaijan Chlorine Market, allowing our clients with actionable intelligence and reliable forecasts tailored to emerging regional needs.
Yes, we provide customisation as per your requirements. To learn more, feel free to contact us on sales@6wresearch.com
1 Executive Summary |
2 Introduction |
2.1 Key Highlights of the Report |
2.2 Report Description |
2.3 Market Scope & Segmentation |
2.4 Research Methodology |
2.5 Assumptions |
3 Azerbaijan Chlorine Market Overview |
3.1 Azerbaijan Country Macro Economic Indicators |
3.2 Azerbaijan Chlorine Market Revenues & Volume, 2021 & 2031F |
3.3 Azerbaijan Chlorine Market - Industry Life Cycle |
3.4 Azerbaijan Chlorine Market - Porter's Five Forces |
3.5 Azerbaijan Chlorine Market Revenues & Volume Share, By Application, 2021 & 2031F |
3.6 Azerbaijan Chlorine Market Revenues & Volume Share, By End-user Industry, 2021 & 2031F |
4 Azerbaijan Chlorine Market Dynamics |
4.1 Impact Analysis |
4.2 Market Drivers |
4.2.1 Growing demand for chlorine in water treatment applications due to increasing concerns about water quality and sanitation. |
4.2.2 Expansion of the chemical industry in Azerbaijan leading to higher demand for chlorine as a key raw material. |
4.2.3 Government initiatives promoting industrial development and infrastructure projects, driving the demand for chlorine. |
4.3 Market Restraints |
4.3.1 Fluctuating prices of raw materials such as salt, a key component in chlorine production, impacting the overall cost of chlorine. |
4.3.2 Environmental regulations and concerns regarding the use and disposal of chlorine, leading to potential restrictions on its usage. |
4.3.3 Competition from alternative water treatment technologies and substitutes for chlorine affecting market growth. |
5 Azerbaijan Chlorine Market Trends |
6 Azerbaijan Chlorine Market, By Types |
6.1 Azerbaijan Chlorine Market, By Application |
6.1.1 Overview and Analysis |
6.1.2 Azerbaijan Chlorine Market Revenues & Volume, By Application, 2021-2031F |
6.1.3 Azerbaijan Chlorine Market Revenues & Volume, By EDC/PVC, 2021-2031F |
6.1.4 Azerbaijan Chlorine Market Revenues & Volume, By Isocyanates and Oxygenates, 2021-2031F |
6.1.5 Azerbaijan Chlorine Market Revenues & Volume, By Chloromethanes, 2021-2031F |
6.1.6 Azerbaijan Chlorine Market Revenues & Volume, By Solvents and Epichlorohydrin, 2021-2031F |
6.1.7 Azerbaijan Chlorine Market Revenues & Volume, By Inorganic Chemicals, 2021-2031F |
6.1.8 Azerbaijan Chlorine Market Revenues & Volume, By Other Applications, 2021-2031F |
6.2 Azerbaijan Chlorine Market, By End-user Industry |
6.2.1 Overview and Analysis |
6.2.2 Azerbaijan Chlorine Market Revenues & Volume, By Water Treatment, 2021-2031F |
6.2.3 Azerbaijan Chlorine Market Revenues & Volume, By Pharmaceutical, 2021-2031F |
6.2.4 Azerbaijan Chlorine Market Revenues & Volume, By Chemicals, 2021-2031F |
6.2.5 Azerbaijan Chlorine Market Revenues & Volume, By Paper and Pulp, 2021-2031F |
6.2.6 Azerbaijan Chlorine Market Revenues & Volume, By Plastic, 2021-2031F |
6.2.7 Azerbaijan Chlorine Market Revenues & Volume, By Pesticides, 2021-2031F |
7 Azerbaijan Chlorine Market Import-Export Trade Statistics |
7.1 Azerbaijan Chlorine Market Export to Major Countries |
7.2 Azerbaijan Chlorine Market Imports from Major Countries |
8 Azerbaijan Chlorine Market Key Performance Indicators |
8.1 Number of new water treatment projects in Azerbaijan using chlorine as a primary disinfectant. |
8.2 Percentage increase in the production capacity of chlorine manufacturing plants in Azerbaijan. |
8.3 Adoption rate of chlorine-based products in different industries such as pharmaceuticals, textiles, and agriculture in Azerbaijan. |
9 Azerbaijan Chlorine Market - Opportunity Assessment |
9.1 Azerbaijan Chlorine Market Opportunity Assessment, By Application, 2021 & 2031F |
9.2 Azerbaijan Chlorine Market Opportunity Assessment, By End-user Industry, 2021 & 2031F |
10 Azerbaijan Chlorine Market - Competitive Landscape |
10.1 Azerbaijan Chlorine Market Revenue Share, By Companies, 2024 |
10.2 Azerbaijan Chlorine Market Competitive Benchmarking, By Operating and Technical Parameters |
11 Company Profiles |
12 Recommendations |
13 Disclaimer |
Global Go To Market Strategy - 2030
Export potential enables firms to identify high-growth global markets with greater confidence by combining advanced trade intelligence with a structured quantitative methodology. The framework analyzes emerging demand trends and country-level import patterns while integrating macroeconomic and trade datasets such as GDP and population forecasts, bilateral import–export flows, tariff structures, elasticity differentials between developed and developing economies, geographic distance, and import demand projections. Using weighted trade values from 2020–2024 as the base period to project country-to-country export potential for 2030, these inputs are operationalized through calculated drivers such as gravity model parameters, tariff impact factors, and projected GDP per-capita growth. Through an analysis of hidden potentials, demand hotspots, and market conditions that are most favorable to success, this method enables firms to focus on target countries, maximize returns, and global expansion with data, backed by accuracy.
By factoring in the projected importer demand gap that is currently unmet and could be potential opportunity, it identifies the potential for the Exporter (Country) among 190 countries, against the general trade analysis, which identifies the biggest importer or exporter.
To discover high-growth global markets and optimize your business strategy:
Click Here
Pricing
- Single User License$ 1,995
- Department License$ 2,400
- Site License$ 3,120
- Global License$ 3,795

Leadership Perspectives from Industry Events
Search
Thought Leadership and Analyst Meet


Our Clients
6WResearch In News
- India Air Conditioner Market Set for Strong Rebound in 2026 After Weather-Led Correction and GST-Driven Recovery: 6Wresearch
- ADAS in India: How Automatic Emergency Braking, Blind Spot Detection & Driver Monitoring are Transforming Road Safety
- Doha a strategic location for EV manufacturing hub: IPA Qatar
- Demand for luxury TVs surging in the GCC, says Samsung
- Empowering Growth: The Thriving Journey of Bangladesh’s Cable Industry
- Demand for luxury TVs surging in the GCC, says Samsung
Latest Reports
- Poland Fire Protection Systems Market (2026-2032)
- Cape Verde Portable Hand-Thrown Extinguisher Market (2026-2032)
- Canada Portable Hand-Thrown Extinguisher Market (2026-2032)
- Cameroon Portable Hand-Thrown Extinguisher Market (2026-2032)
- Burundi Portable Hand-Thrown Extinguisher Market (2026-2032)
- Burkina Faso Portable Hand-Thrown Extinguisher Market (2026-2032)
- Bulgaria Portable Hand-Thrown Extinguisher Market (2026-2032)
- Brunei Portable Hand-Thrown Extinguisher Market (2026-2032)
- Botswana Portable Hand-Thrown Extinguisher Market (2026-2032)
- Bosnia and Herzegovina Portable Hand-Thrown Extinguisher Market (2026-2032)
Industry Events and Analyst Meet

HIMTEX 2026

India Refining Summit 2026

India EV Show 2026

EV tech India Expo 2026

Auto Tech Asia 2026
Whitepaper
- Middle East & Africa Commercial Security Market Click here to view more.
- Middle East & Africa Fire Safety Systems & Equipment Market Click here to view more.
- GCC Drone Market Click here to view more.
- Middle East Lighting Fixture Market Click here to view more.
- GCC Physical & Perimeter Security Market Click here to view more.