Azerbaijan Neon Gas Market (2026-2032) Outlook | Forecast, Trends, Companies, Growth, Analysis, Size, Share, Industry, Revenue & Value
Market Forecast By Type (Low, High, Ultra High), By Application (Semiconductor, LCD, Imaging and Lighting, Refrigerator, Laser, Medical, Others) And Competitive Landscape
| Product Code: ETC094876 | Publication Date: Jun 2021 | Updated Date: Jun 2026 | Product Type: Report | |
| Publisher: 6Wresearch | Author: Shubham Deep | No. of Pages: 70 | No. of Figures: 35 | No. of Tables: 5 |
Azerbaijan Neon Gas Market Size, Share & Growth Rate
The Azerbaijan Neon Gas Market was estimated at USD 627 Million in 2025 and is projected to reach USD 1172 Million by 2032, growing at a CAGR of 9.3% from 2026 to 2032. This growth trajectory is primarily driven by heightened demand from the signage, lighting, and electronics sectors, where neon gas is favored for its luminous qualities and reliability. Additionally, the expansion of the construction sector in Azerbaijan has led to increased applications of neon lighting in both commercial and residential settings, further stimulating market growth.
Azerbaijan Neon Gas Market Growth Rate Analysis (2021-2032)
The Azerbaijan neon gas market is undergoing robust growth, with an annual increase expected to rise from 8.8% in 2021 to an impressive 13.2% by 2032. This upward trend can be attributed to escalating consumer demand in sectors such as electronics and automotive, where neon gas plays a crucial role in lighting and laser technologies. Additionally, significant investments in infrastructure and technological advancements are facilitating production efficiency. The government's commitment to energy transition initiatives has also spurred domestic facilities, resulting in a more reliable supply chain. As these factors combine, they create a conducive environment for sustained market expansion throughout the coming years.
Azerbaijan Neon Gas Market Year-wise Growth Rate and Key Drivers
This graph highlights how the Azerbaijan Neon Gas Market has steadily grown over the past five years, supported by major growth factors.
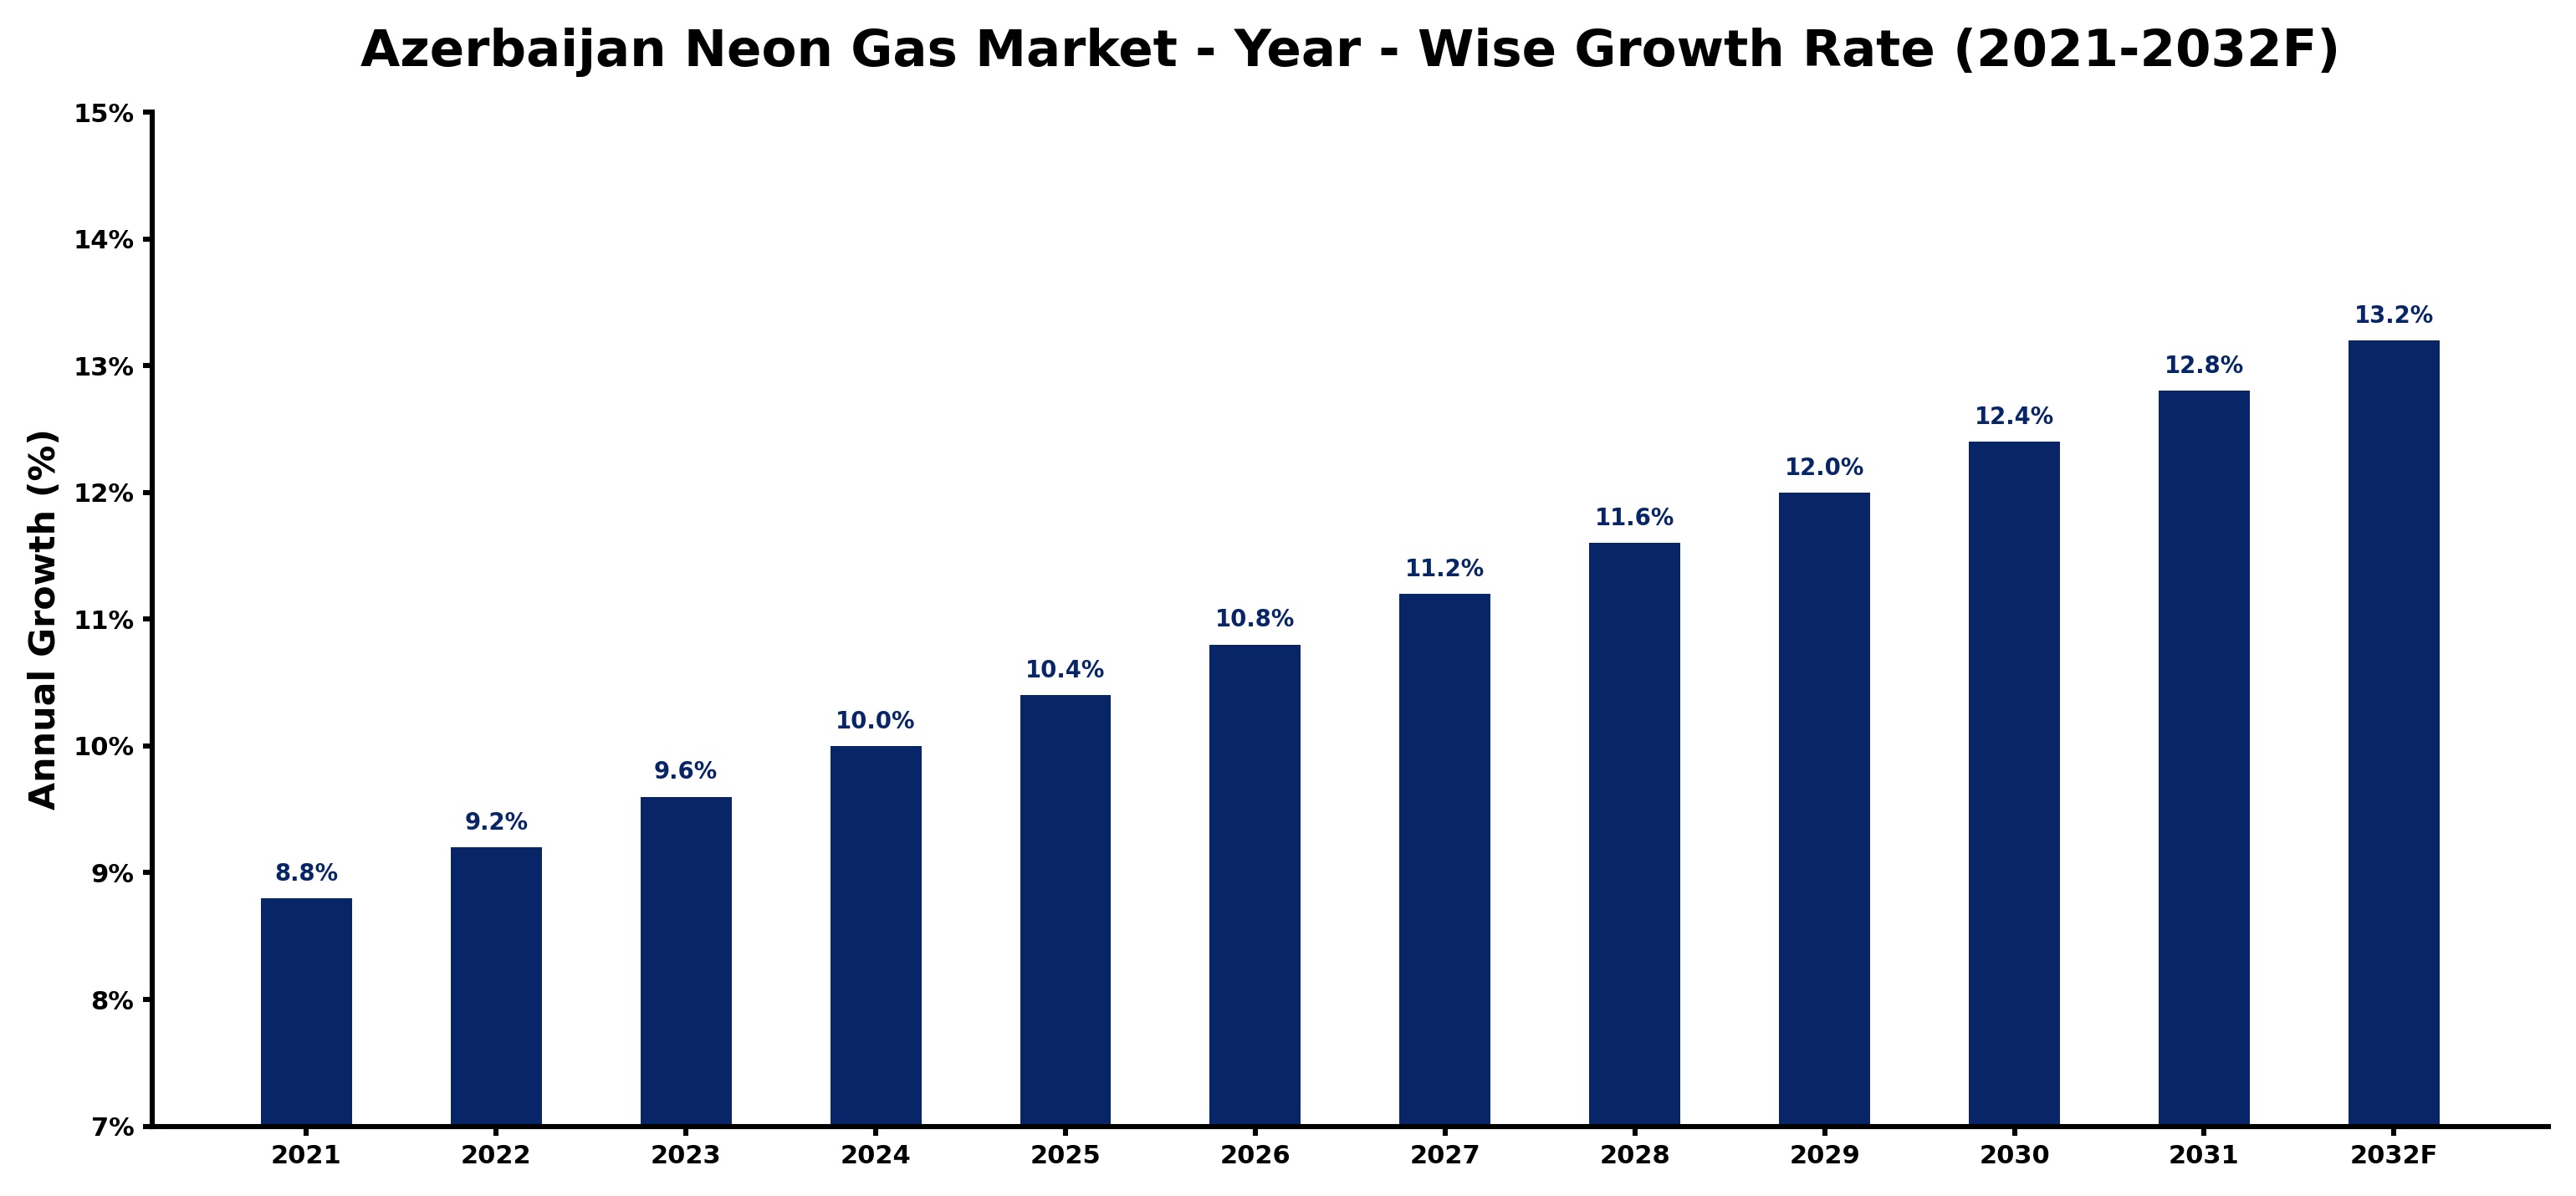
The table below presents the year‑wise growth rates along with the key drivers influencing the market
| Year | Growth Rate | Major Drivers |
| 2021 | 8.8% | New neon production facilities enhance regional export capabilities significantly |
| 2022 | 9.2% | Neon gas suppliers expanded production capacity to meet semiconductor demands |
| 2023 | 9.6% | Improved manufacturing technology boosted neon gas production efficiency |
| 2024 | 10.0% | Manufacturing investments in petrochemicals drive neon gas production expansion |
| 2025 | 10.4% | Revitalized domestic construction projects boosted neon gas consumption rates |
| 2026 | 10.8% | Increased neon gas demand drives investment in local production facilities |
| 2027 | 11.2% | Local semiconductor fabrication facilities boost neon gas consumption trends |
| 2028 | 11.6% | Increased oil and gas exploration drives neon gas demand |
| 2029 | 12.0% | Advanced technology adoption enhanced neon gas extraction efficiency |
| 2030 | 12.4% | Higher neon gas utilization boosted local semiconductor manufacturing efficiency |
| 2031 | 12.8% | Advanced pipeline projects boost Azerbaijan's neon gas distribution capacity |
| 2032 | 13.2% | New investments in production facilities boost neon gas supply capacity |
Note - Market size estimations and growth projections presented in this report are based on 6Wresearch’s advanced forecasting approach, validated with industry datasets as of June 2026.
Azerbaijan Neon Gas Market Synopsis
The strongest force shaping the Azerbaijan Neon Gas Market currently is the burgeoning demand from the electronics industry. As innovations in display technologies continue to evolve, the role of neon gas in high-performance applications such as plasma displays and neon lighting becomes increasingly prominent.
In addition to electronics, the revitalization of the construction sector is significantly influencing market dynamics. This resurgence is fostering new projects that incorporate neon lighting, enhancing both aesthetics and functionality in urban and rural developments across Azerbaijan.
Azerbaijan Neon Gas Market Key Takeaways
- The Azerbaijan Neon Gas Market is fueled by increasing applications across diverse sectors, particularly electronics and construction.
- Technological advancements are enhancing production and purification processes, influencing market efficiency.
- Growing environmental concerns are driving a shift towards sustainable alternatives within the neon gas market.
- The government is actively promoting energy-efficient lighting solutions, boosting neon gas adoption.
- Investment opportunities exist for domestic production capabilities to reduce reliance on imports and enhance supply security.
Evaluation of Restraints in Azerbaijan Neon Gas Market
Despite the positive outlook for the Azerbaijan Neon Gas Market, several restraints continue to impede its growth. One significant limitation is the country's heavy reliance on imports for neon gas, which can lead to supply chain vulnerabilities and fluctuations in local prices. Additionally, the absence of domestic production facilities hampers self-sufficiency, making the market susceptible to global price variances. Compounding these issues are stringent regulations surrounding gas handling and storage, as well as competition from alternative lighting technologies such as LED, which boast greater energy efficiency and environmental friendliness.
Azerbaijan Neon Gas Market Trends
Current trends in the Azerbaijan Neon Gas Market reveal a strong shift toward eco-friendly alternatives alongside traditional neon gas applications. As sustainability becomes a pivotal concern, industries are exploring greener options without compromising on quality. Meanwhile, technological advancements in production processes are enhancing the purity and efficiency of neon gas, making it a more appealing choice for manufacturers. The increasing use of neon in artistic and lighting fixtures is also creating new avenues for market expansion, as creativity and innovation take center stage in design.
Azerbaijan Neon Gas Market Opportunities
The Azerbaijan Neon Gas Market is rich with investment opportunities, particularly in sectors like electronics and healthcare, which are projected to drive future demand. Investors can explore ventures in neon gas production and supply, forming strategic partnerships with local manufacturers and distributors to tap into the burgeoning market. Additionally, there is considerable scope for research and development focused on innovative applications of neon gas, positioning companies to capitalize on emerging trends and technological advancements.
Government Initiatives in the Azerbaijan Neon Gas Market
The Azerbaijan government is playing an instrumental role in shaping the neon gas market through various initiatives aimed at regulating and promoting growth. Key policies include the establishment of quality standards for production and distribution, alongside stringent licensing requirements for industry participants. Furthermore, to encourage investment, the government has introduced incentives such as tax breaks and subsidies designed to foster a competitive and sustainable neon gas sector. These efforts underscore the commitment to ensuring compliance with safety and environmental standards while supporting market development.
Future Insights of the Azerbaijan Neon Gas Market
Looking ahead to the period from 2026 to 2032, the Azerbaijan Neon Gas Market is expected to continue on its upward trajectory. The growing adoption of neon gas in various applications, including signage and advanced electronic displays, will drive market expansion. The healthcare sector's increasing utilization of neon gas for specialized applications further complements this growth. However, investors and stakeholders should remain vigilant of potential challenges, including regulatory constraints and price volatility in raw materials. Overall, with ongoing technological advancements and innovative applications, the market is poised for sustained growth.
Azerbaijan Neon Gas Market Latest Developments (May 2025 - June 2026)
Recent developments in the Azerbaijan Neon Gas Market indicate a growing focus on sustainability and technological innovation. Industry stakeholders are increasingly collaborating on initiatives aimed at improving production efficiency and reducing environmental impacts. Additionally, there has been heightened interest in developing new applications for neon gas, particularly in artistic and architectural lighting, as the market responds to evolving consumer preferences. As companies adapt to these trends, we anticipate a dynamic period of growth and transformation in the neon gas landscape.
Azerbaijan Neon Gas Market - Key Attractiveness of the Report
- 10 Years of Market Numbers
- Historical Data Starting from 2022 to 2025
- Base Year: 2025
- Forecast Data until 2032
- Key Performance Indicators Impacting the Market
- Major Upcoming Developments and Projects
Key Highlights of the Report:
- Azerbaijan Neon Gas Market Outlook
- Market Size of Azerbaijan Neon Gas Market, 2025
- Forecast of Azerbaijan Neon Gas Market, 2032
- Historical Data and Forecast of Azerbaijan Neon Gas Revenues & Volume for the Period 2022-2032F
- Azerbaijan Neon Gas Market Trend Evolution
- Azerbaijan Neon Gas Market Drivers and Challenges
- Azerbaijan Neon Gas Price Trends
- Azerbaijan Neon Gas Porter's Five Forces
- Azerbaijan Neon Gas Industry Life Cycle
- Historical Data and Forecast of Azerbaijan Neon Gas Market Revenues & Volume By Type for the Period 2022-2032F
- Historical Data and Forecast of Azerbaijan Neon Gas Market Revenues & Volume By Low for the Period 2022-2032F
- Historical Data and Forecast of Azerbaijan Neon Gas Market Revenues & Volume By High for the Period 2022-2032F
- Historical Data and Forecast of Azerbaijan Neon Gas Market Revenues & Volume By Ultra High for the Period 2022-2032F
- Historical Data and Forecast of Azerbaijan Neon Gas Market Revenues & Volume By Application for the Period 2022-2032F
- Historical Data and Forecast of Azerbaijan Neon Gas Market Revenues & Volume By Semiconductor for the Period 2022-2032F
- Historical Data and Forecast of Azerbaijan Neon Gas Market Revenues & Volume By LCD for the Period 2022-2032F
- Historical Data and Forecast of Azerbaijan Neon Gas Market Revenues & Volume By Imaging and Lighting for the Period 2022-2032F
- Historical Data and Forecast of Azerbaijan Neon Gas Market Revenues & Volume By Refrigerator for the Period 2022-2032F
- Historical Data and Forecast of Azerbaijan Neon Gas Market Revenues & Volume By Laser for the Period 2022-2032F
- Historical Data and Forecast of Azerbaijan Neon Gas Market Revenues & Volume By Medical for the Period 2022-2032F
- Historical Data and Forecast of Azerbaijan Neon Gas Market Revenues & Volume By Others for the Period 2022-2032F
- Azerbaijan Neon Gas Import Export Trade Statistics
- Market Opportunity Assessment By Type
- Market Opportunity Assessment By Application
- Azerbaijan Neon Gas Top Companies Market Share
- Azerbaijan Neon Gas Competitive Benchmarking By Technical and Operational Parameters
- Azerbaijan Neon Gas Company Profiles
- Azerbaijan Neon Gas Key Strategic Recommendations
Azerbaijan Neon Gas Market - Frequently Asked Questions
The Azerbaijan Neon Gas Market is on an upward trajectory, with demand projected to increase significantly across various sectors, reaching USD 1172 Million by 2032.
Neon gas is primarily used in signage and lighting applications, as well as in electronics for plasma displays and semiconductor manufacturing.
The government implements policies that promote growth through quality standards, licensing, and financial incentives for companies in the neon gas sector.
There is a growing emphasis on sustainable practices in the neon gas market, leading to interest in eco-friendly alternatives while maintaining efficiency and quality.
Key challenges include reliance on imports, fluctuating prices, and competition from more energy-efficient technologies like LED lighting.
The Azerbaijan Neon Gas Market is estimated to grow from USD 627 Million in 2025 to USD 1172 Million by 2032, with a CAGR of 9.3% during the period from 2026 to 2032.
6Wresearch actively monitors the Azerbaijan Neon Gas Market and publishes its comprehensive annual report, highlighting emerging trends, growth drivers, revenue analysis, and forecast outlook. Our insights help businesses to make data-backed strategic decisions with ongoing market dynamics. Our analysts track relevent industries related to the Azerbaijan Neon Gas Market, allowing our clients with actionable intelligence and reliable forecasts tailored to emerging regional needs.
Yes, we provide customisation as per your requirements. To learn more, feel free to contact us on sales@6wresearch.com
1 Executive Summary |
2 Introduction |
2.1 Key Highlights of the Report |
2.2 Report Description |
2.3 Market Scope & Segmentation |
2.4 Research Methodology |
2.5 Assumptions |
3 Azerbaijan Neon Gas Market Overview |
3.1 Azerbaijan Country Macro Economic Indicators |
3.2 Azerbaijan Neon Gas Market Revenues & Volume, 2022 & 2032F |
3.3 Azerbaijan Neon Gas Market - Industry Life Cycle |
3.4 Azerbaijan Neon Gas Market - Porter's Five Forces |
3.5 Azerbaijan Neon Gas Market Revenues & Volume Share, By Type, 2022 & 2032F |
3.6 Azerbaijan Neon Gas Market Revenues & Volume Share, By Form, 2022 & 2032F |
4 Azerbaijan Neon Gas Market Dynamics |
4.1 Impact Analysis |
4.2 Market Drivers |
4.3 Market Restraints |
5 Azerbaijan Neon Gas Market Trends |
6 Azerbaijan Neon Gas Market, By Types |
6.1 Azerbaijan Neon Gas Market, By Type |
6.1.1 Overview and Analysis |
6.1.2 Azerbaijan Neon Gas Market Revenues & Volume, By Type, 2022-2032F |
6.1.3 Azerbaijan Neon Gas Market Revenues & Volume, By Low, 2022-2032F |
6.1.4 Azerbaijan Neon Gas Market Revenues & Volume, By High, 2022-2032F |
6.1.5 Azerbaijan Neon Gas Market Revenues & Volume, By Ultra High, 2022-2032F |
6.2 Azerbaijan Neon Gas Market, By Application |
6.2.1 Overview and Analysis |
6.2.2 Azerbaijan Neon Gas Market Revenues & Volume, By Semiconductor, 2022-2032F |
6.2.3 Azerbaijan Neon Gas Market Revenues & Volume, By LCD, 2022-2032F |
6.2.4 Azerbaijan Neon Gas Market Revenues & Volume, By Imaging and Lighting, 2022-2032F |
6.2.5 Azerbaijan Neon Gas Market Revenues & Volume, By Refrigerator, 2022-2032F |
6.2.6 Azerbaijan Neon Gas Market Revenues & Volume, By Laser, 2022-2032F |
6.2.7 Azerbaijan Neon Gas Market Revenues & Volume, By Medical, 2022-2032F |
7 Azerbaijan Neon Gas Market Import-Export Trade Statistics |
7.1 Azerbaijan Neon Gas Market Export to Major Countries |
7.2 Azerbaijan Neon Gas Market Imports from Major Countries |
8 Azerbaijan Neon Gas Market Key Performance Indicators |
9 Azerbaijan Neon Gas Market - Opportunity Assessment |
9.1 Azerbaijan Neon Gas Market Opportunity Assessment, By Type, 2022 & 2032F |
9.2 Azerbaijan Neon Gas Market Opportunity Assessment, By Application, 2022 & 2032F |
10 Azerbaijan Neon Gas Market - Competitive Landscape |
10.1 Azerbaijan Neon Gas Market Revenue Share, By Companies, 2025 |
10.2 Azerbaijan Neon Gas Market Competitive Benchmarking, By Operating and Technical Parameters |
11 Company Profiles |
12 Recommendations |
13 Disclaimer |
Global Go To Market Strategy - 2030
Export potential enables firms to identify high-growth global markets with greater confidence by combining advanced trade intelligence with a structured quantitative methodology. The framework analyzes emerging demand trends and country-level import patterns while integrating macroeconomic and trade datasets such as GDP and population forecasts, bilateral import–export flows, tariff structures, elasticity differentials between developed and developing economies, geographic distance, and import demand projections. Using weighted trade values from 2020–2024 as the base period to project country-to-country export potential for 2030, these inputs are operationalized through calculated drivers such as gravity model parameters, tariff impact factors, and projected GDP per-capita growth. Through an analysis of hidden potentials, demand hotspots, and market conditions that are most favorable to success, this method enables firms to focus on target countries, maximize returns, and global expansion with data, backed by accuracy.
By factoring in the projected importer demand gap that is currently unmet and could be potential opportunity, it identifies the potential for the Exporter (Country) among 190 countries, against the general trade analysis, which identifies the biggest importer or exporter.
To discover high-growth global markets and optimize your business strategy:
Click Here
Pricing
- Single User License$ 1,995
- Department License$ 2,400
- Site License$ 3,120
- Global License$ 3,795

Leadership Perspectives from Industry Events
Search
Thought Leadership and Analyst Meet


Our Clients
6WResearch In News
- India Air Conditioner Market Set for Strong Rebound in 2026 After Weather-Led Correction and GST-Driven Recovery: 6Wresearch
- ADAS in India: How Automatic Emergency Braking, Blind Spot Detection & Driver Monitoring are Transforming Road Safety
- Doha a strategic location for EV manufacturing hub: IPA Qatar
- Demand for luxury TVs surging in the GCC, says Samsung
- Empowering Growth: The Thriving Journey of Bangladesh’s Cable Industry
- Demand for luxury TVs surging in the GCC, says Samsung
Latest Reports
- Nicaragua RPG Gaming Market (2026-2032)
- New Zealand RPG Gaming Market (2026-2032)
- Netherlands RPG Gaming Market (2026-2032)
- Nauru RPG Gaming Market (2026-2032)
- Namibia RPG Gaming Market (2026-2032)
- Mozambique RPG Gaming Market (2026-2032)
- Montenegro RPG Gaming Market (2026-2032)
- Mongolia RPG Gaming Market (2026-2032)
- Monaco RPG Gaming Market (2026-2032)
- Micronesia RPG Gaming Market (2026-2032)
Industry Events and Analyst Meet

HIMTEX 2026

India Refining Summit 2026

India EV Show 2026

EV tech India Expo 2026

Auto Tech Asia 2026
Whitepaper
- Middle East & Africa Commercial Security Market Click here to view more.
- Middle East & Africa Fire Safety Systems & Equipment Market Click here to view more.
- GCC Drone Market Click here to view more.
- Middle East Lighting Fixture Market Click here to view more.
- GCC Physical & Perimeter Security Market Click here to view more.