Bahamas Flavored Syrups Market (2026-2032) | Forecast, Segmentation, Industry, Value, Revenue, Trends, Outlook, Size, Companies, Growth, Analysis & Share
Market Forecast By Flavor (Fruit, Chocolate, Vanilla, Coffee, Herbs & Seasonings), By Application (Beverages, Diary & Frozen Desserts, Confectionery, Bakery), By Flavor Type (Sweet, Salty, Sour, Savory, Mint), By Product type (Natural, Synthetic) And Competitive Landscape
| Product Code: ETC5001199 | Publication Date: Nov 2023 | Updated Date: Mar 2026 | Product Type: Market Research Report | |
| Publisher: 6Wresearch | Author: Sachin Kumar Rai | No. of Pages: 60 | No. of Figures: 30 | No. of Tables: 5 |
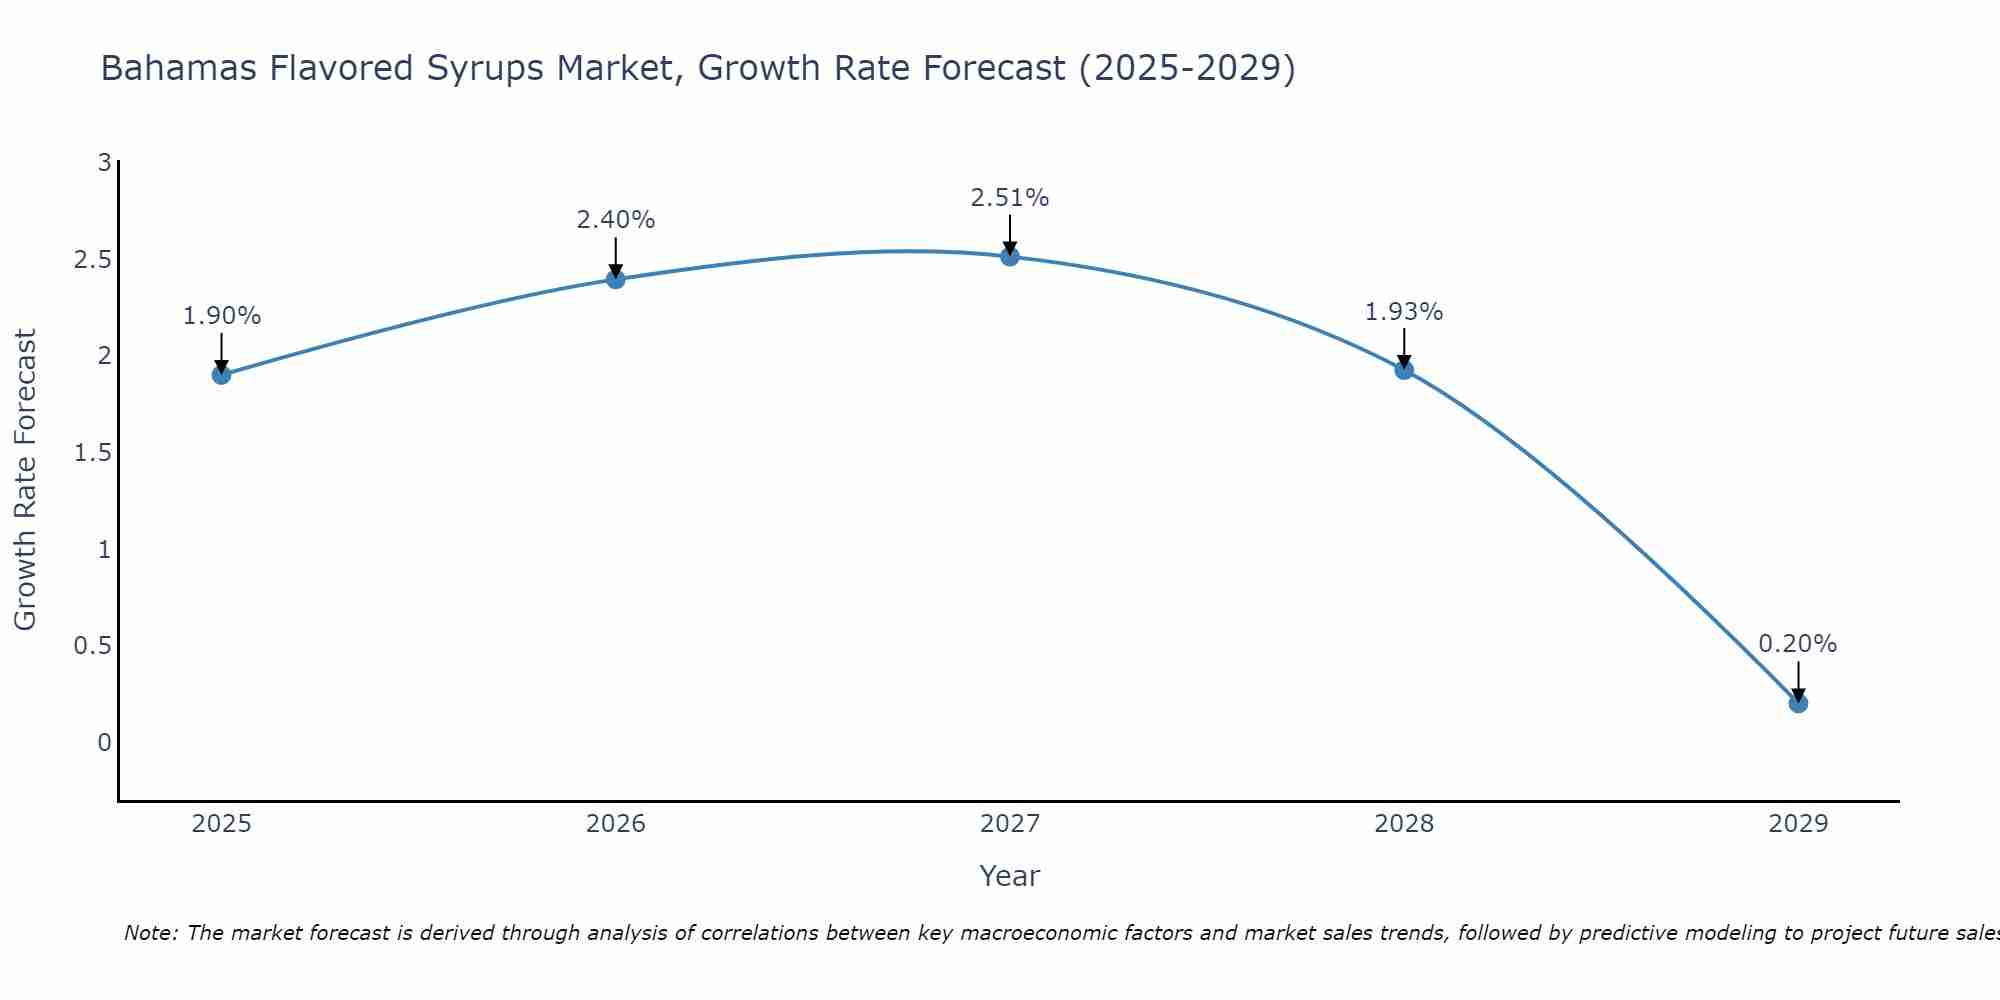
Bahamas Flavored Syrups Market Size Growth Rate
The Bahamas Flavored Syrups Market is projected to witness mixed growth rate patterns during 2025 to 2029. Growth accelerates to 2.51% in 2027, following an initial rate of 1.90%, before easing to 0.20% at the end of the period.
Bahamas Flavored Syrups Market Overview
The Bahamas Flavored Syrups market serves the food and beverage industry, enhancing the taste and appeal of various products including desserts, beverages, and confectionery items. Consumer preference for diverse flavors, coupled with the hospitality sector`s demand for customizable offerings, fuels market growth and product innovation.
Drivers of the market
Changing consumer preferences towards unique and customizable food and beverage experiences are driving the Bahamas Flavored Syrups market, catering to diverse taste preferences in beverages and culinary applications.
Challenges of the market
Challenges in the Bahamas Flavored Syrups market include fluctuating raw material prices, changing consumer taste preferences, and seasonal demand variations. Market players face distribution challenges and regulatory compliance issues impacting product availability and market penetration.
Government Policy of the market
Policies governing the flavored syrups market in the Bahamas include food safety standards, labeling requirements, and support for small-scale producers through grants and capacity-building initiatives. The government promotes export opportunities while ensuring compliance with international food regulations.
Key Highlights of the Report:
- Bahamas Flavored Syrups Market Outlook
- Market Size of Bahamas Flavored Syrups Market, 2025
- Forecast of Bahamas Flavored Syrups Market, 2032
- Historical Data and Forecast of Bahamas Flavored Syrups Revenues & Volume for the Period 2022-2032F
- Bahamas Flavored Syrups Market Trend Evolution
- Bahamas Flavored Syrups Market Drivers and Challenges
- Bahamas Flavored Syrups Price Trends
- Bahamas Flavored Syrups Porter`s Five Forces
- Bahamas Flavored Syrups Industry Life Cycle
- Historical Data and Forecast of Bahamas Flavored Syrups Market Revenues & Volume By Flavor for the Period 2022-2032F
- Historical Data and Forecast of Bahamas Flavored Syrups Market Revenues & Volume By Fruit for the Period 2022-2032F
- Historical Data and Forecast of Bahamas Flavored Syrups Market Revenues & Volume By Chocolate for the Period 2022-2032F
- Historical Data and Forecast of Bahamas Flavored Syrups Market Revenues & Volume By Vanilla for the Period 2022-2032F
- Historical Data and Forecast of Bahamas Flavored Syrups Market Revenues & Volume By Coffee for the Period 2022-2032F
- Historical Data and Forecast of Bahamas Flavored Syrups Market Revenues & Volume By Herbs & Seasonings for the Period 2022-2032F
- Historical Data and Forecast of Bahamas Flavored Syrups Market Revenues & Volume By Application for the Period 2022-2032F
- Historical Data and Forecast of Bahamas Flavored Syrups Market Revenues & Volume By Beverages for the Period 2022-2032F
- Historical Data and Forecast of Bahamas Flavored Syrups Market Revenues & Volume By Diary & Frozen Desserts for the Period 2022-2032F
- Historical Data and Forecast of Bahamas Flavored Syrups Market Revenues & Volume By Confectionery for the Period 2022-2032F
- Historical Data and Forecast of Bahamas Flavored Syrups Market Revenues & Volume By Bakery for the Period 2022-2032F
- Historical Data and Forecast of Bahamas Flavored Syrups Market Revenues & Volume By Flavor Type for the Period 2022-2032F
- Historical Data and Forecast of Bahamas Flavored Syrups Market Revenues & Volume By Sweet for the Period 2022-2032F
- Historical Data and Forecast of Bahamas Flavored Syrups Market Revenues & Volume By Salty for the Period 2022-2032F
- Historical Data and Forecast of Bahamas Flavored Syrups Market Revenues & Volume By Sour for the Period 2022-2032F
- Historical Data and Forecast of Bahamas Flavored Syrups Market Revenues & Volume By Savory for the Period 2022-2032F
- Historical Data and Forecast of Bahamas Flavored Syrups Market Revenues & Volume By Mint for the Period 2022-2032F
- Historical Data and Forecast of Bahamas Flavored Syrups Market Revenues & Volume By Product type for the Period 2022-2032F
- Historical Data and Forecast of Bahamas Flavored Syrups Market Revenues & Volume By Natural for the Period 2022-2032F
- Historical Data and Forecast of Bahamas Flavored Syrups Market Revenues & Volume By Synthetic for the Period 2022-2032F
- Bahamas Flavored Syrups Import Export Trade Statistics
- Market Opportunity Assessment By Flavor
- Market Opportunity Assessment By Application
- Market Opportunity Assessment By Flavor Type
- Market Opportunity Assessment By Product type
- Bahamas Flavored Syrups Top Companies Market Share
- Bahamas Flavored Syrups Competitive Benchmarking By Technical and Operational Parameters
- Bahamas Flavored Syrups Company Profiles
- Bahamas Flavored Syrups Key Strategic Recommendations
Bahamas Flavored Syrups Market (2026-2032): FAQs
6Wresearch actively monitors the Bahamas Flavored Syrups Market and publishes its comprehensive annual report, highlighting emerging trends, growth drivers, revenue analysis, and forecast outlook. Our insights help businesses to make data-backed strategic decisions with ongoing market dynamics. Our analysts track relevent industries related to the Bahamas Flavored Syrups Market, allowing our clients with actionable intelligence and reliable forecasts tailored to emerging regional needs.
Yes, we provide customisation as per your requirements. To learn more, feel free to contact us on sales@6wresearch.com
1 Executive Summary |
2 Introduction |
2.1 Key Highlights of the Report |
2.2 Report Description |
2.3 Market Scope & Segmentation |
2.4 Research Methodology |
2.5 Assumptions |
3 Bahamas Flavored Syrups Market Overview |
3.1 Bahamas Country Macro Economic Indicators |
3.2 Bahamas Flavored Syrups Market Revenues & Volume, 2022 & 2032F |
3.3 Bahamas Flavored Syrups Market - Industry Life Cycle |
3.4 Bahamas Flavored Syrups Market - Porter's Five Forces |
3.5 Bahamas Flavored Syrups Market Revenues & Volume Share, By Flavor, 2022 & 2032F |
3.6 Bahamas Flavored Syrups Market Revenues & Volume Share, By Application, 2022 & 2032F |
3.7 Bahamas Flavored Syrups Market Revenues & Volume Share, By Flavor Type, 2022 & 2032F |
3.8 Bahamas Flavored Syrups Market Revenues & Volume Share, By Product type, 2022 & 2032F |
4 Bahamas Flavored Syrups Market Dynamics |
4.1 Impact Analysis |
4.2 Market Drivers |
4.3 Market Restraints |
5 Bahamas Flavored Syrups Market Trends |
6 Bahamas Flavored Syrups Market Segmentations |
6.1 Bahamas Flavored Syrups Market, By Flavor |
6.1.1 Overview and Analysis |
6.1.2 Bahamas Flavored Syrups Market Revenues & Volume, By Fruit, 2022-2032F |
6.1.3 Bahamas Flavored Syrups Market Revenues & Volume, By Chocolate, 2022-2032F |
6.1.4 Bahamas Flavored Syrups Market Revenues & Volume, By Vanilla, 2022-2032F |
6.1.5 Bahamas Flavored Syrups Market Revenues & Volume, By Coffee, 2022-2032F |
6.1.6 Bahamas Flavored Syrups Market Revenues & Volume, By Herbs & Seasonings, 2022-2032F |
6.2 Bahamas Flavored Syrups Market, By Application |
6.2.1 Overview and Analysis |
6.2.2 Bahamas Flavored Syrups Market Revenues & Volume, By Beverages, 2022-2032F |
6.2.3 Bahamas Flavored Syrups Market Revenues & Volume, By Diary & Frozen Desserts, 2022-2032F |
6.2.4 Bahamas Flavored Syrups Market Revenues & Volume, By Confectionery, 2022-2032F |
6.2.5 Bahamas Flavored Syrups Market Revenues & Volume, By Bakery, 2022-2032F |
6.3 Bahamas Flavored Syrups Market, By Flavor Type |
6.3.1 Overview and Analysis |
6.3.2 Bahamas Flavored Syrups Market Revenues & Volume, By Sweet, 2022-2032F |
6.3.3 Bahamas Flavored Syrups Market Revenues & Volume, By Salty, 2022-2032F |
6.3.4 Bahamas Flavored Syrups Market Revenues & Volume, By Sour, 2022-2032F |
6.3.5 Bahamas Flavored Syrups Market Revenues & Volume, By Savory, 2022-2032F |
6.3.6 Bahamas Flavored Syrups Market Revenues & Volume, By Mint, 2022-2032F |
6.4 Bahamas Flavored Syrups Market, By Product type |
6.4.1 Overview and Analysis |
6.4.2 Bahamas Flavored Syrups Market Revenues & Volume, By Natural, 2022-2032F |
6.4.3 Bahamas Flavored Syrups Market Revenues & Volume, By Synthetic, 2022-2032F |
7 Bahamas Flavored Syrups Market Import-Export Trade Statistics |
7.1 Bahamas Flavored Syrups Market Export to Major Countries |
7.2 Bahamas Flavored Syrups Market Imports from Major Countries |
8 Bahamas Flavored Syrups Market Key Performance Indicators |
9 Bahamas Flavored Syrups Market - Opportunity Assessment |
9.1 Bahamas Flavored Syrups Market Opportunity Assessment, By Flavor, 2022 & 2032F |
9.2 Bahamas Flavored Syrups Market Opportunity Assessment, By Application, 2022 & 2032F |
9.3 Bahamas Flavored Syrups Market Opportunity Assessment, By Flavor Type, 2022 & 2032F |
9.4 Bahamas Flavored Syrups Market Opportunity Assessment, By Product type, 2022 & 2032F |
10 Bahamas Flavored Syrups Market - Competitive Landscape |
10.1 Bahamas Flavored Syrups Market Revenue Share, By Companies, 2025 |
10.2 Bahamas Flavored Syrups Market Competitive Benchmarking, By Operating and Technical Parameters |
11 Company Profiles |
12 Recommendations | 13 Disclaimer |
Global Go To Market Strategy - 2030
Export potential enables firms to identify high-growth global markets with greater confidence by combining advanced trade intelligence with a structured quantitative methodology. The framework analyzes emerging demand trends and country-level import patterns while integrating macroeconomic and trade datasets such as GDP and population forecasts, bilateral import–export flows, tariff structures, elasticity differentials between developed and developing economies, geographic distance, and import demand projections. Using weighted trade values from 2020–2024 as the base period to project country-to-country export potential for 2030, these inputs are operationalized through calculated drivers such as gravity model parameters, tariff impact factors, and projected GDP per-capita growth. Through an analysis of hidden potentials, demand hotspots, and market conditions that are most favorable to success, this method enables firms to focus on target countries, maximize returns, and global expansion with data, backed by accuracy.
By factoring in the projected importer demand gap that is currently unmet and could be potential opportunity, it identifies the potential for the Exporter (Country) among 190 countries, against the general trade analysis, which identifies the biggest importer or exporter.
To discover high-growth global markets and optimize your business strategy:
Click Here
Pricing
- Single User License$ 1,995
- Department License$ 2,400
- Site License$ 3,120
- Global License$ 3,795

Leadership Perspectives from Industry Events
Search
Thought Leadership and Analyst Meet


Our Clients
6WResearch In News
- Doha a strategic location for EV manufacturing hub: IPA Qatar
- Demand for luxury TVs surging in the GCC, says Samsung
- Empowering Growth: The Thriving Journey of Bangladesh’s Cable Industry
- Demand for luxury TVs surging in the GCC, says Samsung
- Video call with a traditional healer? Once unthinkable, it’s now common in South Africa
- Intelligent Buildings To Smooth GCC’s Path To Net Zero
Latest Reports
- Taiwan Airport Wireless Infrastructure Market (2026-2032)
- Vietnam Airport Wireless Infrastructure Market (2026-2032)
- Thailand Airport Wireless Infrastructure Market (2026-2032)
- South Korea Airport Wireless Infrastructure Market (2026-2032)
- Romania Airport Wireless Infrastructure Market (2026-2032)
- Qatar Airport Wireless Infrastructure Market (2026-2032)
- Philippines Airport Wireless Infrastructure Market (2026-2032)
- Japan Airport Wireless Infrastructure Market (2026-2032)
- Taiwan Airport Winter Services Market (2026-2032)
- Vietnam Airport Winter Services Market (2026-2032)
Industry Events and Analyst Meet

HIMTEX 2026

India Refining Summit 2026

India EV Show 2026

EV tech India Expo 2026

Auto Tech Asia 2026
Whitepaper
- Middle East & Africa Commercial Security Market Click here to view more.
- Middle East & Africa Fire Safety Systems & Equipment Market Click here to view more.
- GCC Drone Market Click here to view more.
- Middle East Lighting Fixture Market Click here to view more.
- GCC Physical & Perimeter Security Market Click here to view more.