Belgium Air plasma Spray (APS) Market (2026-2032) | Segmentation, Analysis, Forecast, Size & Revenue, Industry, Trends, Companies, Competitive Landscape, Growth, Outlook, Share, Value
Market Forecast By Material (Metal Alloys, Carbides, Blends, Cermets, Oxide Ceramics), By Process (Combustion Flame, Electrical), By Application (Wearing and Corrosion Protection, Thermal Insulation, Repair and Restoration), By End User (Aerospace, Automotive, Healthcare, Energy and Power, Electronics, Agricultural Machinery, Industrial Gas Turbines, Others) And Competitive Landscape
| Product Code: ETC6346700 | Publication Date: Sep 2024 | Updated Date: Apr 2026 | Product Type: Market Research Report | |
| Publisher: 6Wresearch | Author: Sumit Sagar | No. of Pages: 75 | No. of Figures: 35 | No. of Tables: 20 |
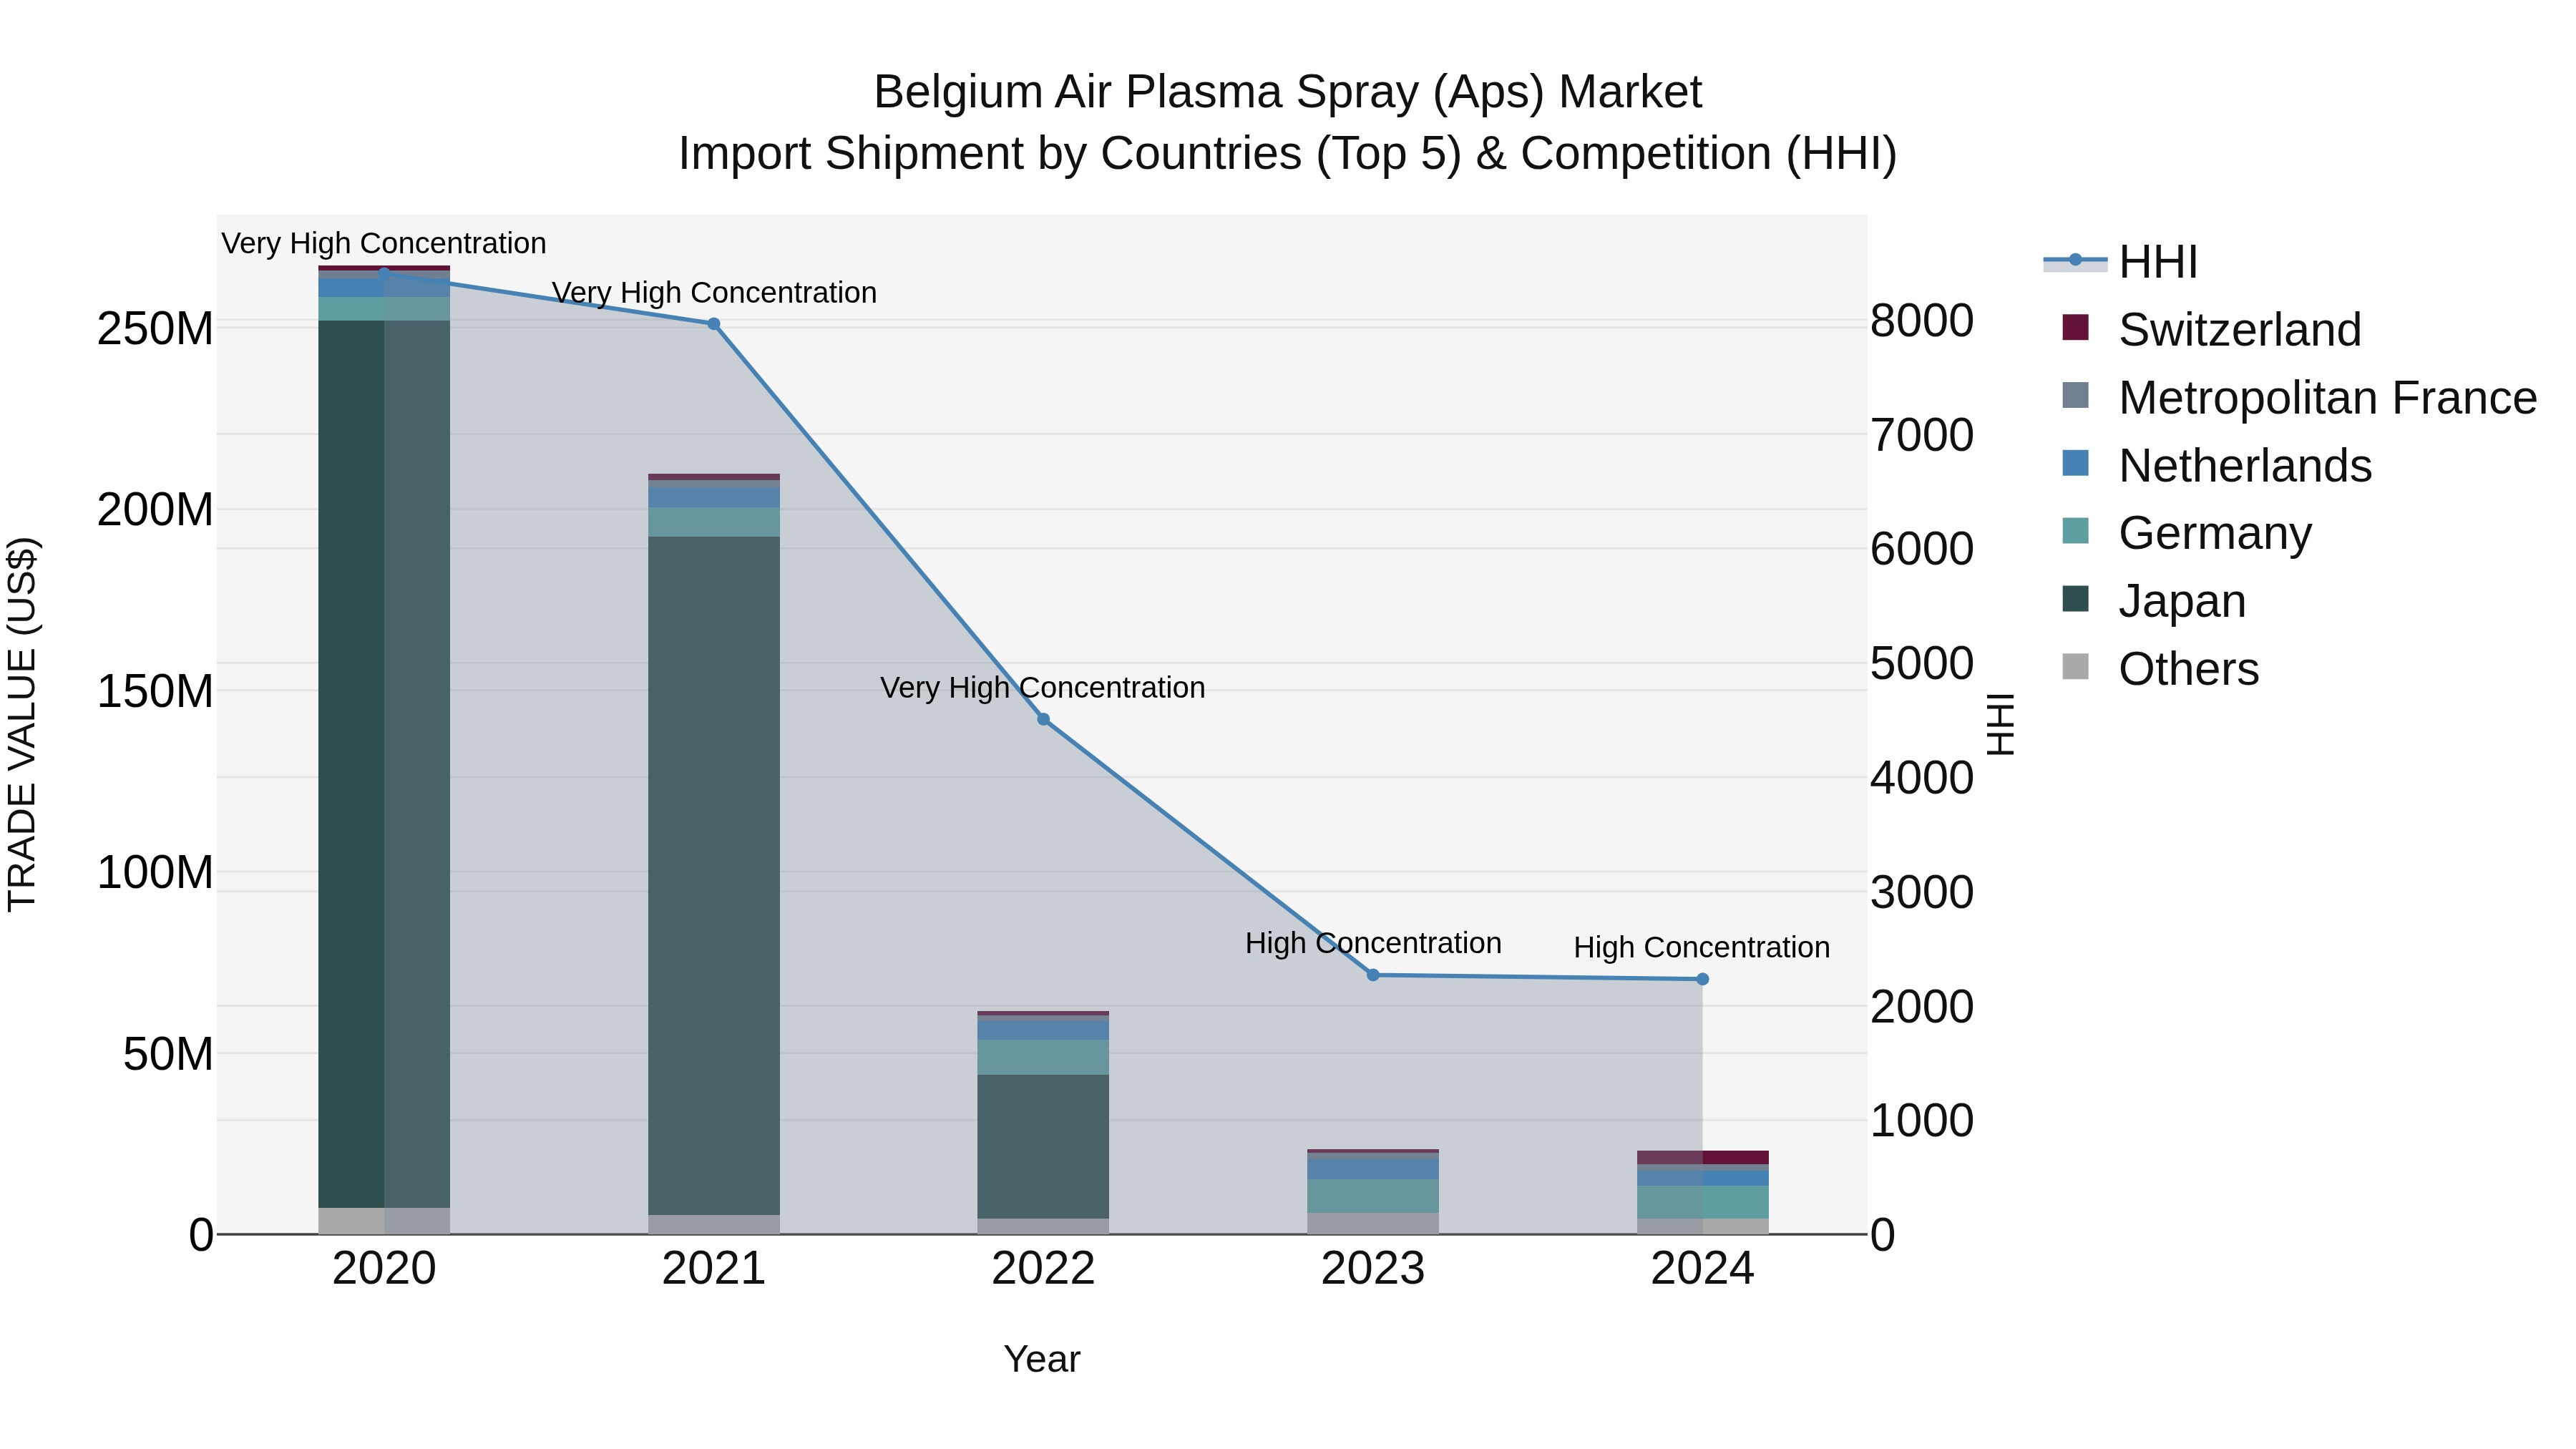
Belgium Air Plasma Spray (Aps) Market Top 5 Importing Countries and Market Competition (HHI) Analysis
In 2024, Belgium continues to see significant import shipments of air plasma spray (APS) equipment, with major exporters being Germany, Netherlands, Switzerland, Metropolitan France, and Poland. Despite a high Herfindahl-Hirschman Index (HHI) indicating concentrated market share, the industry experienced a sharp decline in compound annual growth rate (CAGR) of -45.8% from 2020 to 2024. Furthermore, the growth rate in 2024 alone saw a decrease of -1.66%, signaling a challenging year for the sector. Stakeholders should closely monitor these trends to navigate the evolving landscape of APS imports in Belgium.
Key Highlights of the Report:
- Belgium Air plasma Spray (APS) Market Outlook
- Market Size of Belgium Air plasma Spray (APS) Market, 2025
- Forecast of Belgium Air plasma Spray (APS) Market, 2032
- Historical Data and Forecast of Belgium Air plasma Spray (APS) Revenues & Volume for the Period 2022 - 2032
- Belgium Air plasma Spray (APS) Market Trend Evolution
- Belgium Air plasma Spray (APS) Market Drivers and Challenges
- Belgium Air plasma Spray (APS) Price Trends
- Belgium Air plasma Spray (APS) Porter's Five Forces
- Belgium Air plasma Spray (APS) Industry Life Cycle
- Historical Data and Forecast of Belgium Air plasma Spray (APS) Market Revenues & Volume By Material for the Period 2022 - 2032
- Historical Data and Forecast of Belgium Air plasma Spray (APS) Market Revenues & Volume By Metal Alloys for the Period 2022 - 2032
- Historical Data and Forecast of Belgium Air plasma Spray (APS) Market Revenues & Volume By Carbides for the Period 2022 - 2032
- Historical Data and Forecast of Belgium Air plasma Spray (APS) Market Revenues & Volume By Blends for the Period 2022 - 2032
- Historical Data and Forecast of Belgium Air plasma Spray (APS) Market Revenues & Volume By Cermets for the Period 2022 - 2032
- Historical Data and Forecast of Belgium Air plasma Spray (APS) Market Revenues & Volume By Oxide Ceramics for the Period 2022 - 2032
- Historical Data and Forecast of Belgium Air plasma Spray (APS) Market Revenues & Volume By Process for the Period 2022 - 2032
- Historical Data and Forecast of Belgium Air plasma Spray (APS) Market Revenues & Volume By Combustion Flame for the Period 2022 - 2032
- Historical Data and Forecast of Belgium Air plasma Spray (APS) Market Revenues & Volume By Electrical for the Period 2022 - 2032
- Historical Data and Forecast of Belgium Air plasma Spray (APS) Market Revenues & Volume By Application for the Period 2022 - 2032
- Historical Data and Forecast of Belgium Air plasma Spray (APS) Market Revenues & Volume By Wearing and Corrosion Protection for the Period 2022 - 2032
- Historical Data and Forecast of Belgium Air plasma Spray (APS) Market Revenues & Volume By Thermal Insulation for the Period 2022 - 2032
- Historical Data and Forecast of Belgium Air plasma Spray (APS) Market Revenues & Volume By Repair and Restoration for the Period 2022 - 2032
- Historical Data and Forecast of Belgium Air plasma Spray (APS) Market Revenues & Volume By End User for the Period 2022 - 2032
- Historical Data and Forecast of Belgium Air plasma Spray (APS) Market Revenues & Volume By Aerospace for the Period 2022 - 2032
- Historical Data and Forecast of Belgium Air plasma Spray (APS) Market Revenues & Volume By Automotive for the Period 2022 - 2032
- Historical Data and Forecast of Belgium Air plasma Spray (APS) Market Revenues & Volume By Healthcare for the Period 2022 - 2032
- Historical Data and Forecast of Belgium Air plasma Spray (APS) Market Revenues & Volume By Energy and Power for the Period 2022 - 2032
- Historical Data and Forecast of Belgium Air plasma Spray (APS) Market Revenues & Volume By Electronics for the Period 2022 - 2032
- Historical Data and Forecast of Belgium Air plasma Spray (APS) Market Revenues & Volume By Agricultural Machinery for the Period 2022 - 2032
- Historical Data and Forecast of Belgium Air plasma Spray (APS) Market Revenues & Volume By Industrial Gas Turbines for the Period 2022 - 2032
- Historical Data and Forecast of Belgium Air plasma Spray (APS) Market Revenues & Volume By Others for the Period 2022 - 2032
- Belgium Air plasma Spray (APS) Import Export Trade Statistics
- Market Opportunity Assessment By Material
- Market Opportunity Assessment By Process
- Market Opportunity Assessment By Application
- Market Opportunity Assessment By End User
- Belgium Air plasma Spray (APS) Top Companies Market Share
- Belgium Air plasma Spray (APS) Competitive Benchmarking By Technical and Operational Parameters
- Belgium Air plasma Spray (APS) Company Profiles
- Belgium Air plasma Spray (APS) Key Strategic Recommendations
Frequently Asked Questions About the Market Study (FAQs):
6Wresearch actively monitors the Belgium Air plasma Spray (APS) Market and publishes its comprehensive annual report, highlighting emerging trends, growth drivers, revenue analysis, and forecast outlook. Our insights help businesses to make data-backed strategic decisions with ongoing market dynamics. Our analysts track relevent industries related to the Belgium Air plasma Spray (APS) Market, allowing our clients with actionable intelligence and reliable forecasts tailored to emerging regional needs.
Yes, we provide customisation as per your requirements. To learn more, feel free to contact us on sales@6wresearch.com
1 Executive Summary |
2 Introduction |
2.1 Key Highlights of the Report |
2.2 Report Description |
2.3 Market Scope & Segmentation |
2.4 Research Methodology |
2.5 Assumptions |
3 Belgium Air plasma Spray (APS) Market Overview |
3.1 Belgium Country Macro Economic Indicators |
3.2 Belgium Air plasma Spray (APS) Market Revenues & Volume, 2022 & 2032F |
3.3 Belgium Air plasma Spray (APS) Market - Industry Life Cycle |
3.4 Belgium Air plasma Spray (APS) Market - Porter's Five Forces |
3.5 Belgium Air plasma Spray (APS) Market Revenues & Volume Share, By Material, 2022 & 2032F |
3.6 Belgium Air plasma Spray (APS) Market Revenues & Volume Share, By Process, 2022 & 2032F |
3.7 Belgium Air plasma Spray (APS) Market Revenues & Volume Share, By Application, 2022 & 2032F |
3.8 Belgium Air plasma Spray (APS) Market Revenues & Volume Share, By End User, 2022 & 2032F |
4 Belgium Air plasma Spray (APS) Market Dynamics |
4.1 Impact Analysis |
4.2 Market Drivers |
4.2.1 Increasing demand for advanced surface coating solutions in industries such as aerospace, automotive, and healthcare. |
4.2.2 Technological advancements in air plasma spray (APS) technology leading to enhanced performance and efficiency. |
4.2.3 Growing focus on achieving cost efficiency and environmental sustainability through APS coatings. |
4.3 Market Restraints |
4.3.1 High initial investment and operating costs associated with air plasma spray equipment. |
4.3.2 Limited awareness and understanding of the benefits of APS coatings among potential end-users. |
4.3.3 Stringent regulations and standards governing the use of certain chemicals and materials in APS processes. |
5 Belgium Air plasma Spray (APS) Market Trends |
6 Belgium Air plasma Spray (APS) Market, By Types |
6.1 Belgium Air plasma Spray (APS) Market, By Material |
6.1.1 Overview and Analysis |
6.1.2 Belgium Air plasma Spray (APS) Market Revenues & Volume, By Material, 2022 - 2032F |
6.1.3 Belgium Air plasma Spray (APS) Market Revenues & Volume, By Metal Alloys, 2022 - 2032F |
6.1.4 Belgium Air plasma Spray (APS) Market Revenues & Volume, By Carbides, 2022 - 2032F |
6.1.5 Belgium Air plasma Spray (APS) Market Revenues & Volume, By Blends, 2022 - 2032F |
6.1.6 Belgium Air plasma Spray (APS) Market Revenues & Volume, By Cermets, 2022 - 2032F |
6.1.7 Belgium Air plasma Spray (APS) Market Revenues & Volume, By Oxide Ceramics, 2022 - 2032F |
6.2 Belgium Air plasma Spray (APS) Market, By Process |
6.2.1 Overview and Analysis |
6.2.2 Belgium Air plasma Spray (APS) Market Revenues & Volume, By Combustion Flame, 2022 - 2032F |
6.2.3 Belgium Air plasma Spray (APS) Market Revenues & Volume, By Electrical, 2022 - 2032F |
6.3 Belgium Air plasma Spray (APS) Market, By Application |
6.3.1 Overview and Analysis |
6.3.2 Belgium Air plasma Spray (APS) Market Revenues & Volume, By Wearing and Corrosion Protection, 2022 - 2032F |
6.3.3 Belgium Air plasma Spray (APS) Market Revenues & Volume, By Thermal Insulation, 2022 - 2032F |
6.3.4 Belgium Air plasma Spray (APS) Market Revenues & Volume, By Repair and Restoration, 2022 - 2032F |
6.4 Belgium Air plasma Spray (APS) Market, By End User |
6.4.1 Overview and Analysis |
6.4.2 Belgium Air plasma Spray (APS) Market Revenues & Volume, By Aerospace, 2022 - 2032F |
6.4.3 Belgium Air plasma Spray (APS) Market Revenues & Volume, By Automotive, 2022 - 2032F |
6.4.4 Belgium Air plasma Spray (APS) Market Revenues & Volume, By Healthcare, 2022 - 2032F |
6.4.5 Belgium Air plasma Spray (APS) Market Revenues & Volume, By Energy and Power, 2022 - 2032F |
6.4.6 Belgium Air plasma Spray (APS) Market Revenues & Volume, By Electronics, 2022 - 2032F |
6.4.7 Belgium Air plasma Spray (APS) Market Revenues & Volume, By Agricultural Machinery, 2022 - 2032F |
6.4.8 Belgium Air plasma Spray (APS) Market Revenues & Volume, By Others, 2022 - 2032F |
6.4.9 Belgium Air plasma Spray (APS) Market Revenues & Volume, By Others, 2022 - 2032F |
7 Belgium Air plasma Spray (APS) Market Import-Export Trade Statistics |
7.1 Belgium Air plasma Spray (APS) Market Export to Major Countries |
7.2 Belgium Air plasma Spray (APS) Market Imports from Major Countries |
8 Belgium Air plasma Spray (APS) Market Key Performance Indicators |
8.1 Average thickness of APS coatings applied per unit time. |
8.2 Percentage of defects or rework needed in APS-coated products. |
8.3 Energy efficiency of APS equipment measured in kilowatt-hours per unit of production. |
9 Belgium Air plasma Spray (APS) Market - Opportunity Assessment |
9.1 Belgium Air plasma Spray (APS) Market Opportunity Assessment, By Material, 2022 & 2032F |
9.2 Belgium Air plasma Spray (APS) Market Opportunity Assessment, By Process, 2022 & 2032F |
9.3 Belgium Air plasma Spray (APS) Market Opportunity Assessment, By Application, 2022 & 2032F |
9.4 Belgium Air plasma Spray (APS) Market Opportunity Assessment, By End User, 2022 & 2032F |
10 Belgium Air plasma Spray (APS) Market - Competitive Landscape |
10.1 Belgium Air plasma Spray (APS) Market Revenue Share, By Companies, 2025 |
10.2 Belgium Air plasma Spray (APS) Market Competitive Benchmarking, By Operating and Technical Parameters |
11 Company Profiles |
12 Recommendations |
13 Disclaimer |
Export potential assessment - trade Analytics for 2030
Export potential enables firms to identify high-growth global markets with greater confidence by combining advanced trade intelligence with a structured quantitative methodology. The framework analyzes emerging demand trends and country-level import patterns while integrating macroeconomic and trade datasets such as GDP and population forecasts, bilateral import–export flows, tariff structures, elasticity differentials between developed and developing economies, geographic distance, and import demand projections. Using weighted trade values from 2020–2024 as the base period to project country-to-country export potential for 2030, these inputs are operationalized through calculated drivers such as gravity model parameters, tariff impact factors, and projected GDP per-capita growth. Through an analysis of hidden potentials, demand hotspots, and market conditions that are most favorable to success, this method enables firms to focus on target countries, maximize returns, and global expansion with data, backed by accuracy.
By factoring in the projected importer demand gap that is currently unmet and could be potential opportunity, it identifies the potential for the Exporter (Country) among 190 countries, against the general trade analysis, which identifies the biggest importer or exporter.
To discover high-growth global markets and optimize your business strategy:
Click Here
Pricing
- Single User License$ 1,995
- Department License$ 2,400
- Site License$ 3,120
- Global License$ 3,795

Search
Thought Leadership and Analyst Meet


Our Clients
Latest Reports
- China Electric Appliance Rental Market (2026-2032) | Trends, Revenue, Growth, Challenges, Size, Value, Outlook, Pricing, Strategy, Insights, Restraints, segmentation, Companies, Investment Opportunities, Analysis, Demand, Drivers, Competition, Forecast, Share
- Chile Electric Appliance Rental Market (2026-2032) | Outlook, Competition, Drivers, Strategy, Revenue, Analysis, Value, Pricing, Restraints, Size, Demand, Share, Growth, Forecast, Challenges, Insights, Investment Opportunities, Companies, Trends, segmentation
- Cambodia Electric Appliance Rental Market (2026-2032) | Companies, Analysis, Restraints, Pricing, Insights, Challenges, Outlook, Strategy, Forecast, Trends, Competition, Value, Revenue, Investment Opportunities, segmentation, Drivers, Size, Demand, Growth, Share
- Brazil Electric Appliance Rental Market (2026-2032) | Revenue, Strategy, Forecast, Companies, segmentation, Competition, Size, Investment Opportunities, Pricing, Restraints, Outlook, Challenges, Analysis, Drivers, Value, Demand, Insights, Trends, Growth, Share
- Bangladesh Electric Appliance Rental Market (2026-2032) | Drivers, Forecast, Investment Opportunities, Strategy, Insights, Demand, Challenges, Outlook, Trends, Competition, Value, Revenue, Size, Pricing, Analysis, Companies, Restraints, segmentation, Share, Growth
- Bahrain Electric Appliance Rental Market (2026-2032) | Outlook, Size, Competition, Restraints, Drivers, Value, Trends, Investment Opportunities, Insights, Forecast, Revenue, Strategy, Growth, Share, Demand, Analysis, Challenges, Companies, segmentation, Pricing
- Azerbaijan Electric Appliance Rental Market (2026-2032) | Trends, Investment Opportunities, Restraints, Insights, Strategy, Competition, Value, Growth, Demand, Drivers, Analysis, Forecast, Size, Share, Outlook, segmentation, Pricing, Challenges, Revenue, Companies
- Australia Electric Appliance Rental Market (2026-2032) | Challenges, Restraints, Forecast, Demand, Size, Competition, Pricing, Investment Opportunities, Revenue, Trends, Drivers, Growth, Outlook, Analysis, Strategy, Value, segmentation, Insights, Companies, Share
- Argentina Electric Appliance Rental Market (2026-2032) | Growth, Trends, Insights, Outlook, Forecast, Size, Drivers, Analysis, Restraints, Challenges, Share, Revenue, Investment Opportunities, Strategy, Demand, Value, Companies, segmentation, Competition, Pricing
- Algeria Electric Appliance Rental Market (2026-2032) | Share, Size, Value, Strategy, Competition, Outlook, Challenges, Companies, Trends, Pricing, Insights, Forecast, Investment Opportunities, Revenue, Growth, Restraints, segmentation, Analysis, Demand, Drivers
Industry Events and Analyst Meet

HIMTEX 2026

India Refining Summit 2026

India EV Show 2026

EV tech India Expo 2026

Auto Tech Asia 2026
Whitepaper
- Middle East & Africa Commercial Security Market Click here to view more.
- Middle East & Africa Fire Safety Systems & Equipment Market Click here to view more.
- GCC Drone Market Click here to view more.
- Middle East Lighting Fixture Market Click here to view more.
- GCC Physical & Perimeter Security Market Click here to view more.
6WResearch In News
- Doha a strategic location for EV manufacturing hub: IPA Qatar
- Demand for luxury TVs surging in the GCC, says Samsung
- Empowering Growth: The Thriving Journey of Bangladesh’s Cable Industry
- Demand for luxury TVs surging in the GCC, says Samsung
- Video call with a traditional healer? Once unthinkable, it’s now common in South Africa
- Intelligent Buildings To Smooth GCC’s Path To Net Zero