Belgium Artificial Skin Market (2026-2032) | Value, Analysis, Competitive Landscape, Trends, Companies, Industry, Forecast, Growth, Outlook, Size & Revenue, Segmentation, Share
Market Forecast By Product Type (Permanent, Temporary, Composite), By Replacement Area (Dermal, Epidermal, Composed), By Material (Natural, Synthetic), By Application (Acute wounds, Chronic wounds, Others) And Competitive Landscape
| Product Code: ETC6347405 | Publication Date: Sep 2024 | Updated Date: Apr 2026 | Product Type: Market Research Report | |
| Publisher: 6Wresearch | Author: Vasudha | No. of Pages: 75 | No. of Figures: 35 | No. of Tables: 20 |
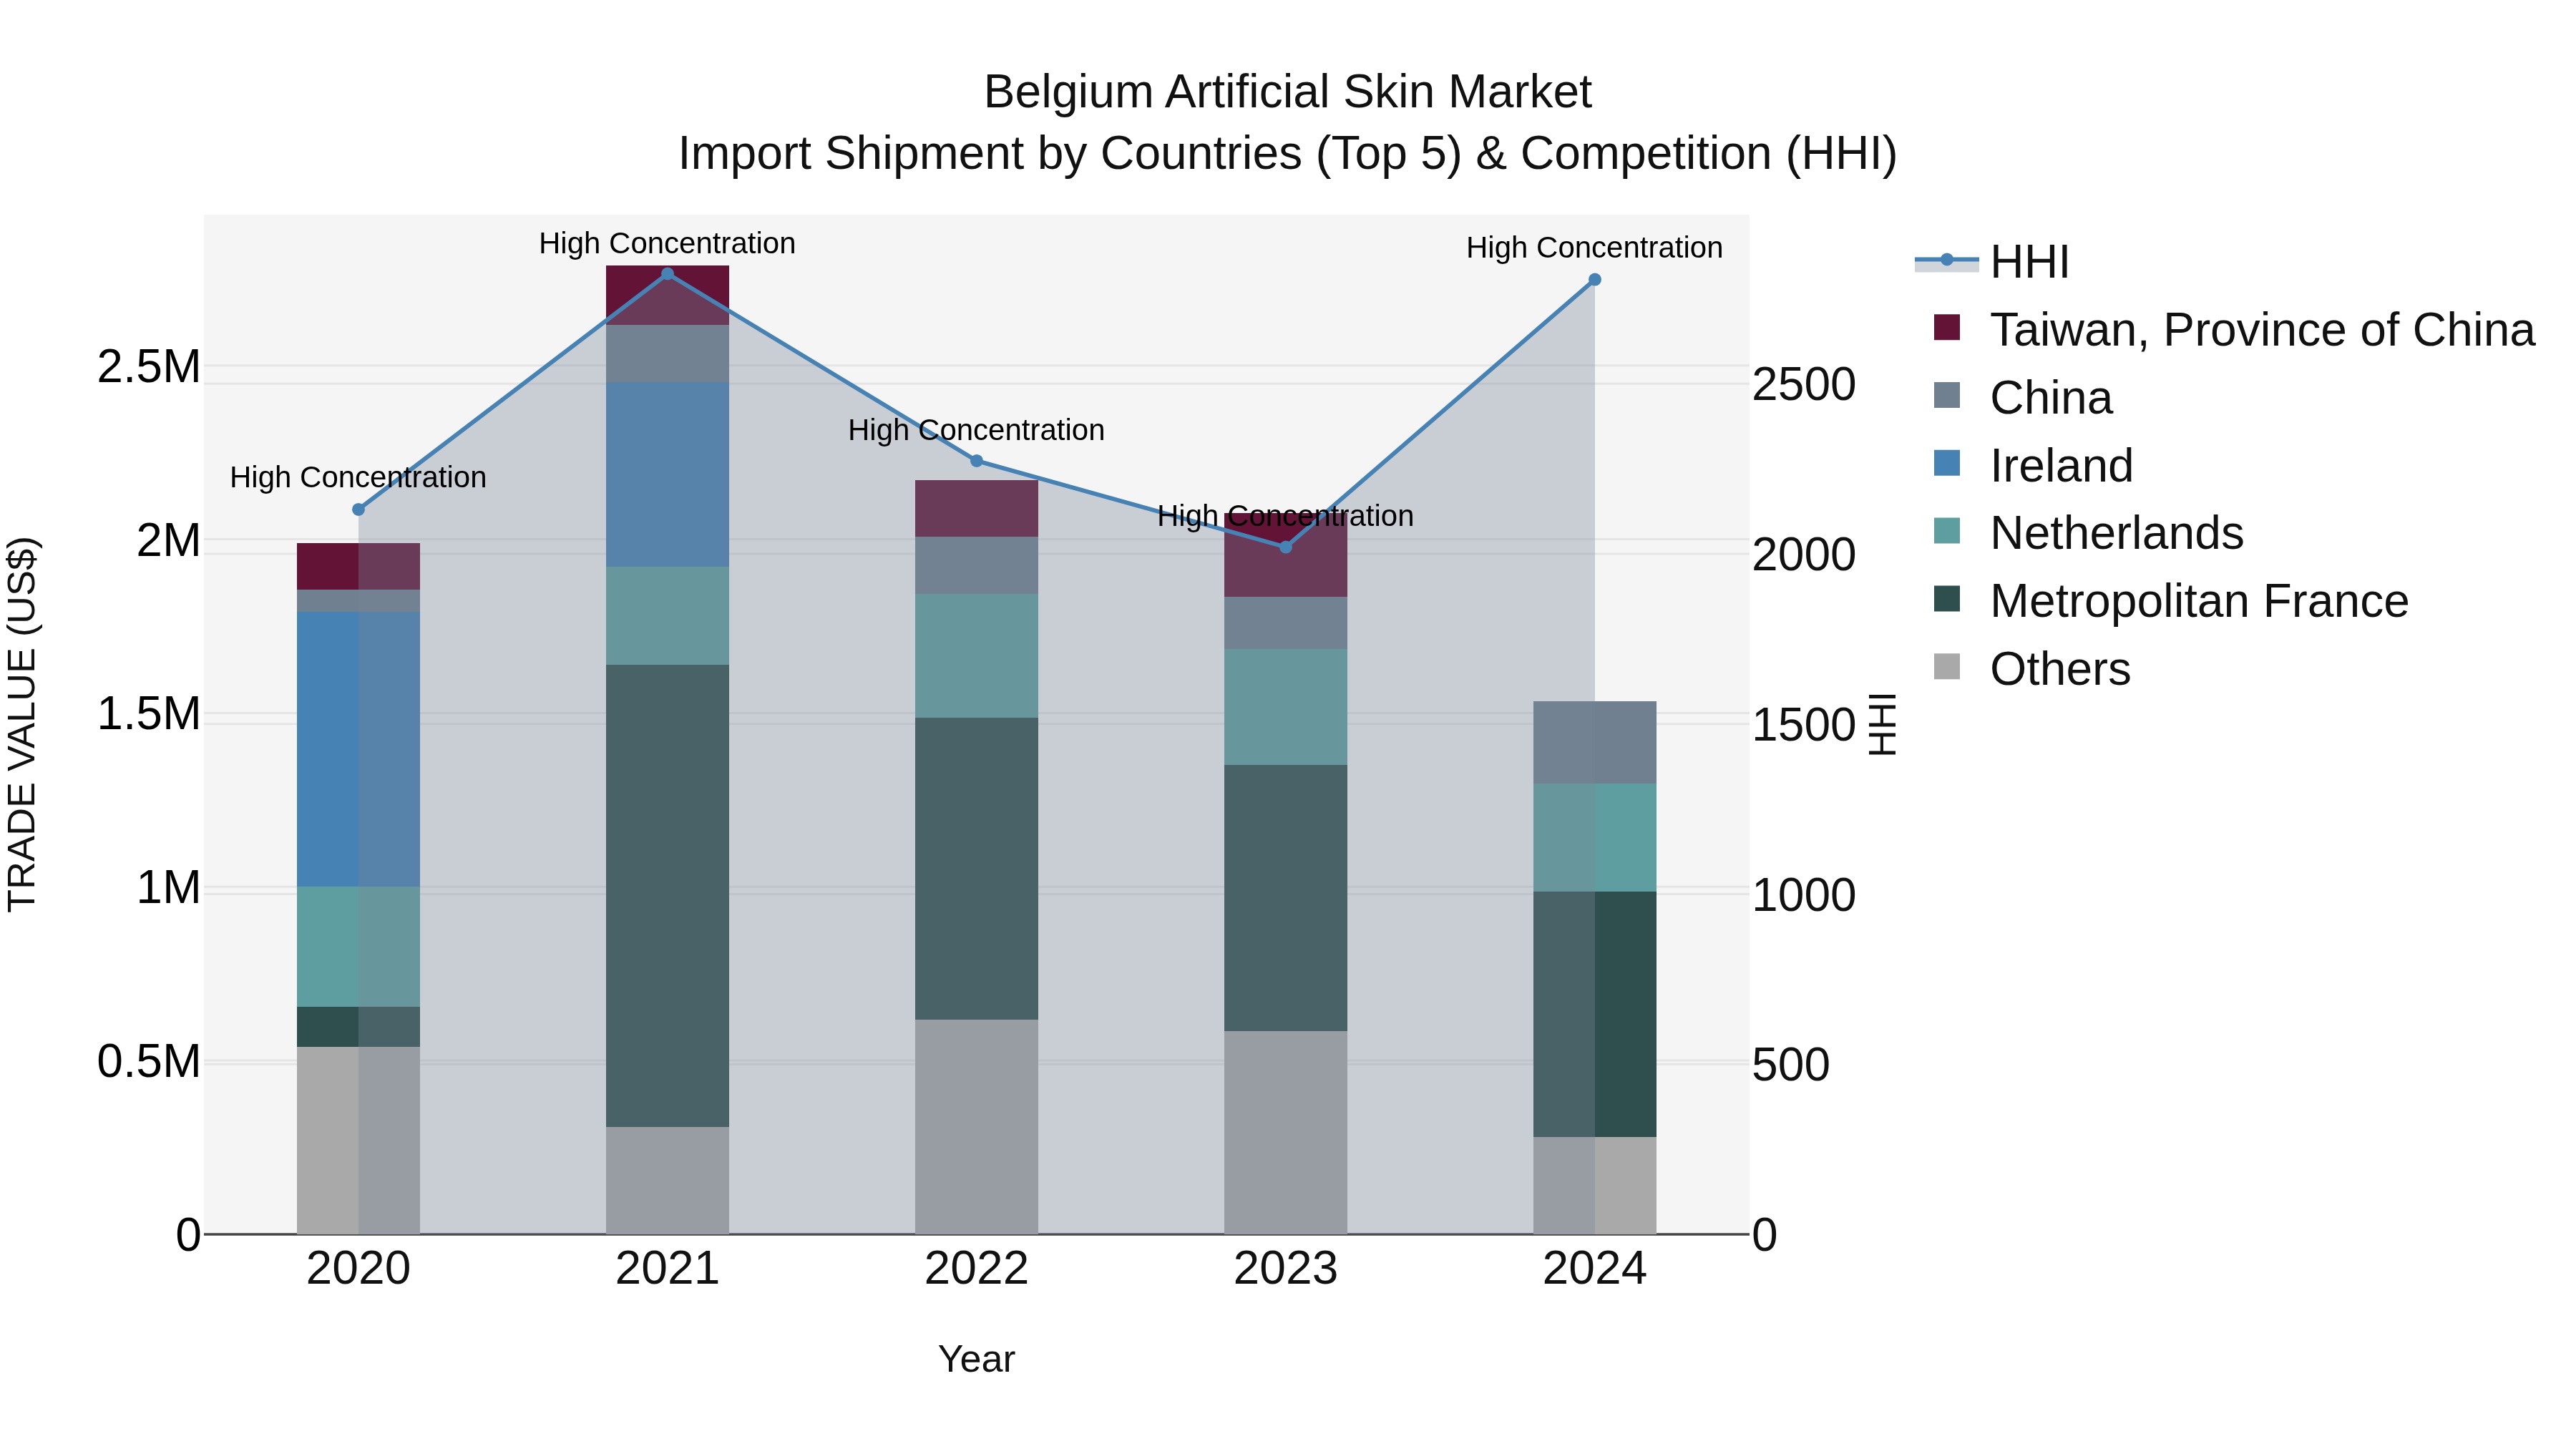
Belgium Artificial Skin Market Top 5 Importing Countries and Market Competition (HHI) Analysis
Despite a high concentration of import shipments in Belgium for artificial skin, the market experienced a significant decline with a negative CAGR of -6.31% from 2020 to 2024. The growth rate plummeted by -26.12% from 2023 to 2024. Top exporting countries to Belgium include Metropolitan France, Netherlands, China, USA, and Turkey, indicating a diverse source of artificial skin imports. This data suggests a challenging market landscape for artificial skin imports in Belgium, highlighting the need for strategic adjustments and market insights for industry players.
Key Highlights of the Report:
- Belgium Artificial Skin Market Outlook
- Market Size of Belgium Artificial Skin Market, 2025
- Forecast of Belgium Artificial Skin Market, 2032
- Historical Data and Forecast of Belgium Artificial Skin Revenues & Volume for the Period 2022 - 2032
- Belgium Artificial Skin Market Trend Evolution
- Belgium Artificial Skin Market Drivers and Challenges
- Belgium Artificial Skin Price Trends
- Belgium Artificial Skin Porter's Five Forces
- Belgium Artificial Skin Industry Life Cycle
- Historical Data and Forecast of Belgium Artificial Skin Market Revenues & Volume By Product Type for the Period 2022 - 2032
- Historical Data and Forecast of Belgium Artificial Skin Market Revenues & Volume By Permanent for the Period 2022 - 2032
- Historical Data and Forecast of Belgium Artificial Skin Market Revenues & Volume By Temporary for the Period 2022 - 2032
- Historical Data and Forecast of Belgium Artificial Skin Market Revenues & Volume By Composite for the Period 2022 - 2032
- Historical Data and Forecast of Belgium Artificial Skin Market Revenues & Volume By Replacement Area for the Period 2022 - 2032
- Historical Data and Forecast of Belgium Artificial Skin Market Revenues & Volume By Dermal for the Period 2022 - 2032
- Historical Data and Forecast of Belgium Artificial Skin Market Revenues & Volume By Epidermal for the Period 2022 - 2032
- Historical Data and Forecast of Belgium Artificial Skin Market Revenues & Volume By Composed for the Period 2022 - 2032
- Historical Data and Forecast of Belgium Artificial Skin Market Revenues & Volume By Material for the Period 2022 - 2032
- Historical Data and Forecast of Belgium Artificial Skin Market Revenues & Volume By Natural for the Period 2022 - 2032
- Historical Data and Forecast of Belgium Artificial Skin Market Revenues & Volume By Synthetic for the Period 2022 - 2032
- Historical Data and Forecast of Belgium Artificial Skin Market Revenues & Volume By Application for the Period 2022 - 2032
- Historical Data and Forecast of Belgium Artificial Skin Market Revenues & Volume By Acute wounds for the Period 2022 - 2032
- Historical Data and Forecast of Belgium Artificial Skin Market Revenues & Volume By Chronic wounds for the Period 2022 - 2032
- Historical Data and Forecast of Belgium Artificial Skin Market Revenues & Volume By Others for the Period 2022 - 2032
- Belgium Artificial Skin Import Export Trade Statistics
- Market Opportunity Assessment By Product Type
- Market Opportunity Assessment By Replacement Area
- Market Opportunity Assessment By Material
- Market Opportunity Assessment By Application
- Belgium Artificial Skin Top Companies Market Share
- Belgium Artificial Skin Competitive Benchmarking By Technical and Operational Parameters
- Belgium Artificial Skin Company Profiles
- Belgium Artificial Skin Key Strategic Recommendations
Frequently Asked Questions About the Market Study (FAQs):
6Wresearch actively monitors the Belgium Artificial Skin Market and publishes its comprehensive annual report, highlighting emerging trends, growth drivers, revenue analysis, and forecast outlook. Our insights help businesses to make data-backed strategic decisions with ongoing market dynamics. Our analysts track relevent industries related to the Belgium Artificial Skin Market, allowing our clients with actionable intelligence and reliable forecasts tailored to emerging regional needs.
Yes, we provide customisation as per your requirements. To learn more, feel free to contact us on sales@6wresearch.com
1 Executive Summary |
2 Introduction |
2.1 Key Highlights of the Report |
2.2 Report Description |
2.3 Market Scope & Segmentation |
2.4 Research Methodology |
2.5 Assumptions |
3 Belgium Artificial Skin Market Overview |
3.1 Belgium Country Macro Economic Indicators |
3.2 Belgium Artificial Skin Market Revenues & Volume, 2022 & 2032F |
3.3 Belgium Artificial Skin Market - Industry Life Cycle |
3.4 Belgium Artificial Skin Market - Porter's Five Forces |
3.5 Belgium Artificial Skin Market Revenues & Volume Share, By Product Type, 2022 & 2032F |
3.6 Belgium Artificial Skin Market Revenues & Volume Share, By Replacement Area, 2022 & 2032F |
3.7 Belgium Artificial Skin Market Revenues & Volume Share, By Material, 2022 & 2032F |
3.8 Belgium Artificial Skin Market Revenues & Volume Share, By Application, 2022 & 2032F |
4 Belgium Artificial Skin Market Dynamics |
4.1 Impact Analysis |
4.2 Market Drivers |
4.2.1 Increasing demand for artificial skin in Belgium due to the rising prevalence of chronic wounds and burn injuries. |
4.2.2 Technological advancements in artificial skin products leading to improved efficacy and safety. |
4.2.3 Growing investments in research and development by key market players to introduce innovative artificial skin solutions. |
4.3 Market Restraints |
4.3.1 Stringent regulatory requirements for approval and commercialization of artificial skin products in Belgium. |
4.3.2 High cost associated with artificial skin products limiting their accessibility to a wider population. |
4.3.3 Limited awareness about the benefits and applications of artificial skin among healthcare professionals and patients in Belgium. |
5 Belgium Artificial Skin Market Trends |
6 Belgium Artificial Skin Market, By Types |
6.1 Belgium Artificial Skin Market, By Product Type |
6.1.1 Overview and Analysis |
6.1.2 Belgium Artificial Skin Market Revenues & Volume, By Product Type, 2022 - 2032F |
6.1.3 Belgium Artificial Skin Market Revenues & Volume, By Permanent, 2022 - 2032F |
6.1.4 Belgium Artificial Skin Market Revenues & Volume, By Temporary, 2022 - 2032F |
6.1.5 Belgium Artificial Skin Market Revenues & Volume, By Composite, 2022 - 2032F |
6.2 Belgium Artificial Skin Market, By Replacement Area |
6.2.1 Overview and Analysis |
6.2.2 Belgium Artificial Skin Market Revenues & Volume, By Dermal, 2022 - 2032F |
6.2.3 Belgium Artificial Skin Market Revenues & Volume, By Epidermal, 2022 - 2032F |
6.2.4 Belgium Artificial Skin Market Revenues & Volume, By Composed, 2022 - 2032F |
6.3 Belgium Artificial Skin Market, By Material |
6.3.1 Overview and Analysis |
6.3.2 Belgium Artificial Skin Market Revenues & Volume, By Natural, 2022 - 2032F |
6.3.3 Belgium Artificial Skin Market Revenues & Volume, By Synthetic, 2022 - 2032F |
6.4 Belgium Artificial Skin Market, By Application |
6.4.1 Overview and Analysis |
6.4.2 Belgium Artificial Skin Market Revenues & Volume, By Acute wounds, 2022 - 2032F |
6.4.3 Belgium Artificial Skin Market Revenues & Volume, By Chronic wounds, 2022 - 2032F |
6.4.4 Belgium Artificial Skin Market Revenues & Volume, By Others, 2022 - 2032F |
7 Belgium Artificial Skin Market Import-Export Trade Statistics |
7.1 Belgium Artificial Skin Market Export to Major Countries |
7.2 Belgium Artificial Skin Market Imports from Major Countries |
8 Belgium Artificial Skin Market Key Performance Indicators |
8.1 Average healing time of wounds treated with artificial skin products. |
8.2 Patient satisfaction rates with the outcomes of artificial skin treatments. |
8.3 Number of clinical trials conducted for testing the effectiveness of new artificial skin technologies. |
8.4 Adoption rate of artificial skin products in different healthcare facilities across Belgium. |
8.5 Rate of complications or adverse reactions reported with the use of artificial skin products in Belgium. |
9 Belgium Artificial Skin Market - Opportunity Assessment |
9.1 Belgium Artificial Skin Market Opportunity Assessment, By Product Type, 2022 & 2032F |
9.2 Belgium Artificial Skin Market Opportunity Assessment, By Replacement Area, 2022 & 2032F |
9.3 Belgium Artificial Skin Market Opportunity Assessment, By Material, 2022 & 2032F |
9.4 Belgium Artificial Skin Market Opportunity Assessment, By Application, 2022 & 2032F |
10 Belgium Artificial Skin Market - Competitive Landscape |
10.1 Belgium Artificial Skin Market Revenue Share, By Companies, 2025 |
10.2 Belgium Artificial Skin Market Competitive Benchmarking, By Operating and Technical Parameters |
11 Company Profiles |
12 Recommendations |
13 Disclaimer |
Export potential assessment - trade Analytics for 2030
Export potential enables firms to identify high-growth global markets with greater confidence by combining advanced trade intelligence with a structured quantitative methodology. The framework analyzes emerging demand trends and country-level import patterns while integrating macroeconomic and trade datasets such as GDP and population forecasts, bilateral import–export flows, tariff structures, elasticity differentials between developed and developing economies, geographic distance, and import demand projections. Using weighted trade values from 2020–2024 as the base period to project country-to-country export potential for 2030, these inputs are operationalized through calculated drivers such as gravity model parameters, tariff impact factors, and projected GDP per-capita growth. Through an analysis of hidden potentials, demand hotspots, and market conditions that are most favorable to success, this method enables firms to focus on target countries, maximize returns, and global expansion with data, backed by accuracy.
By factoring in the projected importer demand gap that is currently unmet and could be potential opportunity, it identifies the potential for the Exporter (Country) among 190 countries, against the general trade analysis, which identifies the biggest importer or exporter.
To discover high-growth global markets and optimize your business strategy:
Click Here
Pricing
- Single User License$ 1,995
- Department License$ 2,400
- Site License$ 3,120
- Global License$ 3,795

Search
Thought Leadership and Analyst Meet


Our Clients
Latest Reports
- China Electric Appliance Rental Market (2026-2032) | Trends, Revenue, Growth, Challenges, Size, Value, Outlook, Pricing, Strategy, Insights, Restraints, segmentation, Companies, Investment Opportunities, Analysis, Demand, Drivers, Competition, Forecast, Share
- Chile Electric Appliance Rental Market (2026-2032) | Outlook, Competition, Drivers, Strategy, Revenue, Analysis, Value, Pricing, Restraints, Size, Demand, Share, Growth, Forecast, Challenges, Insights, Investment Opportunities, Companies, Trends, segmentation
- Cambodia Electric Appliance Rental Market (2026-2032) | Companies, Analysis, Restraints, Pricing, Insights, Challenges, Outlook, Strategy, Forecast, Trends, Competition, Value, Revenue, Investment Opportunities, segmentation, Drivers, Size, Demand, Growth, Share
- Brazil Electric Appliance Rental Market (2026-2032) | Revenue, Strategy, Forecast, Companies, segmentation, Competition, Size, Investment Opportunities, Pricing, Restraints, Outlook, Challenges, Analysis, Drivers, Value, Demand, Insights, Trends, Growth, Share
- Bangladesh Electric Appliance Rental Market (2026-2032) | Drivers, Forecast, Investment Opportunities, Strategy, Insights, Demand, Challenges, Outlook, Trends, Competition, Value, Revenue, Size, Pricing, Analysis, Companies, Restraints, segmentation, Share, Growth
- Bahrain Electric Appliance Rental Market (2026-2032) | Outlook, Size, Competition, Restraints, Drivers, Value, Trends, Investment Opportunities, Insights, Forecast, Revenue, Strategy, Growth, Share, Demand, Analysis, Challenges, Companies, segmentation, Pricing
- Azerbaijan Electric Appliance Rental Market (2026-2032) | Trends, Investment Opportunities, Restraints, Insights, Strategy, Competition, Value, Growth, Demand, Drivers, Analysis, Forecast, Size, Share, Outlook, segmentation, Pricing, Challenges, Revenue, Companies
- Australia Electric Appliance Rental Market (2026-2032) | Challenges, Restraints, Forecast, Demand, Size, Competition, Pricing, Investment Opportunities, Revenue, Trends, Drivers, Growth, Outlook, Analysis, Strategy, Value, segmentation, Insights, Companies, Share
- Argentina Electric Appliance Rental Market (2026-2032) | Growth, Trends, Insights, Outlook, Forecast, Size, Drivers, Analysis, Restraints, Challenges, Share, Revenue, Investment Opportunities, Strategy, Demand, Value, Companies, segmentation, Competition, Pricing
- Algeria Electric Appliance Rental Market (2026-2032) | Share, Size, Value, Strategy, Competition, Outlook, Challenges, Companies, Trends, Pricing, Insights, Forecast, Investment Opportunities, Revenue, Growth, Restraints, segmentation, Analysis, Demand, Drivers
Industry Events and Analyst Meet

HIMTEX 2026

India Refining Summit 2026

India EV Show 2026

EV tech India Expo 2026

Auto Tech Asia 2026
Whitepaper
- Middle East & Africa Commercial Security Market Click here to view more.
- Middle East & Africa Fire Safety Systems & Equipment Market Click here to view more.
- GCC Drone Market Click here to view more.
- Middle East Lighting Fixture Market Click here to view more.
- GCC Physical & Perimeter Security Market Click here to view more.
6WResearch In News
- Doha a strategic location for EV manufacturing hub: IPA Qatar
- Demand for luxury TVs surging in the GCC, says Samsung
- Empowering Growth: The Thriving Journey of Bangladesh’s Cable Industry
- Demand for luxury TVs surging in the GCC, says Samsung
- Video call with a traditional healer? Once unthinkable, it’s now common in South Africa
- Intelligent Buildings To Smooth GCC’s Path To Net Zero