Belgium Carnation Market (2025-2031) | Companies, Value, Share, Forecast, Trends, Growth, Analysis, Outlook, Segmentation, Revenue, Size & Industry
Market Forecast By Products Type (Standard Carnation, Miniature Carnation), By Application (Domestic Field, Business Field) And Competitive Landscape
| Product Code: ETC5341150 | Publication Date: Nov 2023 | Updated Date: Aug 2025 | Product Type: Market Research Report | |
| Publisher: 6Wresearch | Author: Bhawna Singh | No. of Pages: 60 | No. of Figures: 30 | No. of Tables: 5 |
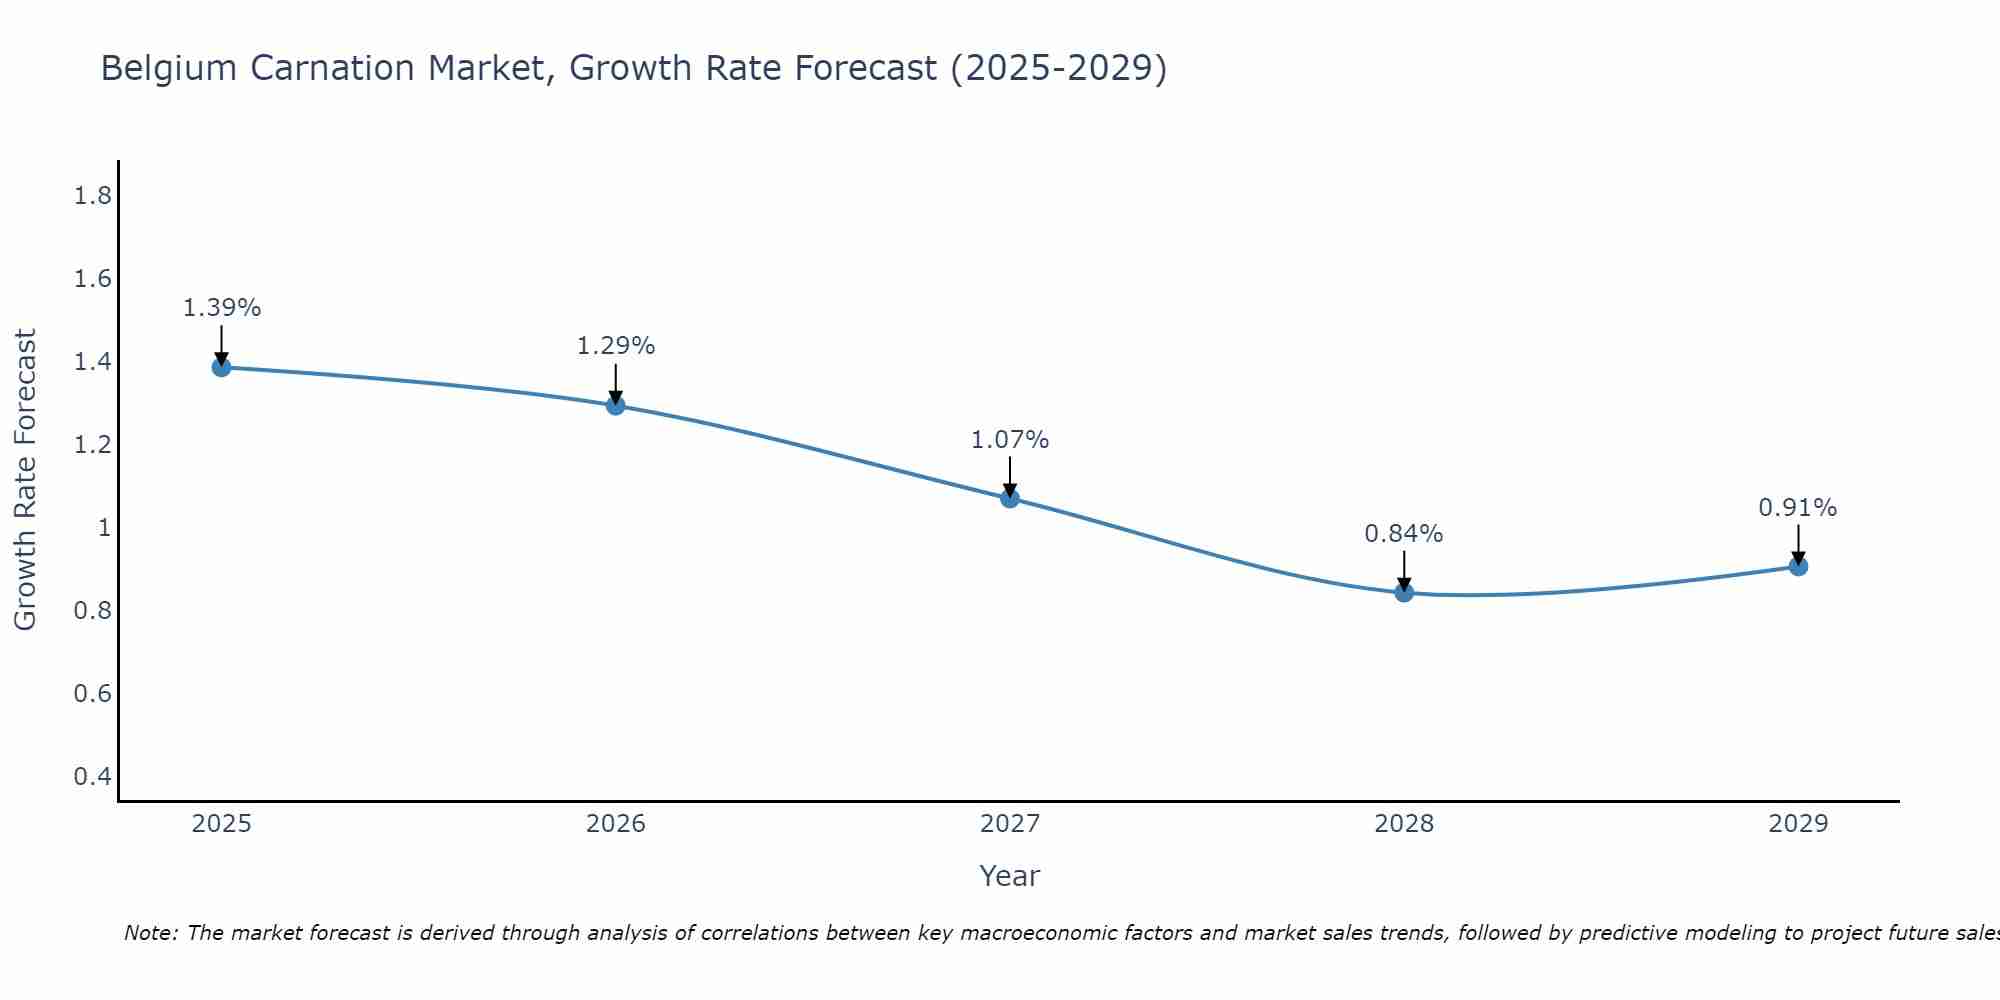
Belgium Carnation Market Size Growth Rate
The Belgium Carnation Market is projected to witness mixed growth rate patterns during 2025 to 2029. Although the growth rate starts strong at 1.39% in 2025, it steadily loses momentum, ending at 0.91% by 2029.
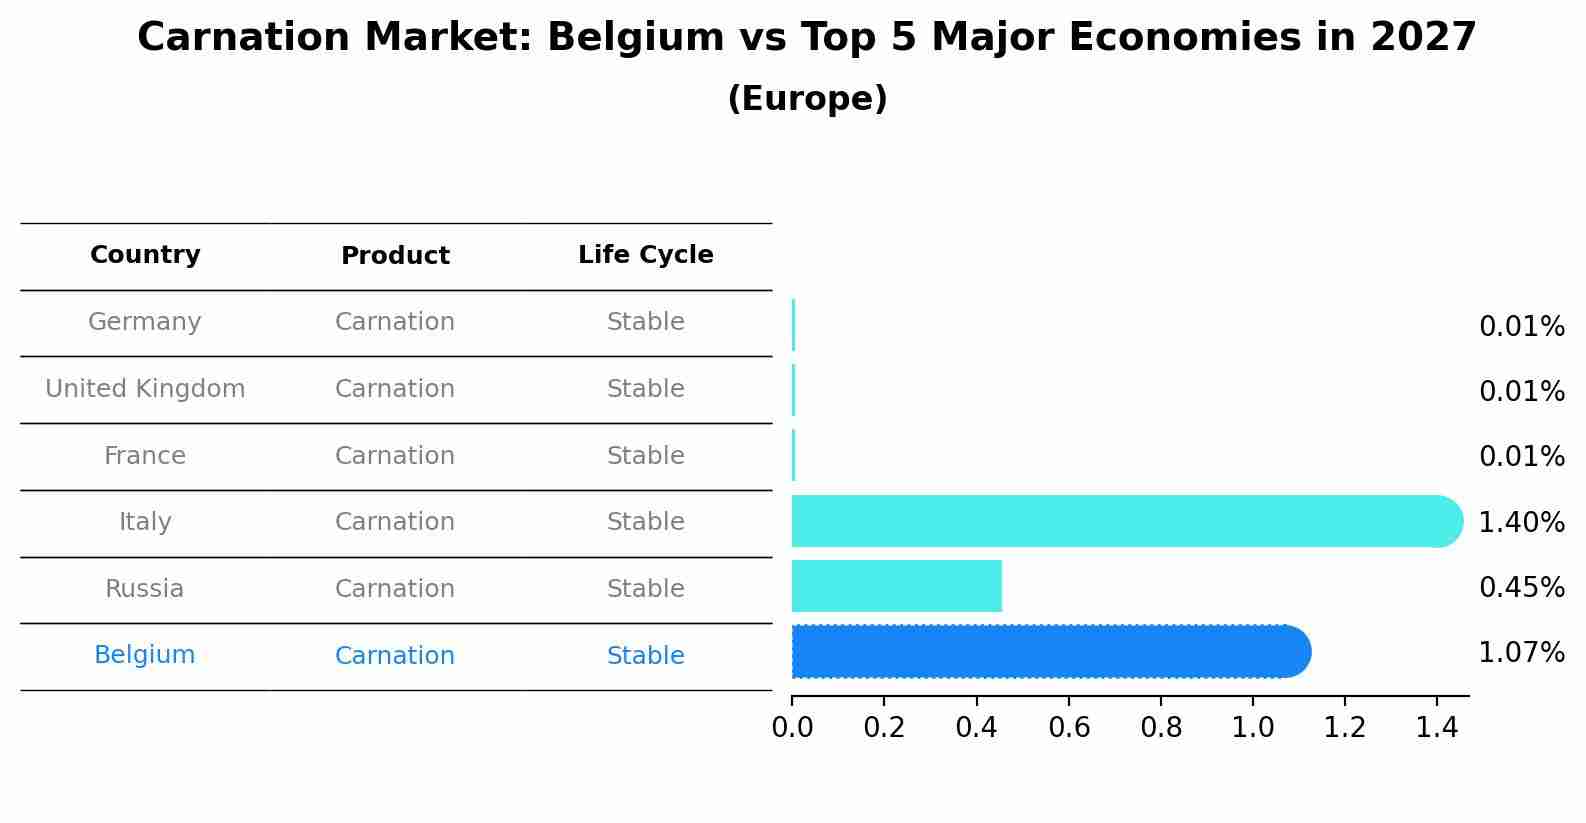
Carnation Market: Belgium vs Top 5 Major Economies in 2027 (Europe)
The Carnation market in Belgium is projected to grow at a stable growth rate of 1.07% by 2027, within the Europe region led by Germany, along with other countries like United Kingdom, France, Italy and Russia, collectively shaping a dynamic and evolving market environment driven by innovation and increasing adoption of emerging technologies.
Belgium Carnation Market Overview
The carnation market in Belgium is part of the broader floriculture industry, known for its high-quality flower production. Belgium`s favorable climate and advanced horticultural techniques support the cultivation of carnations. The market is driven by domestic demand for ornamental flowers and the growing trend of using flowers in events and decorations. Export opportunities also contribute to market growth, although competition from other flower-producing countries and fluctuating market prices present challenges.
Drivers of the market
The Belgium carnation market is driven by the flower`s popularity in various cultural and social events, such as weddings and celebrations. The demand for carnations is also supported by their long vase life and diverse color options, making them a preferred choice for floral arrangements and decorations. Advancements in horticulture techniques and greenhouse cultivation enable year-round production and supply of high-quality carnations. Moreover, the increasing trend of gifting flowers and the growth of the floriculture industry further fuel the market growth.
Challenges of the market
Challenges in the Belgium carnation market include competition from lower-cost producers in other countries, which can make it difficult for local growers to maintain market share. Additionally, the market is influenced by changing consumer preferences and trends, which can reduce demand for traditional flower varieties like carnations. Environmental factors such as climate change and pests can also impact production levels and quality. Furthermore, logistical issues, including the transportation and preservation of flowers, add to the overall costs and complexities of the market.
Government Policy of the market
In Belgium, the carnation market is supported by government policies that aim to boost the horticultural sector. The Flemish government offers subsidies and grants to flower growers to encourage innovation and sustainability in cultivation practices. Policies also emphasize the importance of adhering to phytosanitary standards to prevent the spread of pests and diseases. The government collaborates with industry associations to promote Belgian carnations both domestically and internationally, helping growers access new markets and improve their competitiveness. Additionally, research and development initiatives funded by the government focus on breeding new varieties and improving cultivation techniques to enhance the quality and yield of carnations.
Key Highlights of the Report:
- Belgium Carnation Market Outlook
- Market Size of Belgium Carnation Market, 2024
- Forecast of Belgium Carnation Market, 2031
- Historical Data and Forecast of Belgium Carnation Revenues & Volume for the Period 2021-2031
- Belgium Carnation Market Trend Evolution
- Belgium Carnation Market Drivers and Challenges
- Belgium Carnation Price Trends
- Belgium Carnation Porter`s Five Forces
- Belgium Carnation Industry Life Cycle
- Historical Data and Forecast of Belgium Carnation Market Revenues & Volume By Products Type for the Period 2021-2031
- Historical Data and Forecast of Belgium Carnation Market Revenues & Volume By Standard Carnation for the Period 2021-2031
- Historical Data and Forecast of Belgium Carnation Market Revenues & Volume By Miniature Carnation for the Period 2021-2031
- Historical Data and Forecast of Belgium Carnation Market Revenues & Volume By Application for the Period 2021-2031
- Historical Data and Forecast of Belgium Carnation Market Revenues & Volume By Domestic Field for the Period 2021-2031
- Historical Data and Forecast of Belgium Carnation Market Revenues & Volume By Business Field for the Period 2021-2031
- Belgium Carnation Import Export Trade Statistics
- Market Opportunity Assessment By Products Type
- Market Opportunity Assessment By Application
- Belgium Carnation Top Companies Market Share
- Belgium Carnation Competitive Benchmarking By Technical and Operational Parameters
- Belgium Carnation Company Profiles
- Belgium Carnation Key Strategic Recommendations
Frequently Asked Questions About the Market Study (FAQs):
6Wresearch actively monitors the Belgium Carnation Market and publishes its comprehensive annual report, highlighting emerging trends, growth drivers, revenue analysis, and forecast outlook. Our insights help businesses to make data-backed strategic decisions with ongoing market dynamics. Our analysts track relevent industries related to the Belgium Carnation Market, allowing our clients with actionable intelligence and reliable forecasts tailored to emerging regional needs.
Yes, we provide customisation as per your requirements. To learn more, feel free to contact us on sales@6wresearch.com
1 Executive Summary |
2 Introduction |
2.1 Key Highlights of the Report |
2.2 Report Description |
2.3 Market Scope & Segmentation |
2.4 Research Methodology |
2.5 Assumptions |
3 Belgium Carnation Market Overview |
3.1 Belgium Country Macro Economic Indicators |
3.2 Belgium Carnation Market Revenues & Volume, 2021 & 2031F |
3.3 Belgium Carnation Market - Industry Life Cycle |
3.4 Belgium Carnation Market - Porter's Five Forces |
3.5 Belgium Carnation Market Revenues & Volume Share, By Products Type, 2021 & 2031F |
3.6 Belgium Carnation Market Revenues & Volume Share, By Application, 2021 & 2031F |
4 Belgium Carnation Market Dynamics |
4.1 Impact Analysis |
4.2 Market Drivers |
4.2.1 Increasing demand for floral decorations and gifting purposes |
4.2.2 Growing trend towards sustainable and locally sourced products |
4.2.3 Rising popularity of floral arrangements in events and weddings |
4.3 Market Restraints |
4.3.1 Fluctuations in raw material prices (e.g., fertilizers, pesticides) |
4.3.2 Competition from imported carnations |
4.3.3 Seasonal factors affecting supply and pricing |
5 Belgium Carnation Market Trends |
6 Belgium Carnation Market Segmentations |
6.1 Belgium Carnation Market, By Products Type |
6.1.1 Overview and Analysis |
6.1.2 Belgium Carnation Market Revenues & Volume, By Standard Carnation, 2021-2031F |
6.1.3 Belgium Carnation Market Revenues & Volume, By Miniature Carnation, 2021-2031F |
6.2 Belgium Carnation Market, By Application |
6.2.1 Overview and Analysis |
6.2.2 Belgium Carnation Market Revenues & Volume, By Domestic Field, 2021-2031F |
6.2.3 Belgium Carnation Market Revenues & Volume, By Business Field, 2021-2031F |
7 Belgium Carnation Market Import-Export Trade Statistics |
7.1 Belgium Carnation Market Export to Major Countries |
7.2 Belgium Carnation Market Imports from Major Countries |
8 Belgium Carnation Market Key Performance Indicators |
8.1 Percentage of locally sourced carnations in the market |
8.2 Number of floral arrangement orders for events and weddings |
8.3 Customer satisfaction scores for the quality and freshness of carnations |
9 Belgium Carnation Market - Opportunity Assessment |
9.1 Belgium Carnation Market Opportunity Assessment, By Products Type, 2021 & 2031F |
9.2 Belgium Carnation Market Opportunity Assessment, By Application, 2021 & 2031F |
10 Belgium Carnation Market - Competitive Landscape |
10.1 Belgium Carnation Market Revenue Share, By Companies, 2024 |
10.2 Belgium Carnation Market Competitive Benchmarking, By Operating and Technical Parameters |
11 Company Profiles |
12 Recommendations | 13 Disclaimer |
Global Go To Market Strategy - 2030
Export potential enables firms to identify high-growth global markets with greater confidence by combining advanced trade intelligence with a structured quantitative methodology. The framework analyzes emerging demand trends and country-level import patterns while integrating macroeconomic and trade datasets such as GDP and population forecasts, bilateral import–export flows, tariff structures, elasticity differentials between developed and developing economies, geographic distance, and import demand projections. Using weighted trade values from 2020–2024 as the base period to project country-to-country export potential for 2030, these inputs are operationalized through calculated drivers such as gravity model parameters, tariff impact factors, and projected GDP per-capita growth. Through an analysis of hidden potentials, demand hotspots, and market conditions that are most favorable to success, this method enables firms to focus on target countries, maximize returns, and global expansion with data, backed by accuracy.
By factoring in the projected importer demand gap that is currently unmet and could be potential opportunity, it identifies the potential for the Exporter (Country) among 190 countries, against the general trade analysis, which identifies the biggest importer or exporter.
To discover high-growth global markets and optimize your business strategy:
Click Here
Pricing
- Single User License$ 1,995
- Department License$ 2,400
- Site License$ 3,120
- Global License$ 3,795

Leadership Perspectives from Industry Events
Search
Thought Leadership and Analyst Meet


Our Clients
6WResearch In News
- India Export Attractiveness Tracker 2026
- India Air Conditioner Market Set for Strong Rebound in 2026 After Weather-Led Correction and GST-Driven Recovery: 6Wresearch
- ADAS in India: How Automatic Emergency Braking, Blind Spot Detection & Driver Monitoring are Transforming Road Safety
- Doha a strategic location for EV manufacturing hub: IPA Qatar
- Demand for luxury TVs surging in the GCC, says Samsung
- Empowering Growth: The Thriving Journey of Bangladesh’s Cable Industry
Latest Reports
- Nicaragua RPG Gaming Market (2026-2032)
- New Zealand RPG Gaming Market (2026-2032)
- Netherlands RPG Gaming Market (2026-2032)
- Nauru RPG Gaming Market (2026-2032)
- Namibia RPG Gaming Market (2026-2032)
- Mozambique RPG Gaming Market (2026-2032)
- Montenegro RPG Gaming Market (2026-2032)
- Mongolia RPG Gaming Market (2026-2032)
- Monaco RPG Gaming Market (2026-2032)
- Micronesia RPG Gaming Market (2026-2032)
Industry Events and Analyst Meet

EV India Expo 2026

HIMTEX 2026

India Refining Summit 2026

India EV Show 2026

EV tech India Expo 2026
Whitepaper
- Middle East & Africa Commercial Security Market Click here to view more.
- Middle East & Africa Fire Safety Systems & Equipment Market Click here to view more.
- GCC Drone Market Click here to view more.
- Middle East Lighting Fixture Market Click here to view more.
- GCC Physical & Perimeter Security Market Click here to view more.