Belgium Conveyor Market (2026-2032) | Companies, Analysis, Value, Competitive Landscape, Forecast, Trends, Industry, Outlook, Growth, Share, Segmentation, Size & Revenue
Market Forecast By Product Type (Belt, Roller, Pallet, Overhead), By End-User Industry (Airport, Retail, Automotive, Manufacturing, Food and Beverage, Pharmaceuticals, Mining) And Competitive Landscape
| Product Code: ETC6351175 | Publication Date: Sep 2024 | Updated Date: Apr 2026 | Product Type: Market Research Report | |
| Publisher: 6Wresearch | Author: Sumit Sagar | No. of Pages: 75 | No. of Figures: 35 | No. of Tables: 20 |
Belgium Conveyor Market Size (2020-2030)
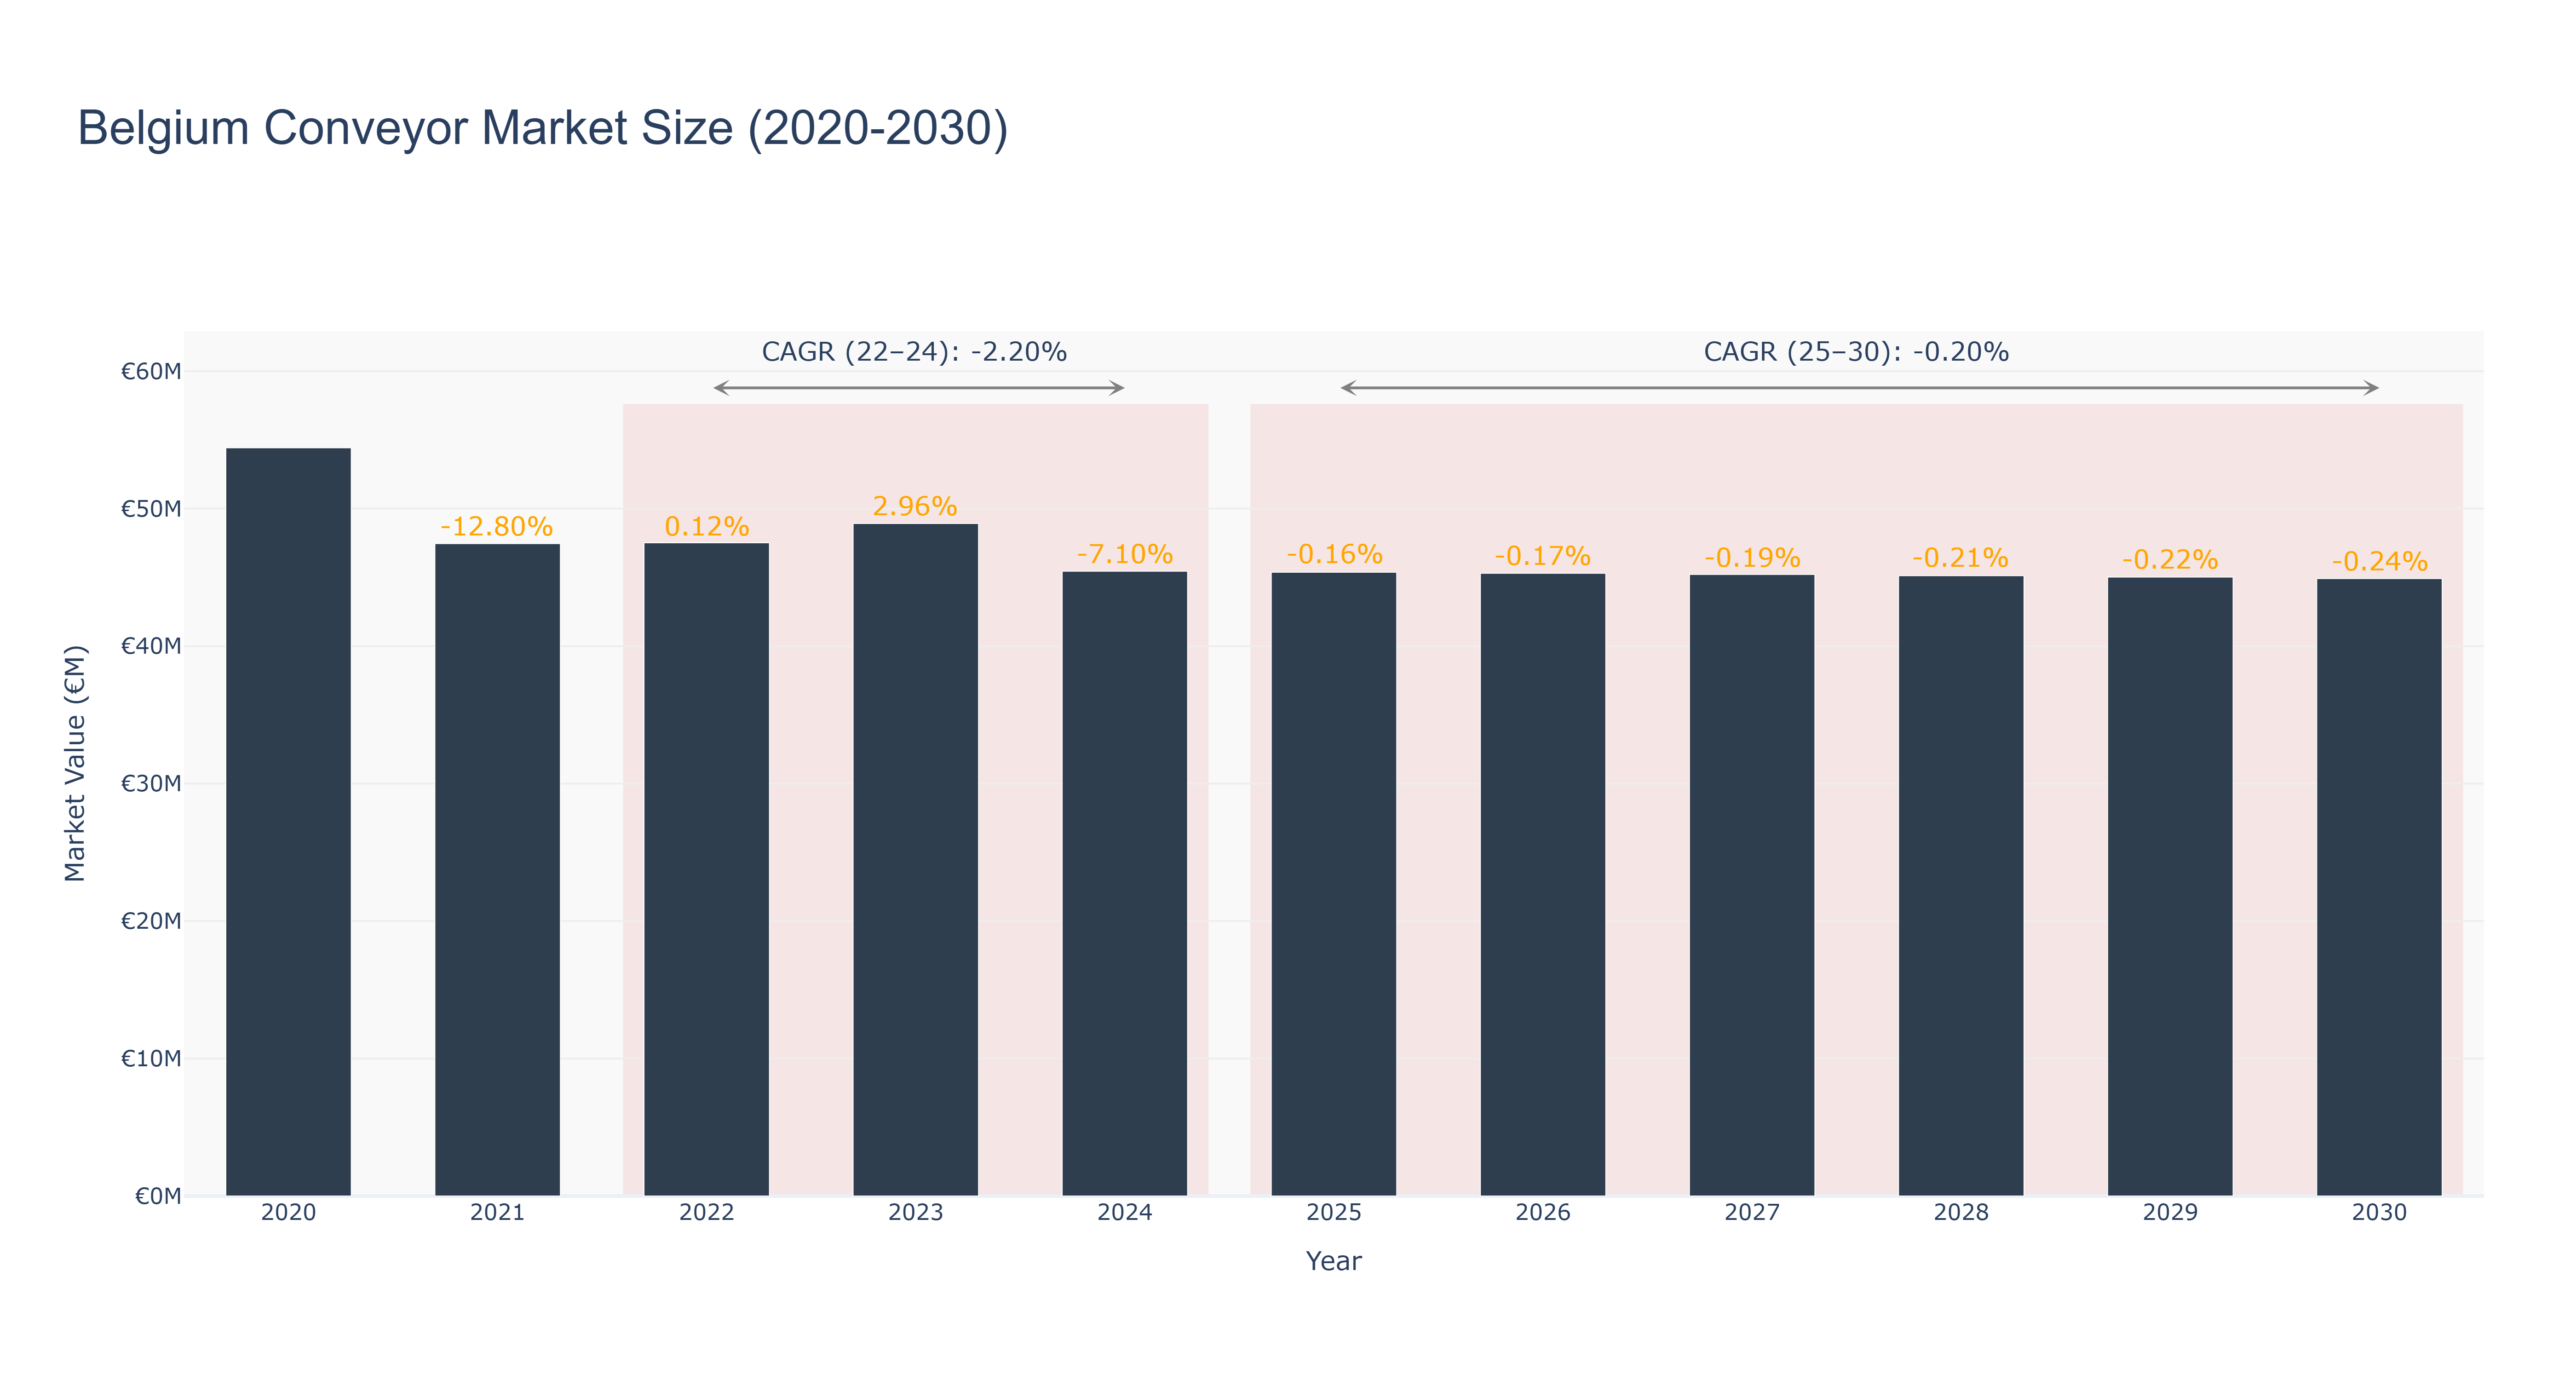
Belgium Conveyor Market has experienced a decline in market size from €54.43 million in 2020 to €45.02 million in 2029, with a negative CAGR of -0.22% from 2020 to 2030. The peak market size was recorded in 2023 at €48.93 million. The market is forecasted to continue its downward trend with a CAGR of -0.24% from 2025 to 2030. The drop in market size can be attributed to factors such as economic slowdown, technological disruptions, and changing consumer preferences. However, recent developments indicate a shift towards more sustainable and efficient conveyor systems in Belgium, with upcoming projects focusing on automation and energy efficiency to drive growth in the near future. Industry drivers include increasing demand for streamlined logistics and the adoption of Industry 4.0 technologies.
Belgium Conveyor Market: Production & Trade Performance (2019-2025)
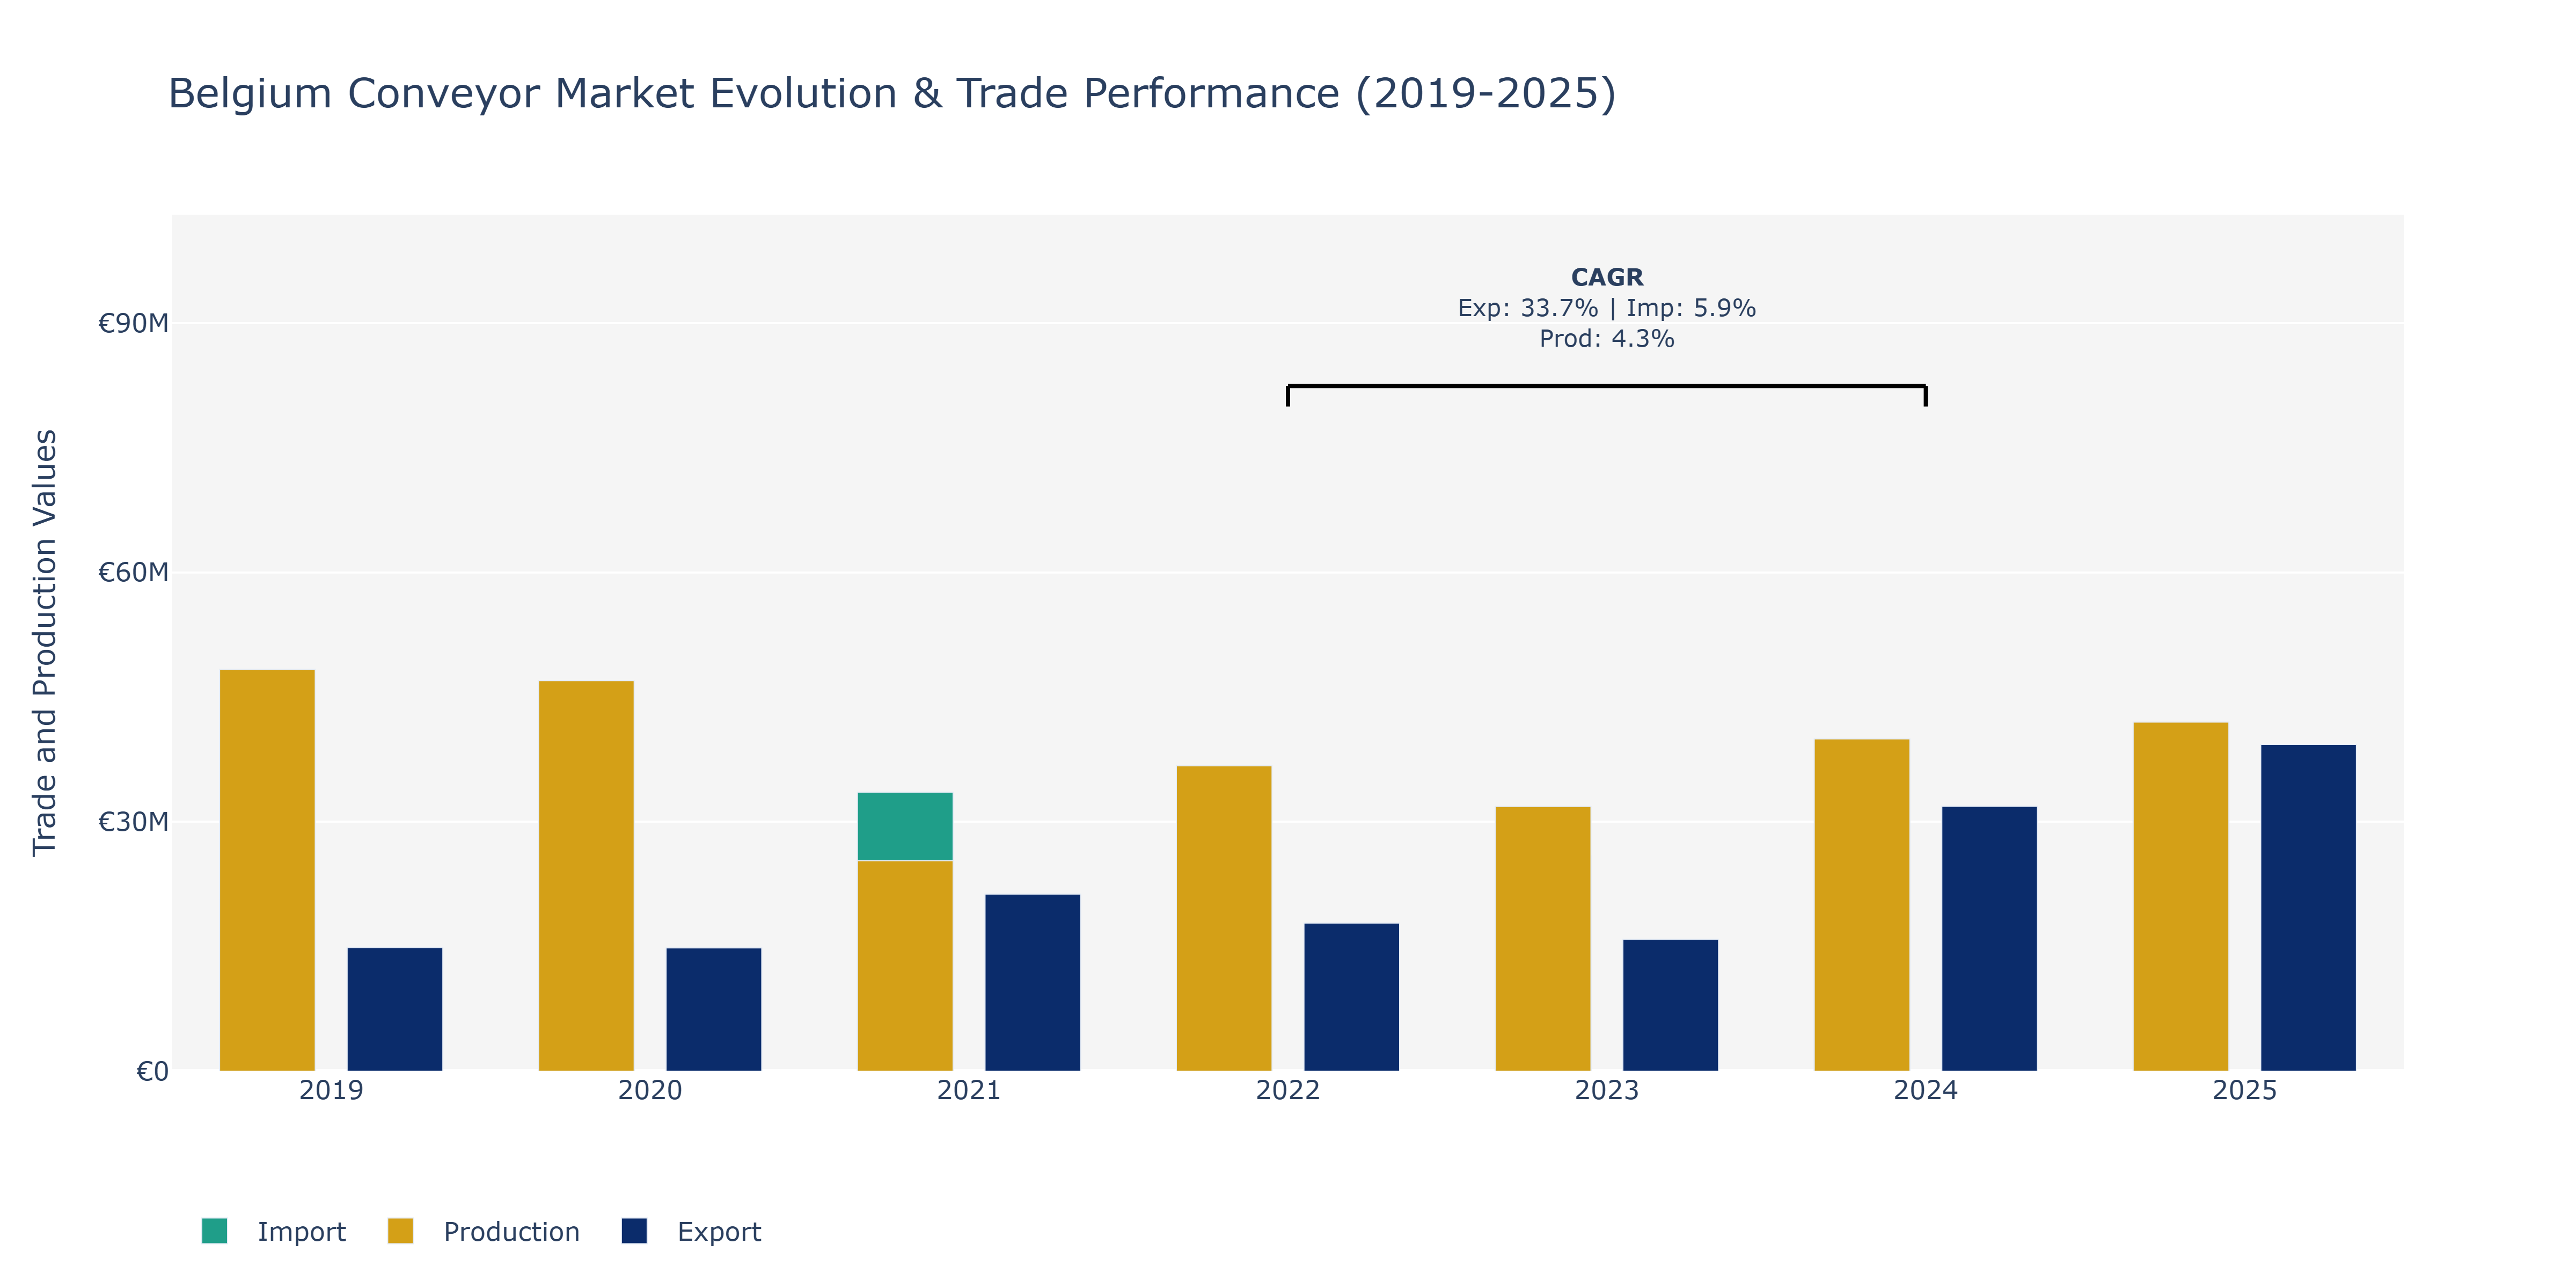
The Belgium Conveyor Market exhibited varied trends in exports, imports, and production from 2019 to 2025. In 2021, a notable surge was seen in exports, reaching €21.31 million, likely driven by increased global demand for Belgian conveyor technologies. However, this growth was not sustained, with exports declining in the following years. Imports, on the other hand, experienced consistent growth until 2025, where they reached €31.6 million, possibly indicating Belgium's reliance on foreign conveyor equipment to meet domestic needs. Production value fluctuated over the years, with a peak in 2020 at €46.99 million, followed by a decline and subsequent recovery. The 2022-2024 export CAGR of 33.71% highlights a period of significant expansion in overseas sales, possibly due to the successful penetration of new markets or the introduction of innovative conveyor solutions. The more modest import CAGR of 5.87% during the same period suggests steady growth in foreign acquisitions, reflecting Belgium's position as both a consumer and producer in the global conveyor market. Further analysis could benefit from exploring how changes in trade agreements or technological advancements influenced these market dynamics in Belgium.
Key Highlights of the Report:
- Belgium Conveyor Market Outlook
- Market Size of Belgium Conveyor Market, 2025
- Forecast of Belgium Conveyor Market, 2032
- Historical Data and Forecast of Belgium Conveyor Revenues & Volume for the Period 2022 - 2032
- Belgium Conveyor Market Trend Evolution
- Belgium Conveyor Market Drivers and Challenges
- Belgium Conveyor Price Trends
- Belgium Conveyor Porter's Five Forces
- Belgium Conveyor Industry Life Cycle
- Historical Data and Forecast of Belgium Conveyor Market Revenues & Volume By Product Type for the Period 2022 - 2032
- Historical Data and Forecast of Belgium Conveyor Market Revenues & Volume By Belt for the Period 2022 - 2032
- Historical Data and Forecast of Belgium Conveyor Market Revenues & Volume By Roller for the Period 2022 - 2032
- Historical Data and Forecast of Belgium Conveyor Market Revenues & Volume By Pallet for the Period 2022 - 2032
- Historical Data and Forecast of Belgium Conveyor Market Revenues & Volume By Overhead for the Period 2022 - 2032
- Historical Data and Forecast of Belgium Conveyor Market Revenues & Volume By End-User Industry for the Period 2022 - 2032
- Historical Data and Forecast of Belgium Conveyor Market Revenues & Volume By Airport for the Period 2022 - 2032
- Historical Data and Forecast of Belgium Conveyor Market Revenues & Volume By Retail for the Period 2022 - 2032
- Historical Data and Forecast of Belgium Conveyor Market Revenues & Volume By Automotive for the Period 2022 - 2032
- Historical Data and Forecast of Belgium Conveyor Market Revenues & Volume By Manufacturing for the Period 2022 - 2032
- Historical Data and Forecast of Belgium Conveyor Market Revenues & Volume By Food and Beverage for the Period 2022 - 2032
- Historical Data and Forecast of Belgium Conveyor Market Revenues & Volume By Pharmaceuticals for the Period 2022 - 2032
- Historical Data and Forecast of Belgium Conveyor Market Revenues & Volume By Mining for the Period 2022 - 2032
- Belgium Conveyor Import Export Trade Statistics
- Market Opportunity Assessment By Product Type
- Market Opportunity Assessment By End-User Industry
- Belgium Conveyor Top Companies Market Share
- Belgium Conveyor Competitive Benchmarking By Technical and Operational Parameters
- Belgium Conveyor Company Profiles
- Belgium Conveyor Key Strategic Recommendations
Frequently Asked Questions About the Market Study (FAQs):
6Wresearch actively monitors the Belgium Conveyor Market and publishes its comprehensive annual report, highlighting emerging trends, growth drivers, revenue analysis, and forecast outlook. Our insights help businesses to make data-backed strategic decisions with ongoing market dynamics. Our analysts track relevent industries related to the Belgium Conveyor Market, allowing our clients with actionable intelligence and reliable forecasts tailored to emerging regional needs.
Yes, we provide customisation as per your requirements. To learn more, feel free to contact us on sales@6wresearch.com
1 Executive Summary |
2 Introduction |
2.1 Key Highlights of the Report |
2.2 Report Description |
2.3 Market Scope & Segmentation |
2.4 Research Methodology |
2.5 Assumptions |
3 Belgium Conveyor Market Overview |
3.1 Belgium Country Macro Economic Indicators |
3.2 Belgium Conveyor Market Revenues & Volume, 2022 & 2032F |
3.3 Belgium Conveyor Market - Industry Life Cycle |
3.4 Belgium Conveyor Market - Porter's Five Forces |
3.5 Belgium Conveyor Market Revenues & Volume Share, By Product Type, 2022 & 2032F |
3.6 Belgium Conveyor Market Revenues & Volume Share, By End-User Industry, 2022 & 2032F |
4 Belgium Conveyor Market Dynamics |
4.1 Impact Analysis |
4.2 Market Drivers |
4.2.1 Increasing adoption of automation and Industry 4.0 practices in manufacturing and logistics sectors. |
4.2.2 Growing emphasis on efficiency and productivity in material handling processes. |
4.2.3 Rising demand for customized conveyor systems to meet specific industry requirements. |
4.3 Market Restraints |
4.3.1 High initial investment costs associated with installing conveyor systems. |
4.3.2 Maintenance and repair costs can be significant, impacting overall operational expenses. |
4.3.3 Limited availability of skilled technicians for installation and maintenance of conveyor systems. |
5 Belgium Conveyor Market Trends |
6 Belgium Conveyor Market, By Types |
6.1 Belgium Conveyor Market, By Product Type |
6.1.1 Overview and Analysis |
6.1.2 Belgium Conveyor Market Revenues & Volume, By Product Type, 2022 - 2032F |
6.1.3 Belgium Conveyor Market Revenues & Volume, By Belt, 2022 - 2032F |
6.1.4 Belgium Conveyor Market Revenues & Volume, By Roller, 2022 - 2032F |
6.1.5 Belgium Conveyor Market Revenues & Volume, By Pallet, 2022 - 2032F |
6.1.6 Belgium Conveyor Market Revenues & Volume, By Overhead, 2022 - 2032F |
6.2 Belgium Conveyor Market, By End-User Industry |
6.2.1 Overview and Analysis |
6.2.2 Belgium Conveyor Market Revenues & Volume, By Airport, 2022 - 2032F |
6.2.3 Belgium Conveyor Market Revenues & Volume, By Retail, 2022 - 2032F |
6.2.4 Belgium Conveyor Market Revenues & Volume, By Automotive, 2022 - 2032F |
6.2.5 Belgium Conveyor Market Revenues & Volume, By Manufacturing, 2022 - 2032F |
6.2.6 Belgium Conveyor Market Revenues & Volume, By Food and Beverage, 2022 - 2032F |
6.2.7 Belgium Conveyor Market Revenues & Volume, By Pharmaceuticals, 2022 - 2032F |
7 Belgium Conveyor Market Import-Export Trade Statistics |
7.1 Belgium Conveyor Market Export to Major Countries |
7.2 Belgium Conveyor Market Imports from Major Countries |
8 Belgium Conveyor Market Key Performance Indicators |
8.1 Average conveyor system uptime percentage. |
8.2 Rate of adoption of automated conveyor systems in different industries. |
8.3 Energy efficiency of conveyor systems measured by power consumption per unit of material transported. |
8.4 Percentage of conveyor system breakdowns leading to production downtime. |
8.5 Customer satisfaction index related to the performance and reliability of conveyor systems. |
9 Belgium Conveyor Market - Opportunity Assessment |
9.1 Belgium Conveyor Market Opportunity Assessment, By Product Type, 2022 & 2032F |
9.2 Belgium Conveyor Market Opportunity Assessment, By End-User Industry, 2022 & 2032F |
10 Belgium Conveyor Market - Competitive Landscape |
10.1 Belgium Conveyor Market Revenue Share, By Companies, 2025 |
10.2 Belgium Conveyor Market Competitive Benchmarking, By Operating and Technical Parameters |
11 Company Profiles |
12 Recommendations |
13 Disclaimer |
Export potential assessment - trade Analytics for 2030
Export potential enables firms to identify high-growth global markets with greater confidence by combining advanced trade intelligence with a structured quantitative methodology. The framework analyzes emerging demand trends and country-level import patterns while integrating macroeconomic and trade datasets such as GDP and population forecasts, bilateral import–export flows, tariff structures, elasticity differentials between developed and developing economies, geographic distance, and import demand projections. Using weighted trade values from 2020–2024 as the base period to project country-to-country export potential for 2030, these inputs are operationalized through calculated drivers such as gravity model parameters, tariff impact factors, and projected GDP per-capita growth. Through an analysis of hidden potentials, demand hotspots, and market conditions that are most favorable to success, this method enables firms to focus on target countries, maximize returns, and global expansion with data, backed by accuracy.
By factoring in the projected importer demand gap that is currently unmet and could be potential opportunity, it identifies the potential for the Exporter (Country) among 190 countries, against the general trade analysis, which identifies the biggest importer or exporter.
To discover high-growth global markets and optimize your business strategy:
Click Here
Pricing
- Single User License$ 1,995
- Department License$ 2,400
- Site License$ 3,120
- Global License$ 3,795

Search
Thought Leadership and Analyst Meet


Our Clients
Latest Reports
- Canada Cloud CFD Market (2026-2032) | Size & Revenue, Industry, Growth, Competitive Landscape, Forecast, Segmentation, Value, Outlook, Trends, Share, Analysis, Companies
- Taiwan Food Delivery Platform Market (2026-2032) | Companies, Outlook, Analysis, Trends, Value, Revenue, Segmentation, Share, Forecast, Competitive Landscape, Growth, Size & Forecast
- United Kingdom (UK) Long-term Care Insurance Market (2026-2032) | Growth, Share, Consumer Insights, Drivers, Opportunities, Competition, Pricing Analysis, Segments, Restraints, Companies, Competitive, Value, Outlook, Size, Demand, Analysis, Challenges, Strategic Insights, Investment Trends, Revenue, Trends, Supply, Forecast
- United Kingdom (UK) Long Term Care Market (2026-2032) | Companies, Outlook, Analysis, Trends, Value, Revenue, Segmentation, Share, Forecast, Competitive Landscape, Growth, Size & Forecast
- Iraq Insulation and Waterproofing Market (2026-2032) | Outlook, Drivers, Growth, Size, Share, Industry, Revenue, Trends, Demand, Competitive, Strategic Insights, Opportunities, Segments, Companies, Challenges, Strategy, Consumer Insights, Analysis, Investment Trends, Value, Segmentation, Forecast, Restraints
- India Switchgear Market Outlook (2026-2032) | Size, Share, Trends, Growth, Revenue, Forecast, Analysis, Value, Outlook
- Pakistan Contraceptive Implants Market (2025-2031) | Demand, Growth, Size, Share, Industry, Pricing Analysis, Competitive, Strategic Insights, Strategy, Consumer Insights, Analysis, Investment Trends, Opportunities, Revenue, Segments, Value, Segmentation, Supply, Forecast, Restraints, Outlook, Competition, Drivers, Trends, Companies, Challenges
- Sri Lanka Packaging Market (2026-2032) | Outlook, Competition, Drivers, Trends, Demand, Pricing Analysis, Competitive, Strategic Insights, Companies, Challenges, Strategy, Consumer Insights, Analysis, Investment Trends, Opportunities, Growth, Size, Share, Industry, Revenue, Segments, Value, Segmentation, Supply, Forecast, Restraints
- India Kids Watches Market (2026-2032) | Strategy, Consumer Insights, Analysis, Investment Trends, Opportunities, Growth, Size, Share, Industry, Revenue, Segments, Value, Segmentation, Supply, Forecast, Restraints, Outlook, Competition, Drivers, Trends, Demand, Pricing Analysis, Competitive, Strategic Insights, Companies, Challenges
- Saudi Arabia Core Assurance Service Market (2025-2031) | Strategy, Consumer Insights, Analysis, Investment Trends, Opportunities, Growth, Size, Share, Industry, Revenue, Segments, Value, Segmentation, Supply, Forecast, Restraints, Outlook, Competition, Drivers, Trends, Demand, Pricing Analysis, Competitive, Strategic Insights, Companies, Challenges
Industry Events and Analyst Meet

India EV Show 2026

EV tech India Expo 2026

Auto Tech Asia 2026

Battery Tech India 2026

Smart Production Solutions Guangzhou 2026
Whitepaper
- Middle East & Africa Commercial Security Market Click here to view more.
- Middle East & Africa Fire Safety Systems & Equipment Market Click here to view more.
- GCC Drone Market Click here to view more.
- Middle East Lighting Fixture Market Click here to view more.
- GCC Physical & Perimeter Security Market Click here to view more.
6WResearch In News
- Doha a strategic location for EV manufacturing hub: IPA Qatar
- Demand for luxury TVs surging in the GCC, says Samsung
- Empowering Growth: The Thriving Journey of Bangladesh’s Cable Industry
- Demand for luxury TVs surging in the GCC, says Samsung
- Video call with a traditional healer? Once unthinkable, it’s now common in South Africa
- Intelligent Buildings To Smooth GCC’s Path To Net Zero