Belgium Dyes Market (2026-2032) | Analysis, Forecast, Growth, Industry, Share, Competitive Landscape, Value, Trends, Companies, Size & Revenue, Segmentation, Outlook
Market Forecast By Product Type (Reactive Dyes, Disperse Dyes, Vat Dyes, Direct Dyes, Acid Dyes, Other Dyes), By Application (Textile, Leather, Paper, Printing Inks, Other) And Competitive Landscape
| Product Code: ETC6352490 | Publication Date: Sep 2024 | Updated Date: Apr 2026 | Product Type: Market Research Report | |
| Publisher: 6Wresearch | Author: Vasudha | No. of Pages: 75 | No. of Figures: 35 | No. of Tables: 20 |
Belgium Dyes Market Size (2020-2030)
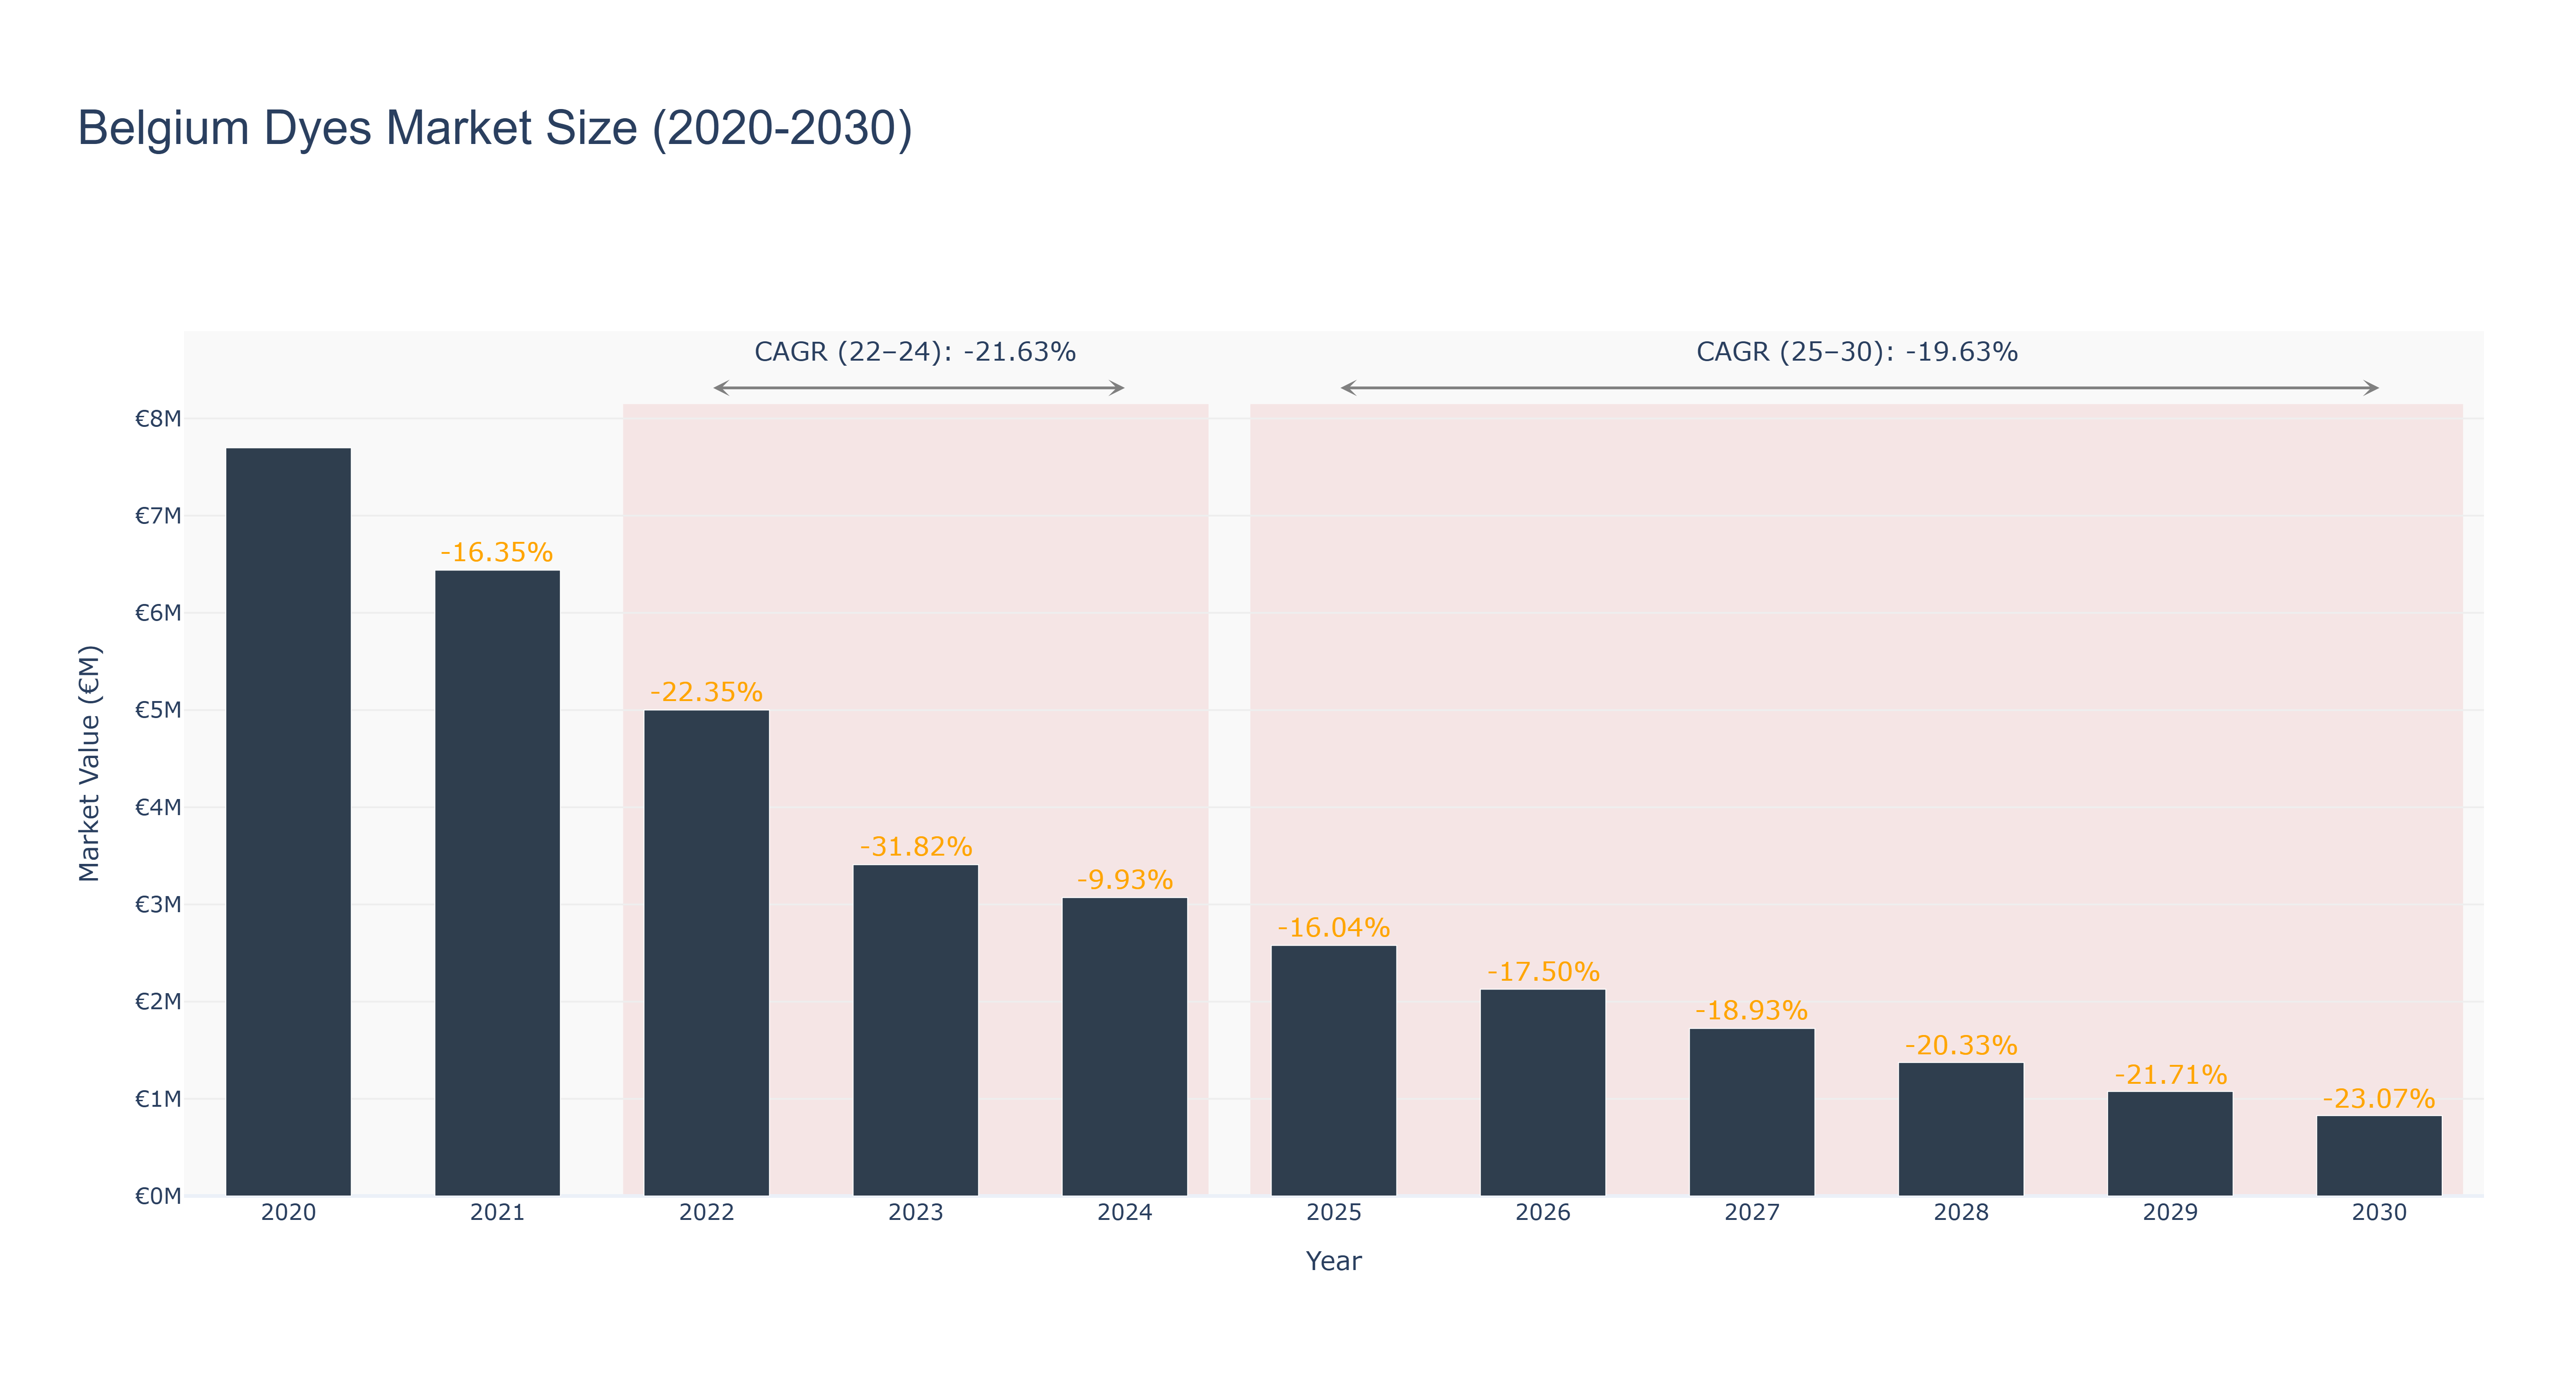
The Belgium Dyes Market experienced its peak in 2020 with a market size of €7.70 million, followed by a significant decline over the next four years, culminating in an actual market size of €3.07 million in 2024, reflecting a compound annual growth rate (CAGR) of -21.63% during the period from 2022 to 2024. This decline can be attributed to various factors, including a shift towards sustainable and eco-friendly alternatives, stringent regulatory measures, and decreased demand from key industries such as textiles and automotive. Looking ahead, the forecasted period from 2025 to 2030 anticipates further contraction, with projected market values decreasing to €827.45 thousand by 2030, resulting in a CAGR of -19.63%. Future developments in the market may hinge on technological advancements in dye production and the increased adoption of biobased dyes, but overall, the industry faces significant challenges amid ongoing market transformation.
Belgium Dyes Market: Production & Trade Performance (2019-2025)
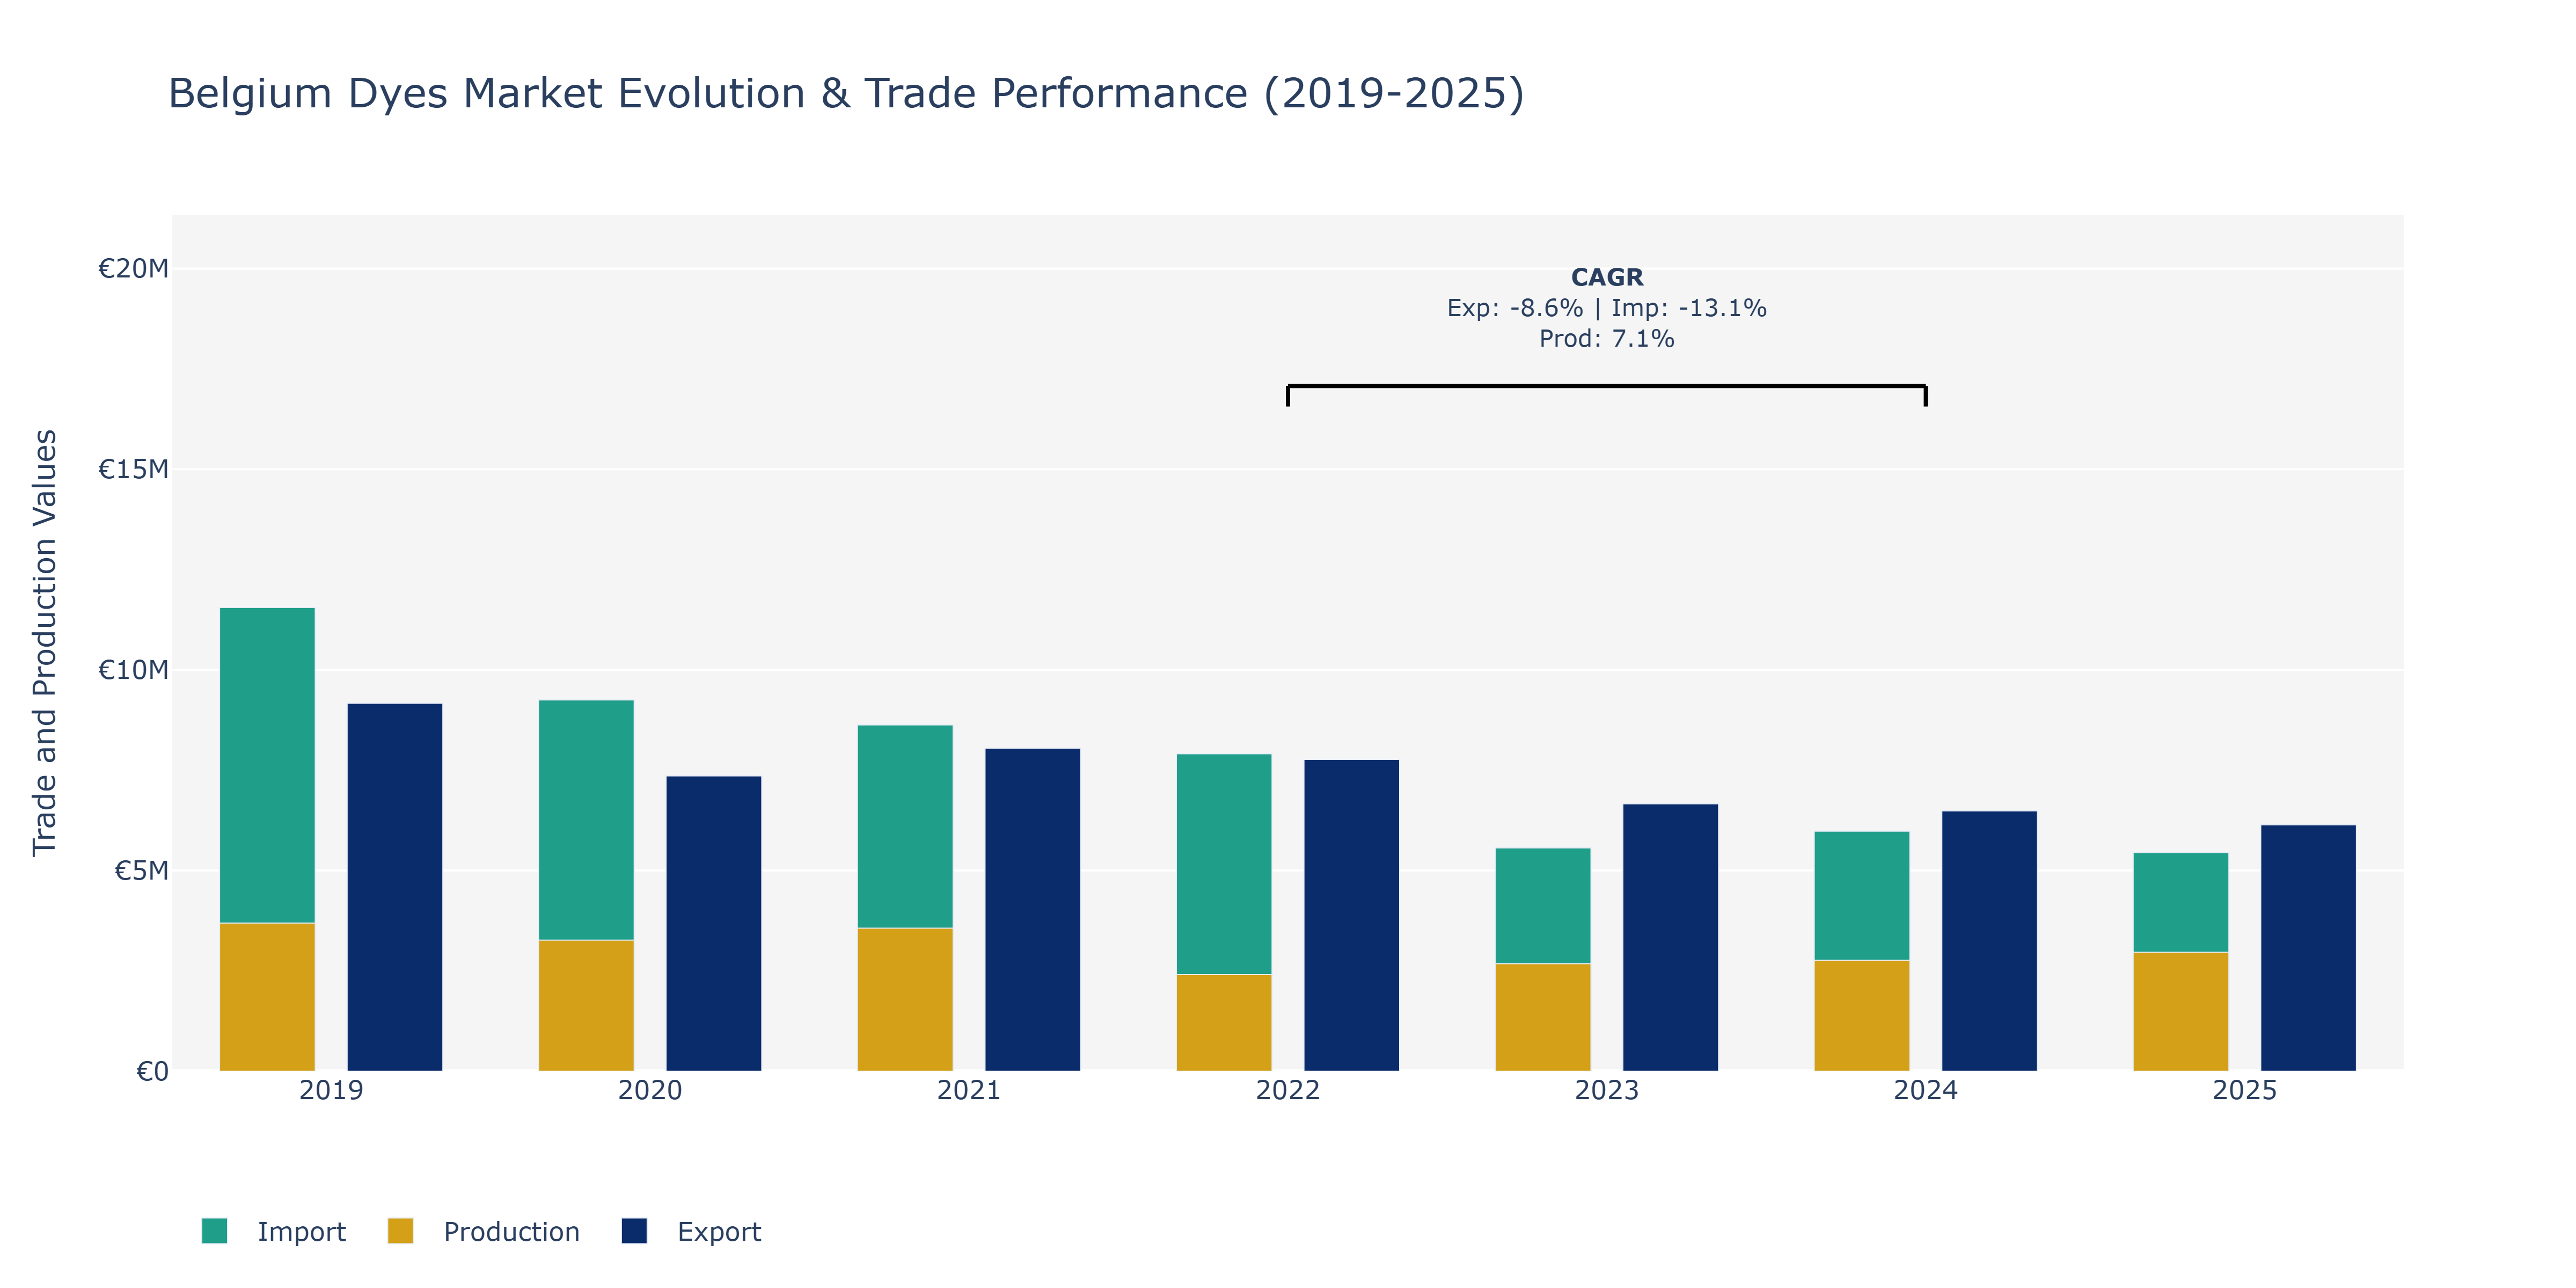
In the Belgium Dyes Market, from 2019 to 2025, Exports saw a gradual decline from €9.17 million to €6.14 million, with the steepest drop observed between 2022 and 2023. Imports followed a similar downward trend, decreasing from €11.55 million in 2019 to €5.45 million in 2025. Production value fluctuated, reaching a peak of €3.69 billion in 2019, then declining to €2.41 billion in 2022 before rebounding to €2.96 billion in 2025. The decline in Exports and Imports can be attributed to global economic fluctuations impacting trade volumes, while the rise in Production could be due to technological advancements improving efficiency in the manufacturing process. The market may have also experienced shifts in demand for sustainable and eco-friendly dyes, influencing production levels. These trends align with the evolving consumer preferences for environmentally friendly products in the textile industry, prompting manufacturers to adjust their output accordingly.
Key Highlights of the Report:
- Belgium Dyes Market Outlook
- Market Size of Belgium Dyes Market, 2025
- Forecast of Belgium Dyes Market, 2032
- Historical Data and Forecast of Belgium Dyes Revenues & Volume for the Period 2022 - 2032
- Belgium Dyes Market Trend Evolution
- Belgium Dyes Market Drivers and Challenges
- Belgium Dyes Price Trends
- Belgium Dyes Porter's Five Forces
- Belgium Dyes Industry Life Cycle
- Historical Data and Forecast of Belgium Dyes Market Revenues & Volume By Product Type for the Period 2022 - 2032
- Historical Data and Forecast of Belgium Dyes Market Revenues & Volume By Reactive Dyes for the Period 2022 - 2032
- Historical Data and Forecast of Belgium Dyes Market Revenues & Volume By Disperse Dyes for the Period 2022 - 2032
- Historical Data and Forecast of Belgium Dyes Market Revenues & Volume By Vat Dyes for the Period 2022 - 2032
- Historical Data and Forecast of Belgium Dyes Market Revenues & Volume By Direct Dyes for the Period 2022 - 2032
- Historical Data and Forecast of Belgium Dyes Market Revenues & Volume By Acid Dyes for the Period 2022 - 2032
- Historical Data and Forecast of Belgium Dyes Market Revenues & Volume By Other Dyes for the Period 2022 - 2032
- Historical Data and Forecast of Belgium Dyes Market Revenues & Volume By Application for the Period 2022 - 2032
- Historical Data and Forecast of Belgium Dyes Market Revenues & Volume By Textile for the Period 2022 - 2032
- Historical Data and Forecast of Belgium Dyes Market Revenues & Volume By Leather for the Period 2022 - 2032
- Historical Data and Forecast of Belgium Dyes Market Revenues & Volume By Paper for the Period 2022 - 2032
- Historical Data and Forecast of Belgium Dyes Market Revenues & Volume By Printing Inks for the Period 2022 - 2032
- Historical Data and Forecast of Belgium Dyes Market Revenues & Volume By Other for the Period 2022 - 2032
- Belgium Dyes Import Export Trade Statistics
- Market Opportunity Assessment By Product Type
- Market Opportunity Assessment By Application
- Belgium Dyes Top Companies Market Share
- Belgium Dyes Competitive Benchmarking By Technical and Operational Parameters
- Belgium Dyes Company Profiles
- Belgium Dyes Key Strategic Recommendations
Frequently Asked Questions About the Market Study (FAQs):
6Wresearch actively monitors the Belgium Dyes Market and publishes its comprehensive annual report, highlighting emerging trends, growth drivers, revenue analysis, and forecast outlook. Our insights help businesses to make data-backed strategic decisions with ongoing market dynamics. Our analysts track relevent industries related to the Belgium Dyes Market, allowing our clients with actionable intelligence and reliable forecasts tailored to emerging regional needs.
Yes, we provide customisation as per your requirements. To learn more, feel free to contact us on sales@6wresearch.com
1 Executive Summary |
2 Introduction |
2.1 Key Highlights of the Report |
2.2 Report Description |
2.3 Market Scope & Segmentation |
2.4 Research Methodology |
2.5 Assumptions |
3 Belgium Dyes Market Overview |
3.1 Belgium Country Macro Economic Indicators |
3.2 Belgium Dyes Market Revenues & Volume, 2022 & 2032F |
3.3 Belgium Dyes Market - Industry Life Cycle |
3.4 Belgium Dyes Market - Porter's Five Forces |
3.5 Belgium Dyes Market Revenues & Volume Share, By Product Type, 2022 & 2032F |
3.6 Belgium Dyes Market Revenues & Volume Share, By Application, 2022 & 2032F |
4 Belgium Dyes Market Dynamics |
4.1 Impact Analysis |
4.2 Market Drivers |
4.2.1 Growth in the textile industry in Belgium |
4.2.2 Increasing demand for eco-friendly and sustainable dyes |
4.2.3 Innovation in dye technologies |
4.3 Market Restraints |
4.3.1 Stringent environmental regulations |
4.3.2 Fluctuating raw material prices |
4.3.3 Competition from substitute products |
5 Belgium Dyes Market Trends |
6 Belgium Dyes Market, By Types |
6.1 Belgium Dyes Market, By Product Type |
6.1.1 Overview and Analysis |
6.1.2 Belgium Dyes Market Revenues & Volume, By Product Type, 2022 - 2032F |
6.1.3 Belgium Dyes Market Revenues & Volume, By Reactive Dyes, 2022 - 2032F |
6.1.4 Belgium Dyes Market Revenues & Volume, By Disperse Dyes, 2022 - 2032F |
6.1.5 Belgium Dyes Market Revenues & Volume, By Vat Dyes, 2022 - 2032F |
6.1.6 Belgium Dyes Market Revenues & Volume, By Direct Dyes, 2022 - 2032F |
6.1.7 Belgium Dyes Market Revenues & Volume, By Acid Dyes, 2022 - 2032F |
6.1.8 Belgium Dyes Market Revenues & Volume, By Other Dyes, 2022 - 2032F |
6.2 Belgium Dyes Market, By Application |
6.2.1 Overview and Analysis |
6.2.2 Belgium Dyes Market Revenues & Volume, By Textile, 2022 - 2032F |
6.2.3 Belgium Dyes Market Revenues & Volume, By Leather, 2022 - 2032F |
6.2.4 Belgium Dyes Market Revenues & Volume, By Paper, 2022 - 2032F |
6.2.5 Belgium Dyes Market Revenues & Volume, By Printing Inks, 2022 - 2032F |
6.2.6 Belgium Dyes Market Revenues & Volume, By Other, 2022 - 2032F |
7 Belgium Dyes Market Import-Export Trade Statistics |
7.1 Belgium Dyes Market Export to Major Countries |
7.2 Belgium Dyes Market Imports from Major Countries |
8 Belgium Dyes Market Key Performance Indicators |
8.1 Percentage of sales from eco-friendly dyes |
8.2 Research and development investment in new dye technologies |
8.3 Number of partnerships or collaborations for sustainable practices in the dye industry |
9 Belgium Dyes Market - Opportunity Assessment |
9.1 Belgium Dyes Market Opportunity Assessment, By Product Type, 2022 & 2032F |
9.2 Belgium Dyes Market Opportunity Assessment, By Application, 2022 & 2032F |
10 Belgium Dyes Market - Competitive Landscape |
10.1 Belgium Dyes Market Revenue Share, By Companies, 2025 |
10.2 Belgium Dyes Market Competitive Benchmarking, By Operating and Technical Parameters |
11 Company Profiles |
12 Recommendations |
13 Disclaimer |
Global Go To Market Strategy - 2030
Export potential enables firms to identify high-growth global markets with greater confidence by combining advanced trade intelligence with a structured quantitative methodology. The framework analyzes emerging demand trends and country-level import patterns while integrating macroeconomic and trade datasets such as GDP and population forecasts, bilateral import–export flows, tariff structures, elasticity differentials between developed and developing economies, geographic distance, and import demand projections. Using weighted trade values from 2020–2024 as the base period to project country-to-country export potential for 2030, these inputs are operationalized through calculated drivers such as gravity model parameters, tariff impact factors, and projected GDP per-capita growth. Through an analysis of hidden potentials, demand hotspots, and market conditions that are most favorable to success, this method enables firms to focus on target countries, maximize returns, and global expansion with data, backed by accuracy.
By factoring in the projected importer demand gap that is currently unmet and could be potential opportunity, it identifies the potential for the Exporter (Country) among 190 countries, against the general trade analysis, which identifies the biggest importer or exporter.
To discover high-growth global markets and optimize your business strategy:
Click Here
Pricing
- Single User License$ 1,995
- Department License$ 2,400
- Site License$ 3,120
- Global License$ 3,795

Leadership Perspectives from Industry Events
Search
Thought Leadership and Analyst Meet


Our Clients
6WResearch In News
- Doha a strategic location for EV manufacturing hub: IPA Qatar
- Demand for luxury TVs surging in the GCC, says Samsung
- Empowering Growth: The Thriving Journey of Bangladesh’s Cable Industry
- Demand for luxury TVs surging in the GCC, says Samsung
- Video call with a traditional healer? Once unthinkable, it’s now common in South Africa
- Intelligent Buildings To Smooth GCC’s Path To Net Zero
Latest Reports
- Cape Verde Portable Hand-Thrown Extinguisher Market (2026-2032)
- Canada Portable Hand-Thrown Extinguisher Market (2026-2032)
- Cameroon Portable Hand-Thrown Extinguisher Market (2026-2032)
- Burundi Portable Hand-Thrown Extinguisher Market (2026-2032)
- Burkina Faso Portable Hand-Thrown Extinguisher Market (2026-2032)
- Bulgaria Portable Hand-Thrown Extinguisher Market (2026-2032)
- Brunei Portable Hand-Thrown Extinguisher Market (2026-2032)
- Botswana Portable Hand-Thrown Extinguisher Market (2026-2032)
- Bosnia and Herzegovina Portable Hand-Thrown Extinguisher Market (2026-2032)
- Bolivia Portable Hand-Thrown Extinguisher Market (2026-2032)
Industry Events and Analyst Meet

HIMTEX 2026

India Refining Summit 2026

India EV Show 2026

EV tech India Expo 2026

Auto Tech Asia 2026
Whitepaper
- Middle East & Africa Commercial Security Market Click here to view more.
- Middle East & Africa Fire Safety Systems & Equipment Market Click here to view more.
- GCC Drone Market Click here to view more.
- Middle East Lighting Fixture Market Click here to view more.
- GCC Physical & Perimeter Security Market Click here to view more.