Belgium Green Silica Market (2026-2032) | Analysis, Forecast, Companies, Trends, Outlook, Share, Competitive Landscape, Size & Revenue, Value, Industry, Segmentation, Growth
Market Forecast By Form (Powder, Granular, Micropearl), By Source (Rice Husk Ash, Sugarcane Bagasse Ash, Bamboo Leaf, Corncob, Others (including Bamboo Culm and Banana Peel)), By Type (Highly Dispersible Silica (HDS), Easily Dispersible Silica (EDS)), By Application (Consumer Goods, Industrial Rubber, Footwear, Food Products, Paints, Coatings, and Inks, Plastic Films, Others (including Oral Care Products)), By End-use (Automotive, Paints & Coatings, Plastic & Packaging, Personal Care, Industrial, Food & Beverages, Others (including Construction and Cosmetics)) And Competitive Landscape
| Product Code: ETC6354969 | Publication Date: Sep 2024 | Updated Date: Apr 2026 | Product Type: Market Research Report | |
| Publisher: 6Wresearch | Author: Shubham Padhi | No. of Pages: 75 | No. of Figures: 35 | No. of Tables: 20 |
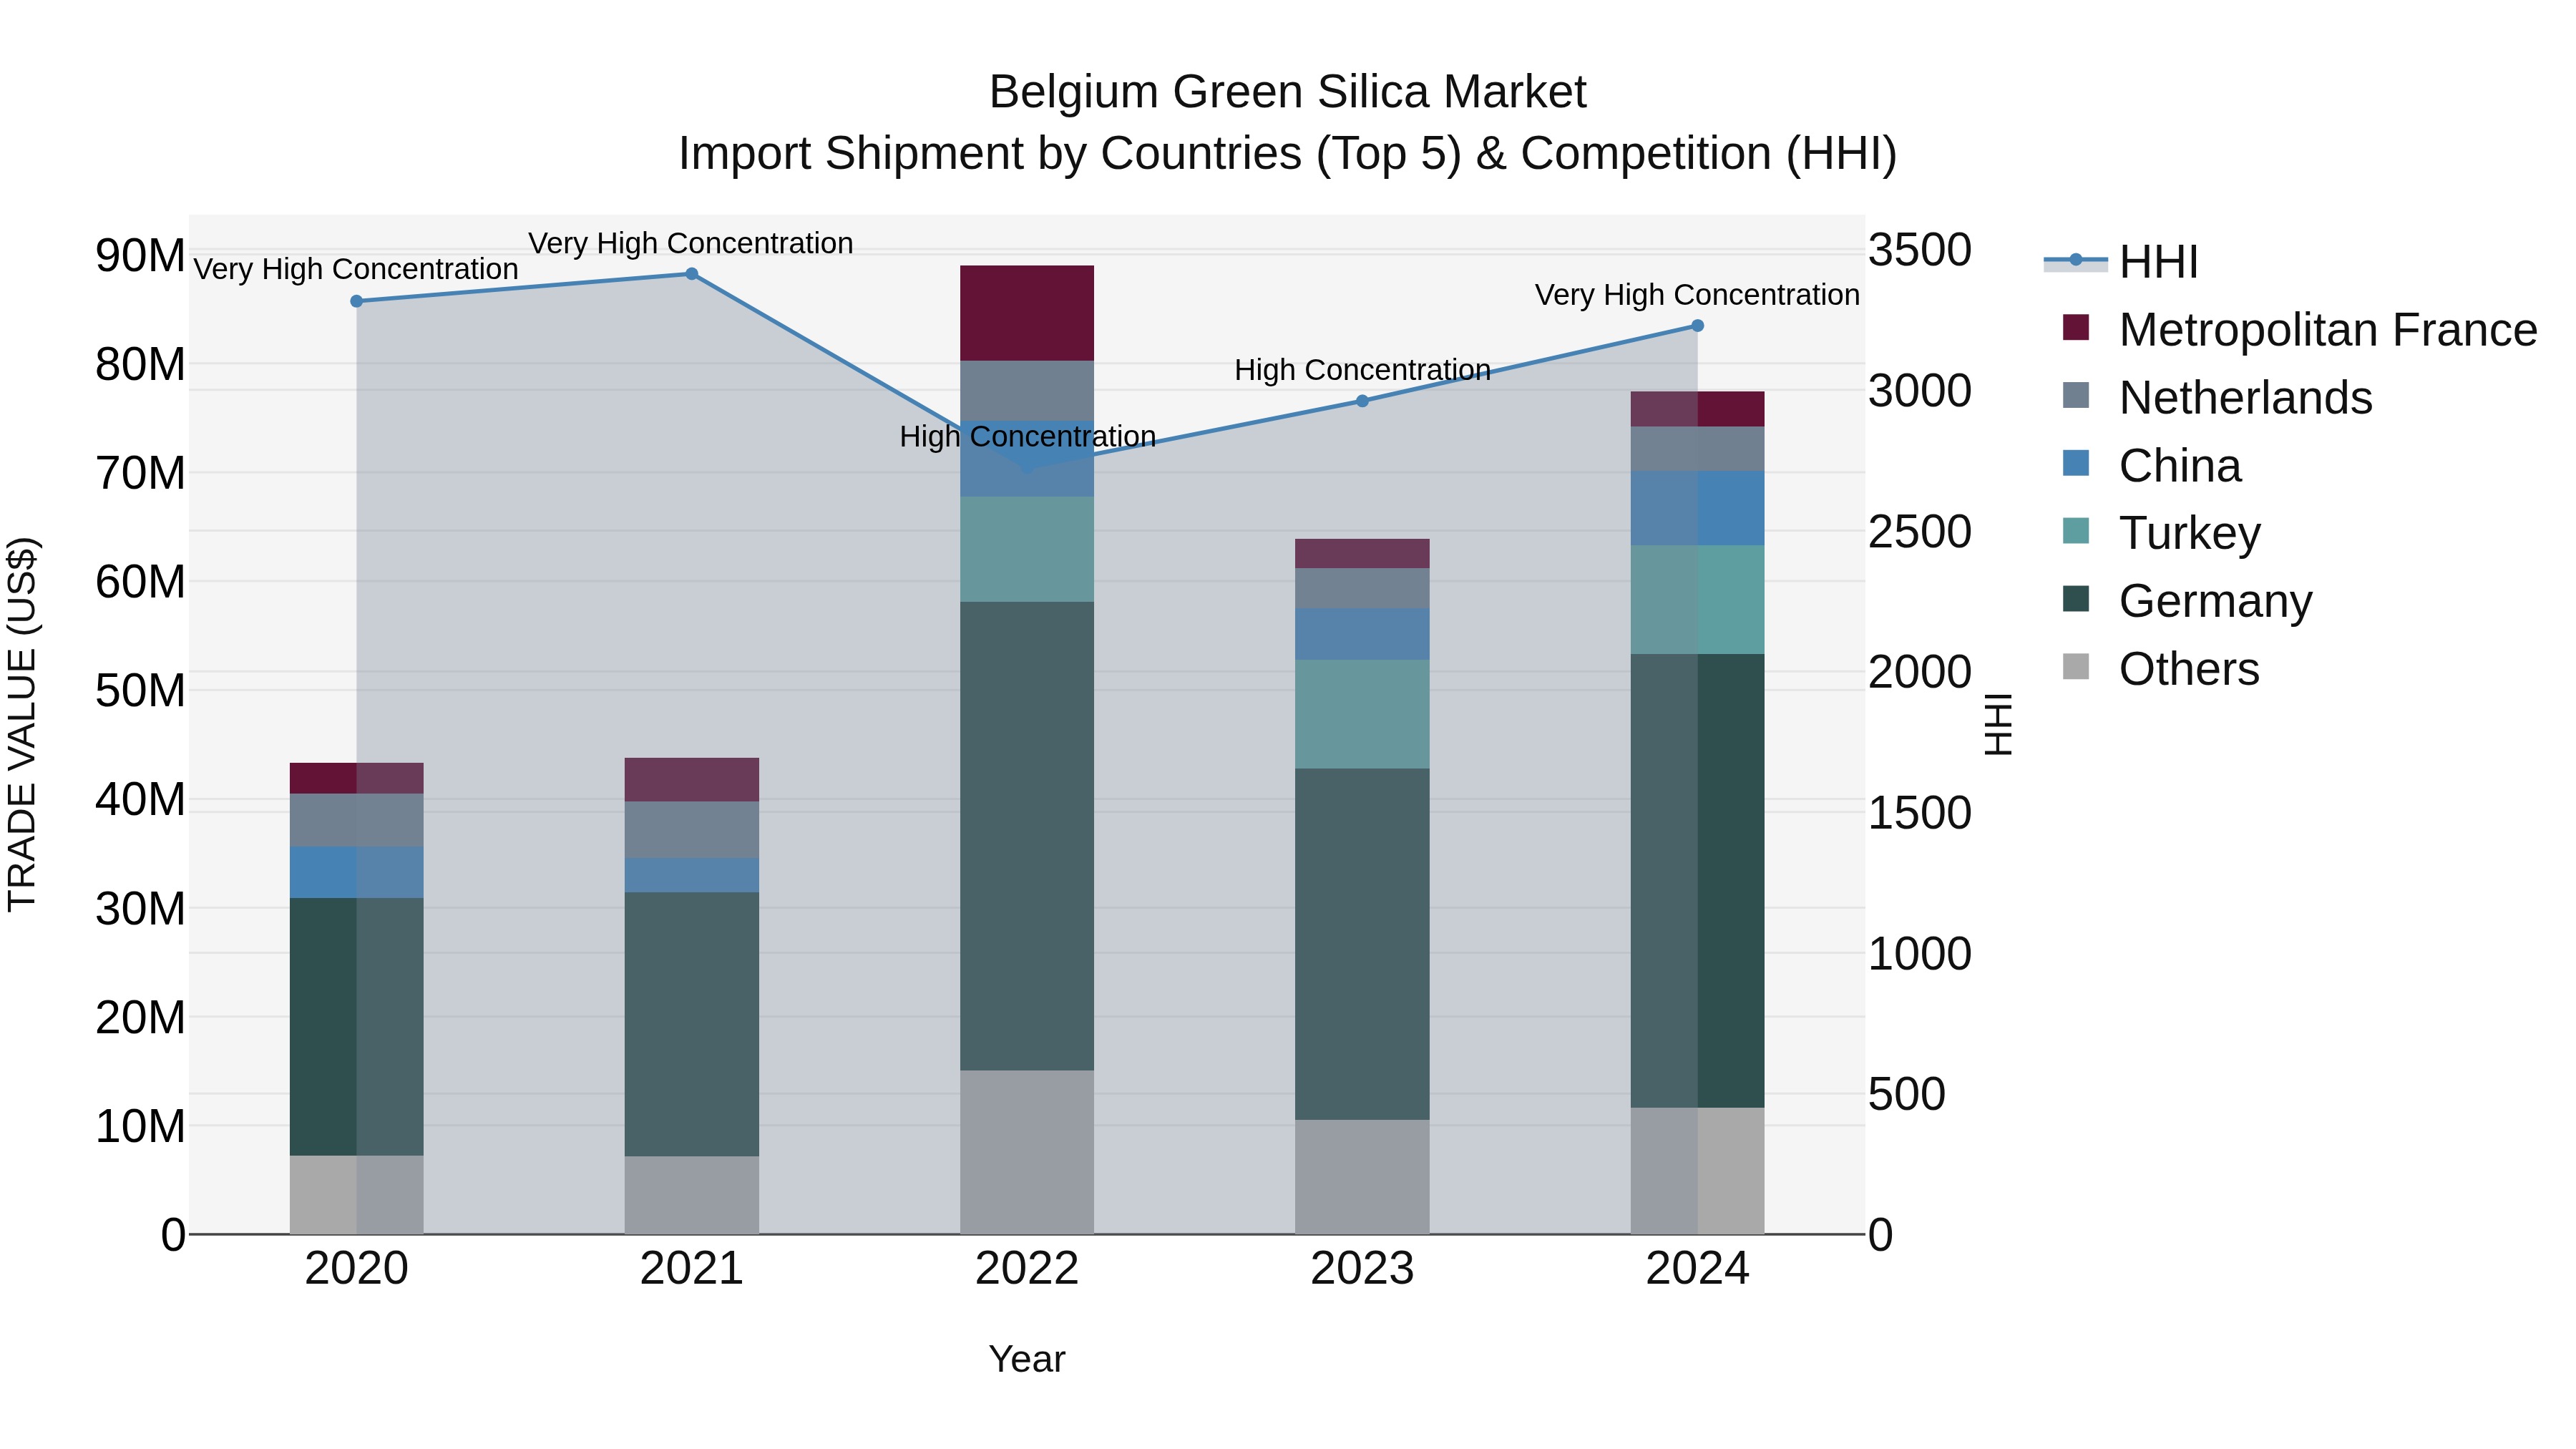
Belgium Green Silica Market Top 5 Importing Countries and Market Competition (HHI) Analysis
Belgium`s green silica import market witnessed a significant increase in concentration levels in 2024, with a high Herfindahl-Hirschman Index (HHI) indicating a competitive landscape dominated by key exporting countries like Germany, Turkey, China, Netherlands, and the USA. The compound annual growth rate (CAGR) for the period 2020-2024 stood at an impressive 15.63%, while the growth rate from 2023 to 2024 surged to 21.15%, underscoring the robust expansion and strong demand for green silica imports in Belgium. This data suggests a growing reliance on these top exporting nations for the supply of green silica in the Belgian market.
Key Highlights of the Report:
- Belgium Green Silica Market Outlook
- Market Size of Belgium Green Silica Market, 2025
- Forecast of Belgium Green Silica Market, 2032
- Historical Data and Forecast of Belgium Green Silica Revenues & Volume for the Period 2022 - 2032
- Belgium Green Silica Market Trend Evolution
- Belgium Green Silica Market Drivers and Challenges
- Belgium Green Silica Price Trends
- Belgium Green Silica Porter's Five Forces
- Belgium Green Silica Industry Life Cycle
- Historical Data and Forecast of Belgium Green Silica Market Revenues & Volume By Form for the Period 2022 - 2032
- Historical Data and Forecast of Belgium Green Silica Market Revenues & Volume By Powder for the Period 2022 - 2032
- Historical Data and Forecast of Belgium Green Silica Market Revenues & Volume By Granular for the Period 2022 - 2032
- Historical Data and Forecast of Belgium Green Silica Market Revenues & Volume By Micropearl for the Period 2022 - 2032
- Historical Data and Forecast of Belgium Green Silica Market Revenues & Volume By Source for the Period 2022 - 2032
- Historical Data and Forecast of Belgium Green Silica Market Revenues & Volume By Rice Husk Ash for the Period 2022 - 2032
- Historical Data and Forecast of Belgium Green Silica Market Revenues & Volume By Sugarcane Bagasse Ash for the Period 2022 - 2032
- Historical Data and Forecast of Belgium Green Silica Market Revenues & Volume By Bamboo Leaf for the Period 2022 - 2032
- Historical Data and Forecast of Belgium Green Silica Market Revenues & Volume By Corncob for the Period 2022 - 2032
- Historical Data and Forecast of Belgium Green Silica Market Revenues & Volume By Others (including Bamboo Culm and Banana Peel) for the Period 2022 - 2032
- Historical Data and Forecast of Belgium Green Silica Market Revenues & Volume By Type for the Period 2022 - 2032
- Historical Data and Forecast of Belgium Green Silica Market Revenues & Volume By Highly Dispersible Silica (HDS) for the Period 2022 - 2032
- Historical Data and Forecast of Belgium Green Silica Market Revenues & Volume By Easily Dispersible Silica (EDS) for the Period 2022 - 2032
- Historical Data and Forecast of Belgium Green Silica Market Revenues & Volume By Application for the Period 2022 - 2032
- Historical Data and Forecast of Belgium Green Silica Market Revenues & Volume By Consumer Goods for the Period 2022 - 2032
- Historical Data and Forecast of Belgium Green Silica Market Revenues & Volume By Industrial Rubber for the Period 2022 - 2032
- Historical Data and Forecast of Belgium Green Silica Market Revenues & Volume By Footwear for the Period 2022 - 2032
- Historical Data and Forecast of Belgium Green Silica Market Revenues & Volume By Food Products for the Period 2022 - 2032
- Historical Data and Forecast of Belgium Green Silica Market Revenues & Volume By Paints, Coatings, and Inks for the Period 2022 - 2032
- Historical Data and Forecast of Belgium Green Silica Market Revenues & Volume By Plastic Films for the Period 2022 - 2032
- Historical Data and Forecast of Belgium Green Silica Market Revenues & Volume By Others (including Oral Care Products) for the Period 2022 - 2032
- Historical Data and Forecast of Belgium Green Silica Market Revenues & Volume By End-use for the Period 2022 - 2032
- Historical Data and Forecast of Belgium Green Silica Market Revenues & Volume By Automotive for the Period 2022 - 2032
- Historical Data and Forecast of Belgium Green Silica Market Revenues & Volume By Paints & Coatings for the Period 2022 - 2032
- Historical Data and Forecast of Belgium Green Silica Market Revenues & Volume By Plastic & Packaging for the Period 2022 - 2032
- Historical Data and Forecast of Belgium Green Silica Market Revenues & Volume By Personal Care for the Period 2022 - 2032
- Historical Data and Forecast of Belgium Green Silica Market Revenues & Volume By Industrial for the Period 2022 - 2032
- Historical Data and Forecast of Belgium Green Silica Market Revenues & Volume By Food & Beverages for the Period 2022 - 2032
- Historical Data and Forecast of Belgium Green Silica Market Revenues & Volume By Others (including Construction and Cosmetics) for the Period 2022 - 2032
- Belgium Green Silica Import Export Trade Statistics
- Market Opportunity Assessment By Form
- Market Opportunity Assessment By Source
- Market Opportunity Assessment By Type
- Market Opportunity Assessment By Application
- Market Opportunity Assessment By End-use
- Belgium Green Silica Top Companies Market Share
- Belgium Green Silica Competitive Benchmarking By Technical and Operational Parameters
- Belgium Green Silica Company Profiles
- Belgium Green Silica Key Strategic Recommendations
Frequently Asked Questions About the Market Study (FAQs):
6Wresearch actively monitors the Belgium Green Silica Market and publishes its comprehensive annual report, highlighting emerging trends, growth drivers, revenue analysis, and forecast outlook. Our insights help businesses to make data-backed strategic decisions with ongoing market dynamics. Our analysts track relevent industries related to the Belgium Green Silica Market, allowing our clients with actionable intelligence and reliable forecasts tailored to emerging regional needs.
Yes, we provide customisation as per your requirements. To learn more, feel free to contact us on sales@6wresearch.com
1 Executive Summary |
2 Introduction |
2.1 Key Highlights of the Report |
2.2 Report Description |
2.3 Market Scope & Segmentation |
2.4 Research Methodology |
2.5 Assumptions |
3 Belgium Green Silica Market Overview |
3.1 Belgium Country Macro Economic Indicators |
3.2 Belgium Green Silica Market Revenues & Volume, 2022 & 2032F |
3.3 Belgium Green Silica Market - Industry Life Cycle |
3.4 Belgium Green Silica Market - Porter's Five Forces |
3.5 Belgium Green Silica Market Revenues & Volume Share, By Form, 2022 & 2032F |
3.6 Belgium Green Silica Market Revenues & Volume Share, By Source, 2022 & 2032F |
3.7 Belgium Green Silica Market Revenues & Volume Share, By Type, 2022 & 2032F |
3.8 Belgium Green Silica Market Revenues & Volume Share, By Application, 2022 & 2032F |
3.9 Belgium Green Silica Market Revenues & Volume Share, By End-use, 2022 & 2032F |
4 Belgium Green Silica Market Dynamics |
4.1 Impact Analysis |
4.2 Market Drivers |
4.2.1 Increasing demand for eco-friendly and sustainable products in various industries |
4.2.2 Government initiatives promoting the use of green silica for reducing carbon footprint |
4.2.3 Growing awareness among consumers about the benefits of green silica over traditional silica products |
4.3 Market Restraints |
4.3.1 High production costs associated with green silica extraction and processing |
4.3.2 Limited availability of high-quality green silica sources in Belgium |
4.3.3 Competition from substitute materials in the market |
5 Belgium Green Silica Market Trends |
6 Belgium Green Silica Market, By Types |
6.1 Belgium Green Silica Market, By Form |
6.1.1 Overview and Analysis |
6.1.2 Belgium Green Silica Market Revenues & Volume, By Form, 2022 - 2032F |
6.1.3 Belgium Green Silica Market Revenues & Volume, By Powder, 2022 - 2032F |
6.1.4 Belgium Green Silica Market Revenues & Volume, By Granular, 2022 - 2032F |
6.1.5 Belgium Green Silica Market Revenues & Volume, By Micropearl, 2022 - 2032F |
6.2 Belgium Green Silica Market, By Source |
6.2.1 Overview and Analysis |
6.2.2 Belgium Green Silica Market Revenues & Volume, By Rice Husk Ash, 2022 - 2032F |
6.2.3 Belgium Green Silica Market Revenues & Volume, By Sugarcane Bagasse Ash, 2022 - 2032F |
6.2.4 Belgium Green Silica Market Revenues & Volume, By Bamboo Leaf, 2022 - 2032F |
6.2.5 Belgium Green Silica Market Revenues & Volume, By Corncob, 2022 - 2032F |
6.2.6 Belgium Green Silica Market Revenues & Volume, By Others (including Bamboo Culm and Banana Peel), 2022 - 2032F |
6.3 Belgium Green Silica Market, By Type |
6.3.1 Overview and Analysis |
6.3.2 Belgium Green Silica Market Revenues & Volume, By Highly Dispersible Silica (HDS), 2022 - 2032F |
6.3.3 Belgium Green Silica Market Revenues & Volume, By Easily Dispersible Silica (EDS), 2022 - 2032F |
6.4 Belgium Green Silica Market, By Application |
6.4.1 Overview and Analysis |
6.4.2 Belgium Green Silica Market Revenues & Volume, By Consumer Goods, 2022 - 2032F |
6.4.3 Belgium Green Silica Market Revenues & Volume, By Industrial Rubber, 2022 - 2032F |
6.4.4 Belgium Green Silica Market Revenues & Volume, By Footwear, 2022 - 2032F |
6.4.5 Belgium Green Silica Market Revenues & Volume, By Food Products, 2022 - 2032F |
6.4.6 Belgium Green Silica Market Revenues & Volume, By Paints, Coatings, and Inks, 2022 - 2032F |
6.4.7 Belgium Green Silica Market Revenues & Volume, By Plastic Films, 2022 - 2032F |
6.5 Belgium Green Silica Market, By End-use |
6.5.1 Overview and Analysis |
6.5.2 Belgium Green Silica Market Revenues & Volume, By Automotive, 2022 - 2032F |
6.5.3 Belgium Green Silica Market Revenues & Volume, By Paints & Coatings, 2022 - 2032F |
6.5.4 Belgium Green Silica Market Revenues & Volume, By Plastic & Packaging, 2022 - 2032F |
6.5.5 Belgium Green Silica Market Revenues & Volume, By Personal Care, 2022 - 2032F |
6.5.6 Belgium Green Silica Market Revenues & Volume, By Industrial, 2022 - 2032F |
6.5.7 Belgium Green Silica Market Revenues & Volume, By Food & Beverages, 2022 - 2032F |
7 Belgium Green Silica Market Import-Export Trade Statistics |
7.1 Belgium Green Silica Market Export to Major Countries |
7.2 Belgium Green Silica Market Imports from Major Countries |
8 Belgium Green Silica Market Key Performance Indicators |
8.1 Percentage of companies adopting green silica in their manufacturing processes |
8.2 Research and development investment in green silica technologies |
8.3 Number of regulatory approvals for green silica applications |
8.4 Percentage increase in green silica usage across different industries |
8.5 Environmental impact assessment showing reduction in carbon emissions due to green silica adoption |
9 Belgium Green Silica Market - Opportunity Assessment |
9.1 Belgium Green Silica Market Opportunity Assessment, By Form, 2022 & 2032F |
9.2 Belgium Green Silica Market Opportunity Assessment, By Source, 2022 & 2032F |
9.3 Belgium Green Silica Market Opportunity Assessment, By Type, 2022 & 2032F |
9.4 Belgium Green Silica Market Opportunity Assessment, By Application, 2022 & 2032F |
9.5 Belgium Green Silica Market Opportunity Assessment, By End-use, 2022 & 2032F |
10 Belgium Green Silica Market - Competitive Landscape |
10.1 Belgium Green Silica Market Revenue Share, By Companies, 2025 |
10.2 Belgium Green Silica Market Competitive Benchmarking, By Operating and Technical Parameters |
11 Company Profiles |
12 Recommendations |
13 Disclaimer |
Global Go To Market Strategy - 2030
Export potential enables firms to identify high-growth global markets with greater confidence by combining advanced trade intelligence with a structured quantitative methodology. The framework analyzes emerging demand trends and country-level import patterns while integrating macroeconomic and trade datasets such as GDP and population forecasts, bilateral import–export flows, tariff structures, elasticity differentials between developed and developing economies, geographic distance, and import demand projections. Using weighted trade values from 2020–2024 as the base period to project country-to-country export potential for 2030, these inputs are operationalized through calculated drivers such as gravity model parameters, tariff impact factors, and projected GDP per-capita growth. Through an analysis of hidden potentials, demand hotspots, and market conditions that are most favorable to success, this method enables firms to focus on target countries, maximize returns, and global expansion with data, backed by accuracy.
By factoring in the projected importer demand gap that is currently unmet and could be potential opportunity, it identifies the potential for the Exporter (Country) among 190 countries, against the general trade analysis, which identifies the biggest importer or exporter.
To discover high-growth global markets and optimize your business strategy:
Click Here
Pricing
- Single User License$ 1,995
- Department License$ 2,400
- Site License$ 3,120
- Global License$ 3,795

Leadership Perspectives from Industry Events
Search
Thought Leadership and Analyst Meet


Our Clients
6WResearch In News
- Doha a strategic location for EV manufacturing hub: IPA Qatar
- Demand for luxury TVs surging in the GCC, says Samsung
- Empowering Growth: The Thriving Journey of Bangladesh’s Cable Industry
- Demand for luxury TVs surging in the GCC, says Samsung
- Video call with a traditional healer? Once unthinkable, it’s now common in South Africa
- Intelligent Buildings To Smooth GCC’s Path To Net Zero
Latest Reports
- Taiwan Airport Wireless Infrastructure Market (2026-2032)
- Vietnam Airport Wireless Infrastructure Market (2026-2032)
- Thailand Airport Wireless Infrastructure Market (2026-2032)
- South Korea Airport Wireless Infrastructure Market (2026-2032)
- Romania Airport Wireless Infrastructure Market (2026-2032)
- Qatar Airport Wireless Infrastructure Market (2026-2032)
- Philippines Airport Wireless Infrastructure Market (2026-2032)
- Japan Airport Wireless Infrastructure Market (2026-2032)
- Taiwan Airport Winter Services Market (2026-2032)
- Vietnam Airport Winter Services Market (2026-2032)
Industry Events and Analyst Meet

HIMTEX 2026

India Refining Summit 2026

India EV Show 2026

EV tech India Expo 2026

Auto Tech Asia 2026
Whitepaper
- Middle East & Africa Commercial Security Market Click here to view more.
- Middle East & Africa Fire Safety Systems & Equipment Market Click here to view more.
- GCC Drone Market Click here to view more.
- Middle East Lighting Fixture Market Click here to view more.
- GCC Physical & Perimeter Security Market Click here to view more.