Belgium Magnesia Carbon Bricks Market (2026-2032) | Challenges, Growth, Value, Industry, Consumer Insights, Investment Trends, Size, Strategic Insights, Segments, Revenue, Pricing Analysis, Competitive, Strategy, Analysis, Drivers, Supply, Outlook, Forecast, Restraints, Trends, Segmentation, Competition, Companies, Share, Opportunities, Demand
Market Forecast By Type (High-Carbon, Low-Carbon, Ultra-Low Carbon), By Application (Steelmaking, Electric Arc Furnace, Ladle Furnaces), By End User (Steel Industry, Foundries, Non-Ferrous Metal Industry), By Sales Channel (Direct Sales, Distributors, Online) And Competitive Landscape
| Product Code: ETC12894466 | Publication Date: Apr 2025 | Updated Date: Apr 2026 | Product Type: Market Research Report | |
| Publisher: 6Wresearch | Author: Sachin Kumar Rai | No. of Pages: 65 | No. of Figures: 34 | No. of Tables: 19 |
Belgium Magnesia Carbon Bricks Market Size (2020-2030)
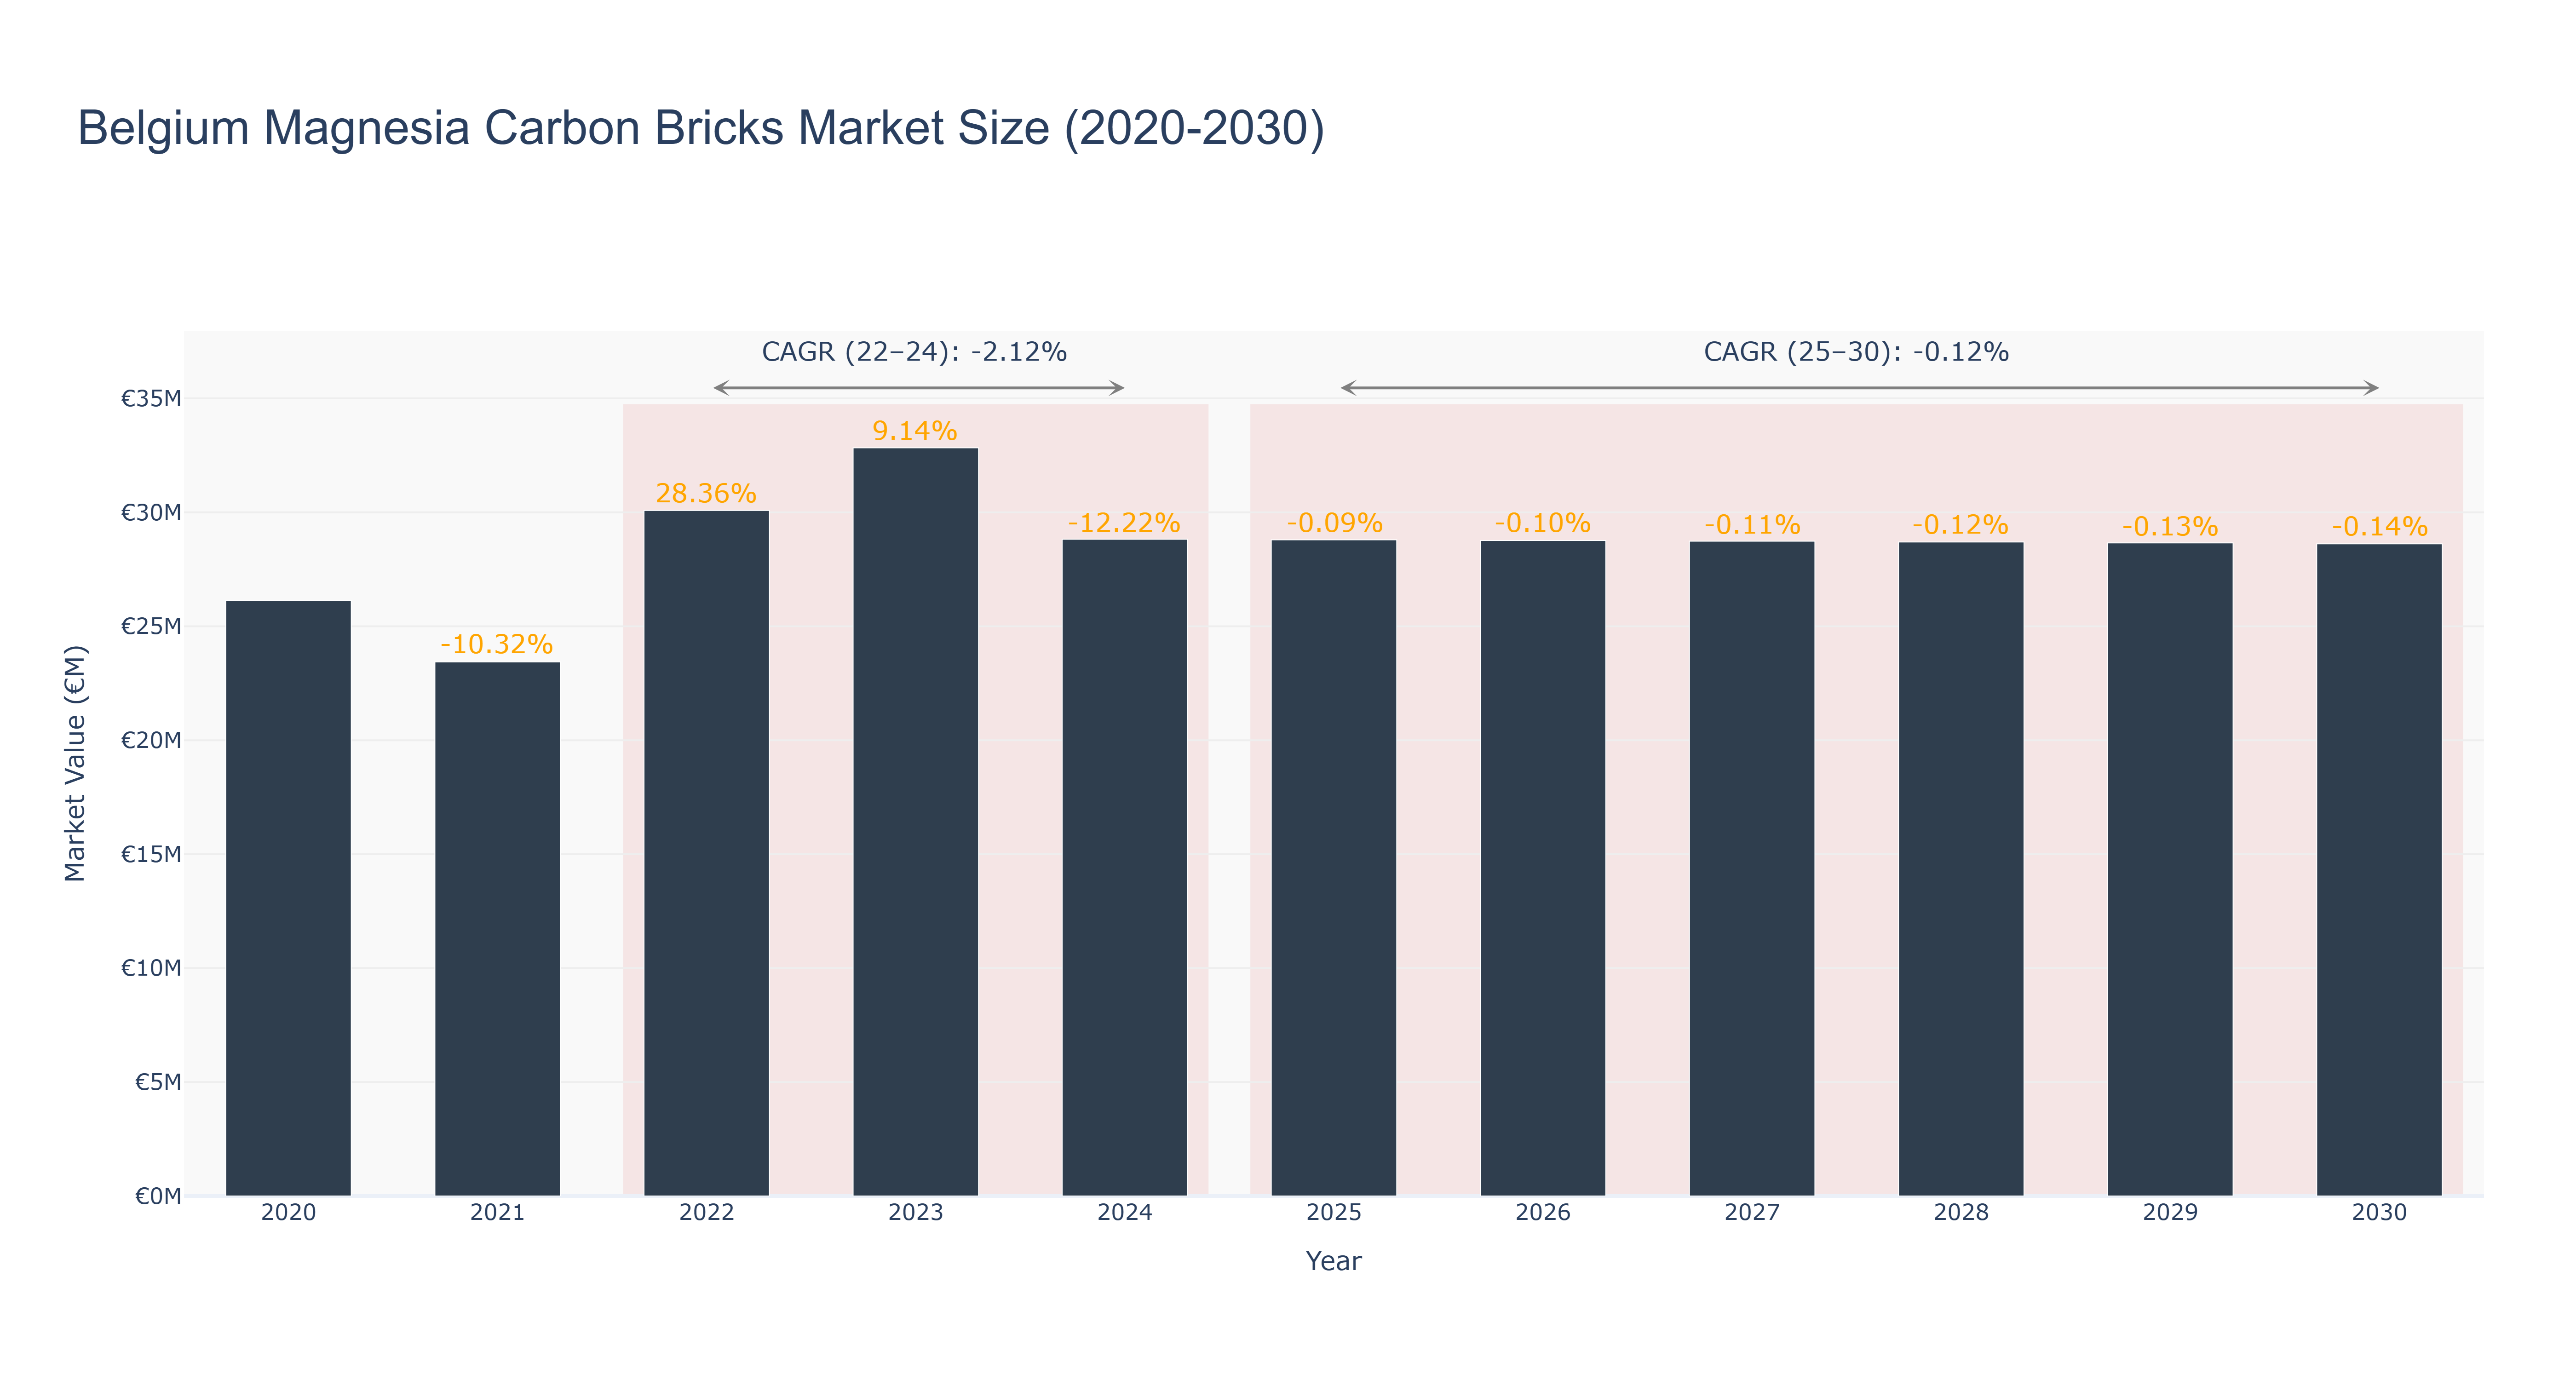
Belgium Magnesia Carbon Bricks Market experienced a peak market size of €32.83 million in 2023. The actual market size declined from €26.13 million in 2020 to €28.82 million in 2024, showing a negative growth trend. The forecasted market size is expected to stabilize around €28.60 million from 2025 to 2030, with a CAGR of -0.117% for this period. The market faced a significant decline in 2024 due to external factors impacting demand, while the slight fluctuations in subsequent years can be attributed to market saturation and competitive pressures. Industry drivers include the construction sector's demand for refractory materials and technological advancements in material composition. Looking ahead, Belgium is set to invest in sustainable construction projects utilizing magnesia carbon bricks to align with environmental regulations and enhance infrastructure resilience.
Belgium Magnesia Carbon Bricks Market: Production & Trade Performance (2019-2025)
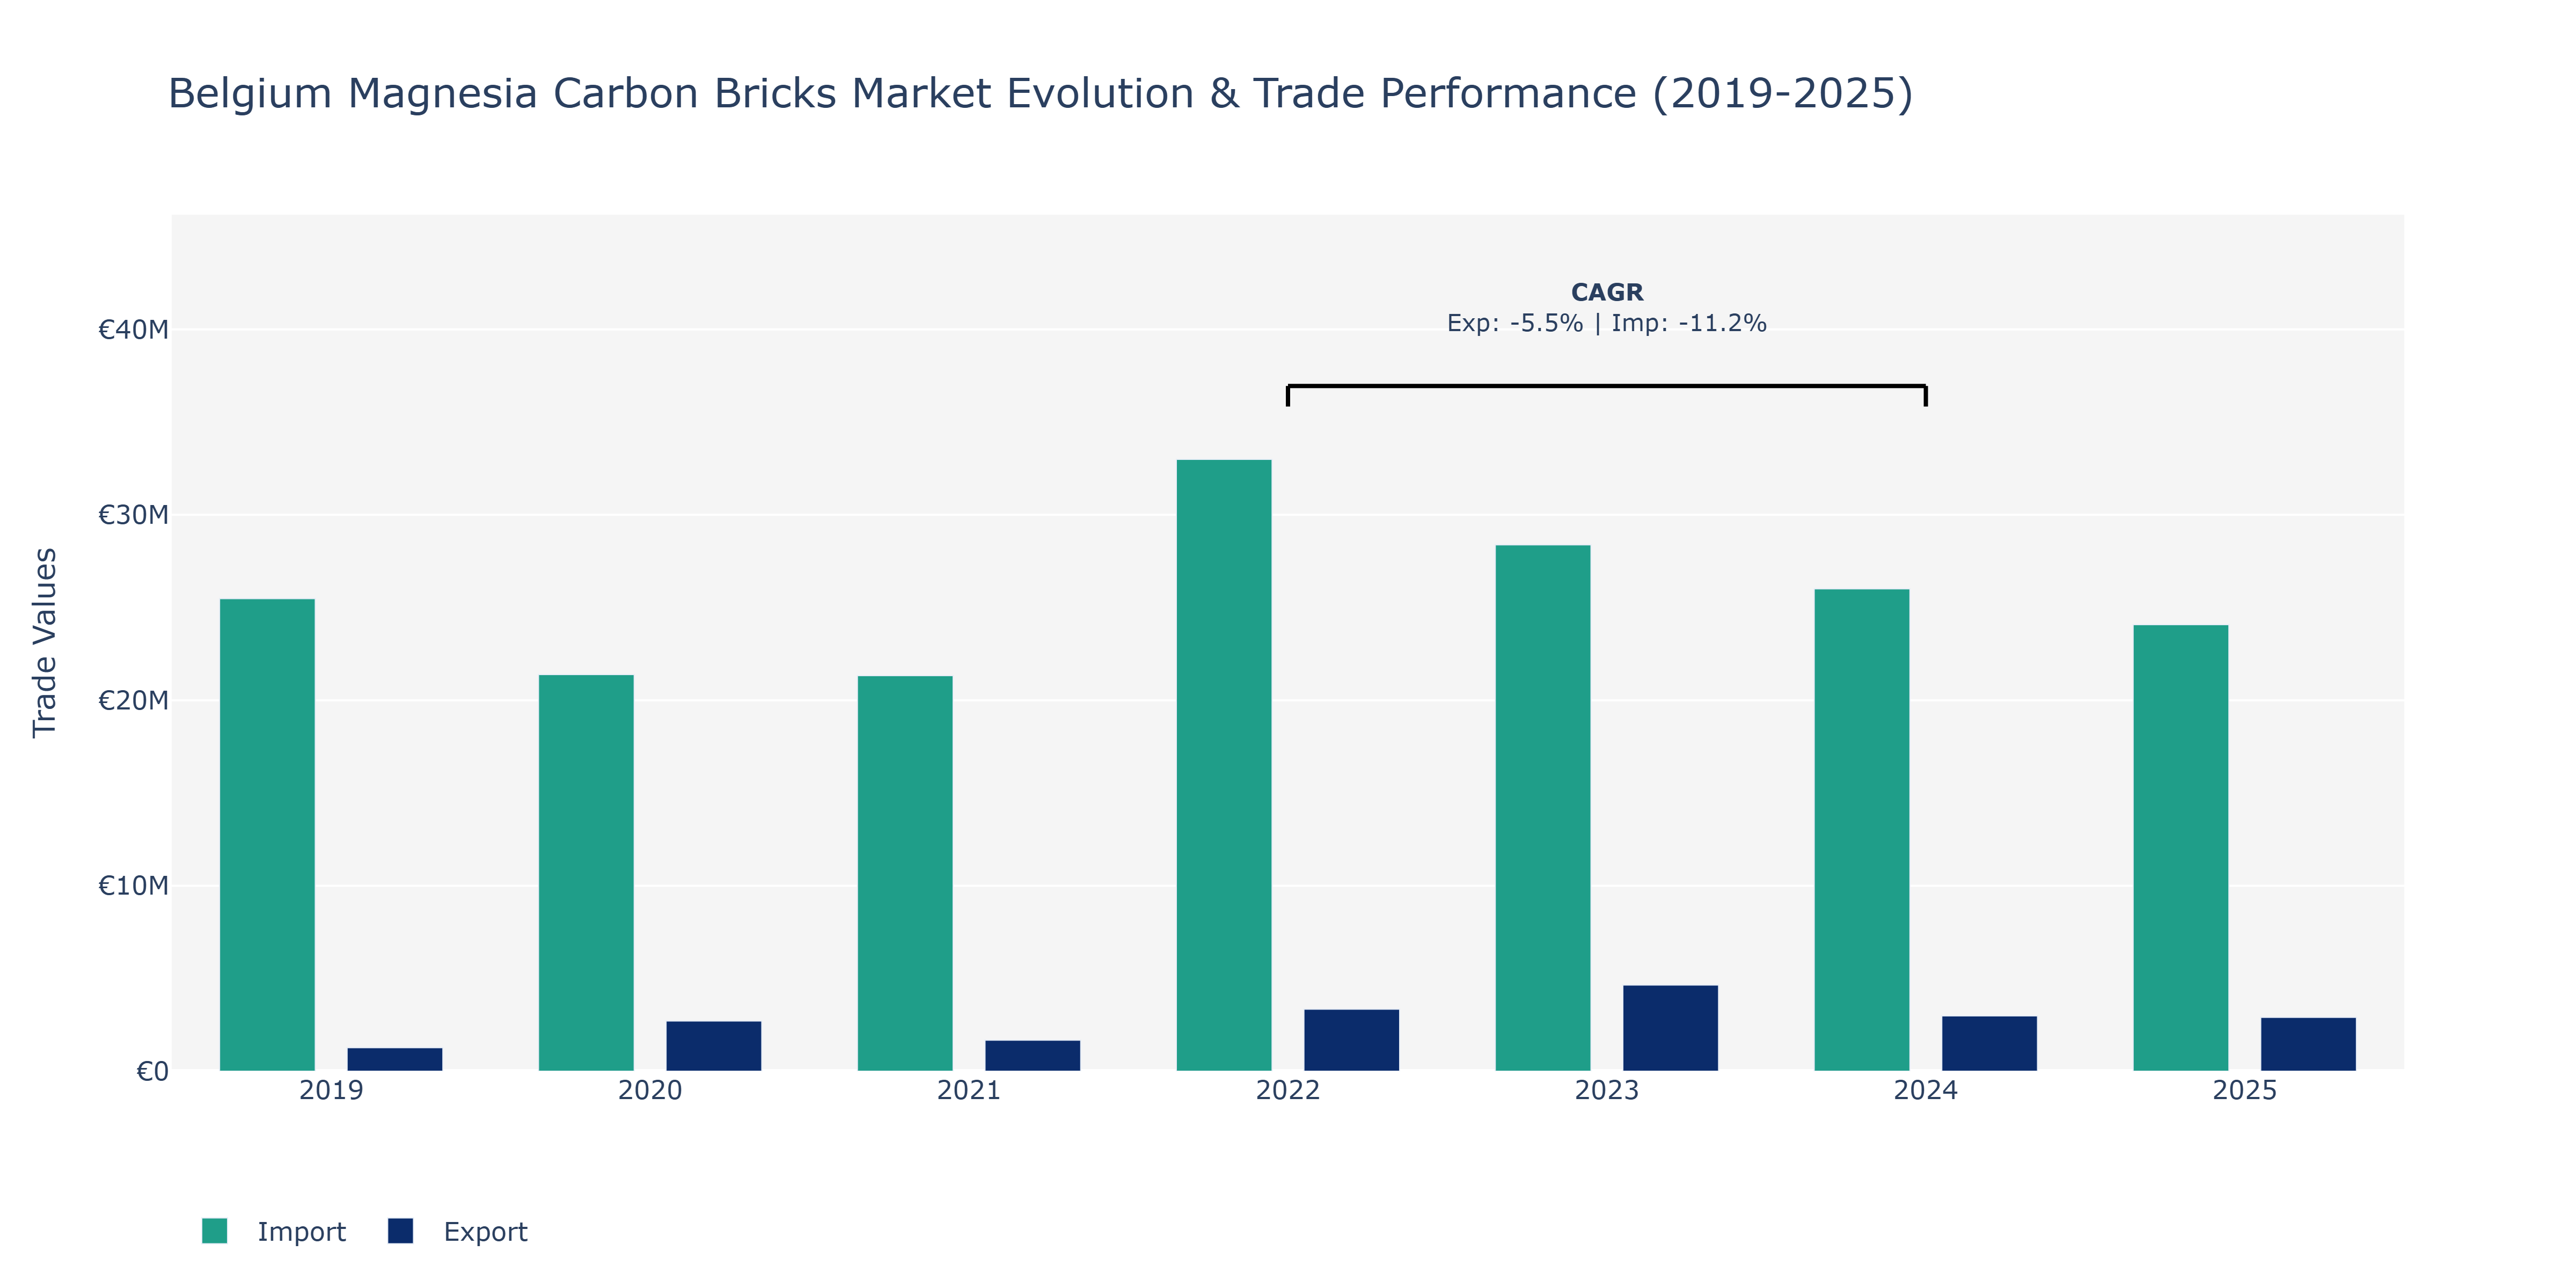
Between 2019 and 2025, Belgium's Magnesia Carbon Bricks market witnessed varying trends in both Exports and Imports. Exports peaked in 2023 at approximately €4.64 million, showcasing a steady increase from 2019. However, by 2025, exports decreased slightly to around €2.9 million. In contrast, Imports fluctuated throughout the period, with a peak in 2022 at nearly €32.99 million and a decline to around €24.07 million in 2025. The decrease in imports from 2022 to 2025 could be attributed to shifts in global supply chains, changes in demand for magnesia carbon bricks, or fluctuations in currency exchange rates impacting trade dynamics. The declining trend in exports from 2023 to 2025 may have been influenced by increased competition in international markets, leading Belgium to adjust its export strategies or product mix. Further analysis into evolving industry standards, advancements in refractory materials, or geopolitical factors affecting trade relations could provide additional context to these market movements.
Key Highlights of the Report:
- Belgium Magnesia Carbon Bricks Market Outlook
- Market Size of Belgium Magnesia Carbon Bricks Market, 2025
- Forecast of Belgium Magnesia Carbon Bricks Market, 2032
- Historical Data and Forecast of Belgium Magnesia Carbon Bricks Revenues & Volume for the Period 2022 - 2032F
- Belgium Magnesia Carbon Bricks Market Trend Evolution
- Belgium Magnesia Carbon Bricks Market Drivers and Challenges
- Belgium Magnesia Carbon Bricks Price Trends
- Belgium Magnesia Carbon Bricks Porter's Five Forces
- Belgium Magnesia Carbon Bricks Industry Life Cycle
- Historical Data and Forecast of Belgium Magnesia Carbon Bricks Market Revenues & Volume By Type for the Period 2022 - 2032F
- Historical Data and Forecast of Belgium Magnesia Carbon Bricks Market Revenues & Volume By High-Carbon for the Period 2022 - 2032F
- Historical Data and Forecast of Belgium Magnesia Carbon Bricks Market Revenues & Volume By Low-Carbon for the Period 2022 - 2032F
- Historical Data and Forecast of Belgium Magnesia Carbon Bricks Market Revenues & Volume By Ultra-Low Carbon for the Period 2022 - 2032F
- Historical Data and Forecast of Belgium Magnesia Carbon Bricks Market Revenues & Volume By Application for the Period 2022 - 2032F
- Historical Data and Forecast of Belgium Magnesia Carbon Bricks Market Revenues & Volume By Steelmaking for the Period 2022 - 2032F
- Historical Data and Forecast of Belgium Magnesia Carbon Bricks Market Revenues & Volume By Electric Arc Furnace for the Period 2022 - 2032F
- Historical Data and Forecast of Belgium Magnesia Carbon Bricks Market Revenues & Volume By Ladle Furnaces for the Period 2022 - 2032F
- Historical Data and Forecast of Belgium Magnesia Carbon Bricks Market Revenues & Volume By End User for the Period 2022 - 2032F
- Historical Data and Forecast of Belgium Magnesia Carbon Bricks Market Revenues & Volume By Steel Industry for the Period 2022 - 2032F
- Historical Data and Forecast of Belgium Magnesia Carbon Bricks Market Revenues & Volume By Foundries for the Period 2022 - 2032F
- Historical Data and Forecast of Belgium Magnesia Carbon Bricks Market Revenues & Volume By Non-Ferrous Metal Industry for the Period 2022 - 2032F
- Historical Data and Forecast of Belgium Magnesia Carbon Bricks Market Revenues & Volume By Sales Channel for the Period 2022 - 2032F
- Historical Data and Forecast of Belgium Magnesia Carbon Bricks Market Revenues & Volume By Direct Sales for the Period 2022 - 2032F
- Historical Data and Forecast of Belgium Magnesia Carbon Bricks Market Revenues & Volume By Distributors for the Period 2022 - 2032F
- Historical Data and Forecast of Belgium Magnesia Carbon Bricks Market Revenues & Volume By Online for the Period 2022 - 2032F
- Belgium Magnesia Carbon Bricks Import Export Trade Statistics
- Market Opportunity Assessment By Type
- Market Opportunity Assessment By Application
- Market Opportunity Assessment By End User
- Market Opportunity Assessment By Sales Channel
- Belgium Magnesia Carbon Bricks Top Companies Market Share
- Belgium Magnesia Carbon Bricks Competitive Benchmarking By Technical and Operational Parameters
- Belgium Magnesia Carbon Bricks Company Profiles
- Belgium Magnesia Carbon Bricks Key Strategic Recommendations
Frequently Asked Questions About the Market Study (FAQs):
6Wresearch actively monitors the Belgium Magnesia Carbon Bricks Market and publishes its comprehensive annual report, highlighting emerging trends, growth drivers, revenue analysis, and forecast outlook. Our insights help businesses to make data-backed strategic decisions with ongoing market dynamics. Our analysts track relevent industries related to the Belgium Magnesia Carbon Bricks Market, allowing our clients with actionable intelligence and reliable forecasts tailored to emerging regional needs.
Yes, we provide customisation as per your requirements. To learn more, feel free to contact us on sales@6wresearch.com
1 Executive Summary |
2 Introduction |
2.1 Key Highlights of the Report |
2.2 Report Description |
2.3 Market Scope & Segmentation |
2.4 Research Methodology |
2.5 Assumptions |
3 Belgium Magnesia Carbon Bricks Market Overview |
3.1 Belgium Country Macro Economic Indicators |
3.2 Belgium Magnesia Carbon Bricks Market Revenues & Volume, 2022 & 2032F |
3.3 Belgium Magnesia Carbon Bricks Market - Industry Life Cycle |
3.4 Belgium Magnesia Carbon Bricks Market - Porter's Five Forces |
3.5 Belgium Magnesia Carbon Bricks Market Revenues & Volume Share, By Type, 2022 & 2032F |
3.6 Belgium Magnesia Carbon Bricks Market Revenues & Volume Share, By Application, 2022 & 2032F |
3.7 Belgium Magnesia Carbon Bricks Market Revenues & Volume Share, By End User, 2022 & 2032F |
3.8 Belgium Magnesia Carbon Bricks Market Revenues & Volume Share, By Sales Channel, 2022 & 2032F |
4 Belgium Magnesia Carbon Bricks Market Dynamics |
4.1 Impact Analysis |
4.2 Market Drivers |
4.2.1 Increasing demand for high-performance refractory materials in industries such as steel, cement, and non-ferrous metals. |
4.2.2 Growing focus on energy efficiency and sustainability, leading to the adoption of magnesia carbon bricks for their durability and resistance to high temperatures. |
4.2.3 Technological advancements in the production processes of magnesia carbon bricks, resulting in improved quality and performance. |
4.3 Market Restraints |
4.3.1 Fluctuating raw material prices, such as magnesia and graphite, impacting the overall production cost of magnesia carbon bricks. |
4.3.2 Stringent environmental regulations and concerns related to the use of carbon-based materials in refractories, leading to potential restrictions on their usage. |
5 Belgium Magnesia Carbon Bricks Market Trends |
6 Belgium Magnesia Carbon Bricks Market, By Types |
6.1 Belgium Magnesia Carbon Bricks Market, By Type |
6.1.1 Overview and Analysis |
6.1.2 Belgium Magnesia Carbon Bricks Market Revenues & Volume, By Type, 2022 - 2032F |
6.1.3 Belgium Magnesia Carbon Bricks Market Revenues & Volume, By High-Carbon, 2022 - 2032F |
6.1.4 Belgium Magnesia Carbon Bricks Market Revenues & Volume, By Low-Carbon, 2022 - 2032F |
6.1.5 Belgium Magnesia Carbon Bricks Market Revenues & Volume, By Ultra-Low Carbon, 2022 - 2032F |
6.2 Belgium Magnesia Carbon Bricks Market, By Application |
6.2.1 Overview and Analysis |
6.2.2 Belgium Magnesia Carbon Bricks Market Revenues & Volume, By Steelmaking, 2022 - 2032F |
6.2.3 Belgium Magnesia Carbon Bricks Market Revenues & Volume, By Electric Arc Furnace, 2022 - 2032F |
6.2.4 Belgium Magnesia Carbon Bricks Market Revenues & Volume, By Ladle Furnaces, 2022 - 2032F |
6.3 Belgium Magnesia Carbon Bricks Market, By End User |
6.3.1 Overview and Analysis |
6.3.2 Belgium Magnesia Carbon Bricks Market Revenues & Volume, By Steel Industry, 2022 - 2032F |
6.3.3 Belgium Magnesia Carbon Bricks Market Revenues & Volume, By Foundries, 2022 - 2032F |
6.3.4 Belgium Magnesia Carbon Bricks Market Revenues & Volume, By Non-Ferrous Metal Industry, 2022 - 2032F |
6.4 Belgium Magnesia Carbon Bricks Market, By Sales Channel |
6.4.1 Overview and Analysis |
6.4.2 Belgium Magnesia Carbon Bricks Market Revenues & Volume, By Direct Sales, 2022 - 2032F |
6.4.3 Belgium Magnesia Carbon Bricks Market Revenues & Volume, By Distributors, 2022 - 2032F |
6.4.4 Belgium Magnesia Carbon Bricks Market Revenues & Volume, By Online, 2022 - 2032F |
7 Belgium Magnesia Carbon Bricks Market Import-Export Trade Statistics |
7.1 Belgium Magnesia Carbon Bricks Market Export to Major Countries |
7.2 Belgium Magnesia Carbon Bricks Market Imports from Major Countries |
8 Belgium Magnesia Carbon Bricks Market Key Performance Indicators |
8.1 Average service life of magnesia carbon bricks in industrial applications. |
8.2 Percentage increase in adoption of magnesia carbon bricks in high-temperature processes. |
8.3 Research and development investment in innovative formulations and designs of magnesia carbon bricks. |
8.4 Number of patents filed for new technologies or applications related to magnesia carbon bricks. |
8.5 Carbon footprint reduction achieved through the use of magnesia carbon bricks compared to traditional refractory materials. |
9 Belgium Magnesia Carbon Bricks Market - Opportunity Assessment |
9.1 Belgium Magnesia Carbon Bricks Market Opportunity Assessment, By Type, 2022 & 2032F |
9.2 Belgium Magnesia Carbon Bricks Market Opportunity Assessment, By Application, 2022 & 2032F |
9.3 Belgium Magnesia Carbon Bricks Market Opportunity Assessment, By End User, 2022 & 2032F |
9.4 Belgium Magnesia Carbon Bricks Market Opportunity Assessment, By Sales Channel, 2022 & 2032F |
10 Belgium Magnesia Carbon Bricks Market - Competitive Landscape |
10.1 Belgium Magnesia Carbon Bricks Market Revenue Share, By Companies, 2025 |
10.2 Belgium Magnesia Carbon Bricks Market Competitive Benchmarking, By Operating and Technical Parameters |
11 Company Profiles |
12 Recommendations |
13 Disclaimer |
Export potential assessment - trade Analytics for 2030
Export potential enables firms to identify high-growth global markets with greater confidence by combining advanced trade intelligence with a structured quantitative methodology. The framework analyzes emerging demand trends and country-level import patterns while integrating macroeconomic and trade datasets such as GDP and population forecasts, bilateral import–export flows, tariff structures, elasticity differentials between developed and developing economies, geographic distance, and import demand projections. Using weighted trade values from 2020–2024 as the base period to project country-to-country export potential for 2030, these inputs are operationalized through calculated drivers such as gravity model parameters, tariff impact factors, and projected GDP per-capita growth. Through an analysis of hidden potentials, demand hotspots, and market conditions that are most favorable to success, this method enables firms to focus on target countries, maximize returns, and global expansion with data, backed by accuracy.
By factoring in the projected importer demand gap that is currently unmet and could be potential opportunity, it identifies the potential for the Exporter (Country) among 190 countries, against the general trade analysis, which identifies the biggest importer or exporter.
To discover high-growth global markets and optimize your business strategy:
Click Here
Pricing
- Single User License$ 1,995
- Department License$ 2,400
- Site License$ 3,120
- Global License$ 3,795

Search
Thought Leadership and Analyst Meet


Our Clients
Latest Reports
- Canada Cloud CFD Market (2026-2032) | Size & Revenue, Industry, Growth, Competitive Landscape, Forecast, Segmentation, Value, Outlook, Trends, Share, Analysis, Companies
- Taiwan Food Delivery Platform Market (2026-2032) | Companies, Outlook, Analysis, Trends, Value, Revenue, Segmentation, Share, Forecast, Competitive Landscape, Growth, Size & Forecast
- United Kingdom (UK) Long-term Care Insurance Market (2026-2032) | Growth, Share, Consumer Insights, Drivers, Opportunities, Competition, Pricing Analysis, Segments, Restraints, Companies, Competitive, Value, Outlook, Size, Demand, Analysis, Challenges, Strategic Insights, Investment Trends, Revenue, Trends, Supply, Forecast
- United Kingdom (UK) Long Term Care Market (2026-2032) | Companies, Outlook, Analysis, Trends, Value, Revenue, Segmentation, Share, Forecast, Competitive Landscape, Growth, Size & Forecast
- Iraq Insulation and Waterproofing Market (2026-2032) | Outlook, Drivers, Growth, Size, Share, Industry, Revenue, Trends, Demand, Competitive, Strategic Insights, Opportunities, Segments, Companies, Challenges, Strategy, Consumer Insights, Analysis, Investment Trends, Value, Segmentation, Forecast, Restraints
- India Switchgear Market Outlook (2026-2032) | Size, Share, Trends, Growth, Revenue, Forecast, Analysis, Value, Outlook
- Pakistan Contraceptive Implants Market (2025-2031) | Demand, Growth, Size, Share, Industry, Pricing Analysis, Competitive, Strategic Insights, Strategy, Consumer Insights, Analysis, Investment Trends, Opportunities, Revenue, Segments, Value, Segmentation, Supply, Forecast, Restraints, Outlook, Competition, Drivers, Trends, Companies, Challenges
- Sri Lanka Packaging Market (2026-2032) | Outlook, Competition, Drivers, Trends, Demand, Pricing Analysis, Competitive, Strategic Insights, Companies, Challenges, Strategy, Consumer Insights, Analysis, Investment Trends, Opportunities, Growth, Size, Share, Industry, Revenue, Segments, Value, Segmentation, Supply, Forecast, Restraints
- India Kids Watches Market (2026-2032) | Strategy, Consumer Insights, Analysis, Investment Trends, Opportunities, Growth, Size, Share, Industry, Revenue, Segments, Value, Segmentation, Supply, Forecast, Restraints, Outlook, Competition, Drivers, Trends, Demand, Pricing Analysis, Competitive, Strategic Insights, Companies, Challenges
- Saudi Arabia Core Assurance Service Market (2025-2031) | Strategy, Consumer Insights, Analysis, Investment Trends, Opportunities, Growth, Size, Share, Industry, Revenue, Segments, Value, Segmentation, Supply, Forecast, Restraints, Outlook, Competition, Drivers, Trends, Demand, Pricing Analysis, Competitive, Strategic Insights, Companies, Challenges
Industry Events and Analyst Meet

India EV Show 2026

EV tech India Expo 2026

Auto Tech Asia 2026

Battery Tech India 2026

Smart Production Solutions Guangzhou 2026
Whitepaper
- Middle East & Africa Commercial Security Market Click here to view more.
- Middle East & Africa Fire Safety Systems & Equipment Market Click here to view more.
- GCC Drone Market Click here to view more.
- Middle East Lighting Fixture Market Click here to view more.
- GCC Physical & Perimeter Security Market Click here to view more.
6WResearch In News
- Doha a strategic location for EV manufacturing hub: IPA Qatar
- Demand for luxury TVs surging in the GCC, says Samsung
- Empowering Growth: The Thriving Journey of Bangladesh’s Cable Industry
- Demand for luxury TVs surging in the GCC, says Samsung
- Video call with a traditional healer? Once unthinkable, it’s now common in South Africa
- Intelligent Buildings To Smooth GCC’s Path To Net Zero