Belgium Molasses Market (2025-2031) | Trends, Revenue, Analysis, Companies, Outlook, Forecast, Segmentation, Growth, Share, Industry, Value & Size
Market Forecast By Source (Sugarcane, Sugarbeet), By Type (Regular Molasses, Blackstrap Molasses), By Nature (Organic, Conventional), By End-Use (Industrial, Commercial, Household), By Sales Channel (Direct , Indirect) And Competitive Landscape
| Product Code: ETC5683207 | Publication Date: Nov 2023 | Updated Date: Oct 2025 | Product Type: Market Research Report | |
| Publisher: 6Wresearch | Author: Sumit Sagar | No. of Pages: 60 | No. of Figures: 30 | No. of Tables: 5 |
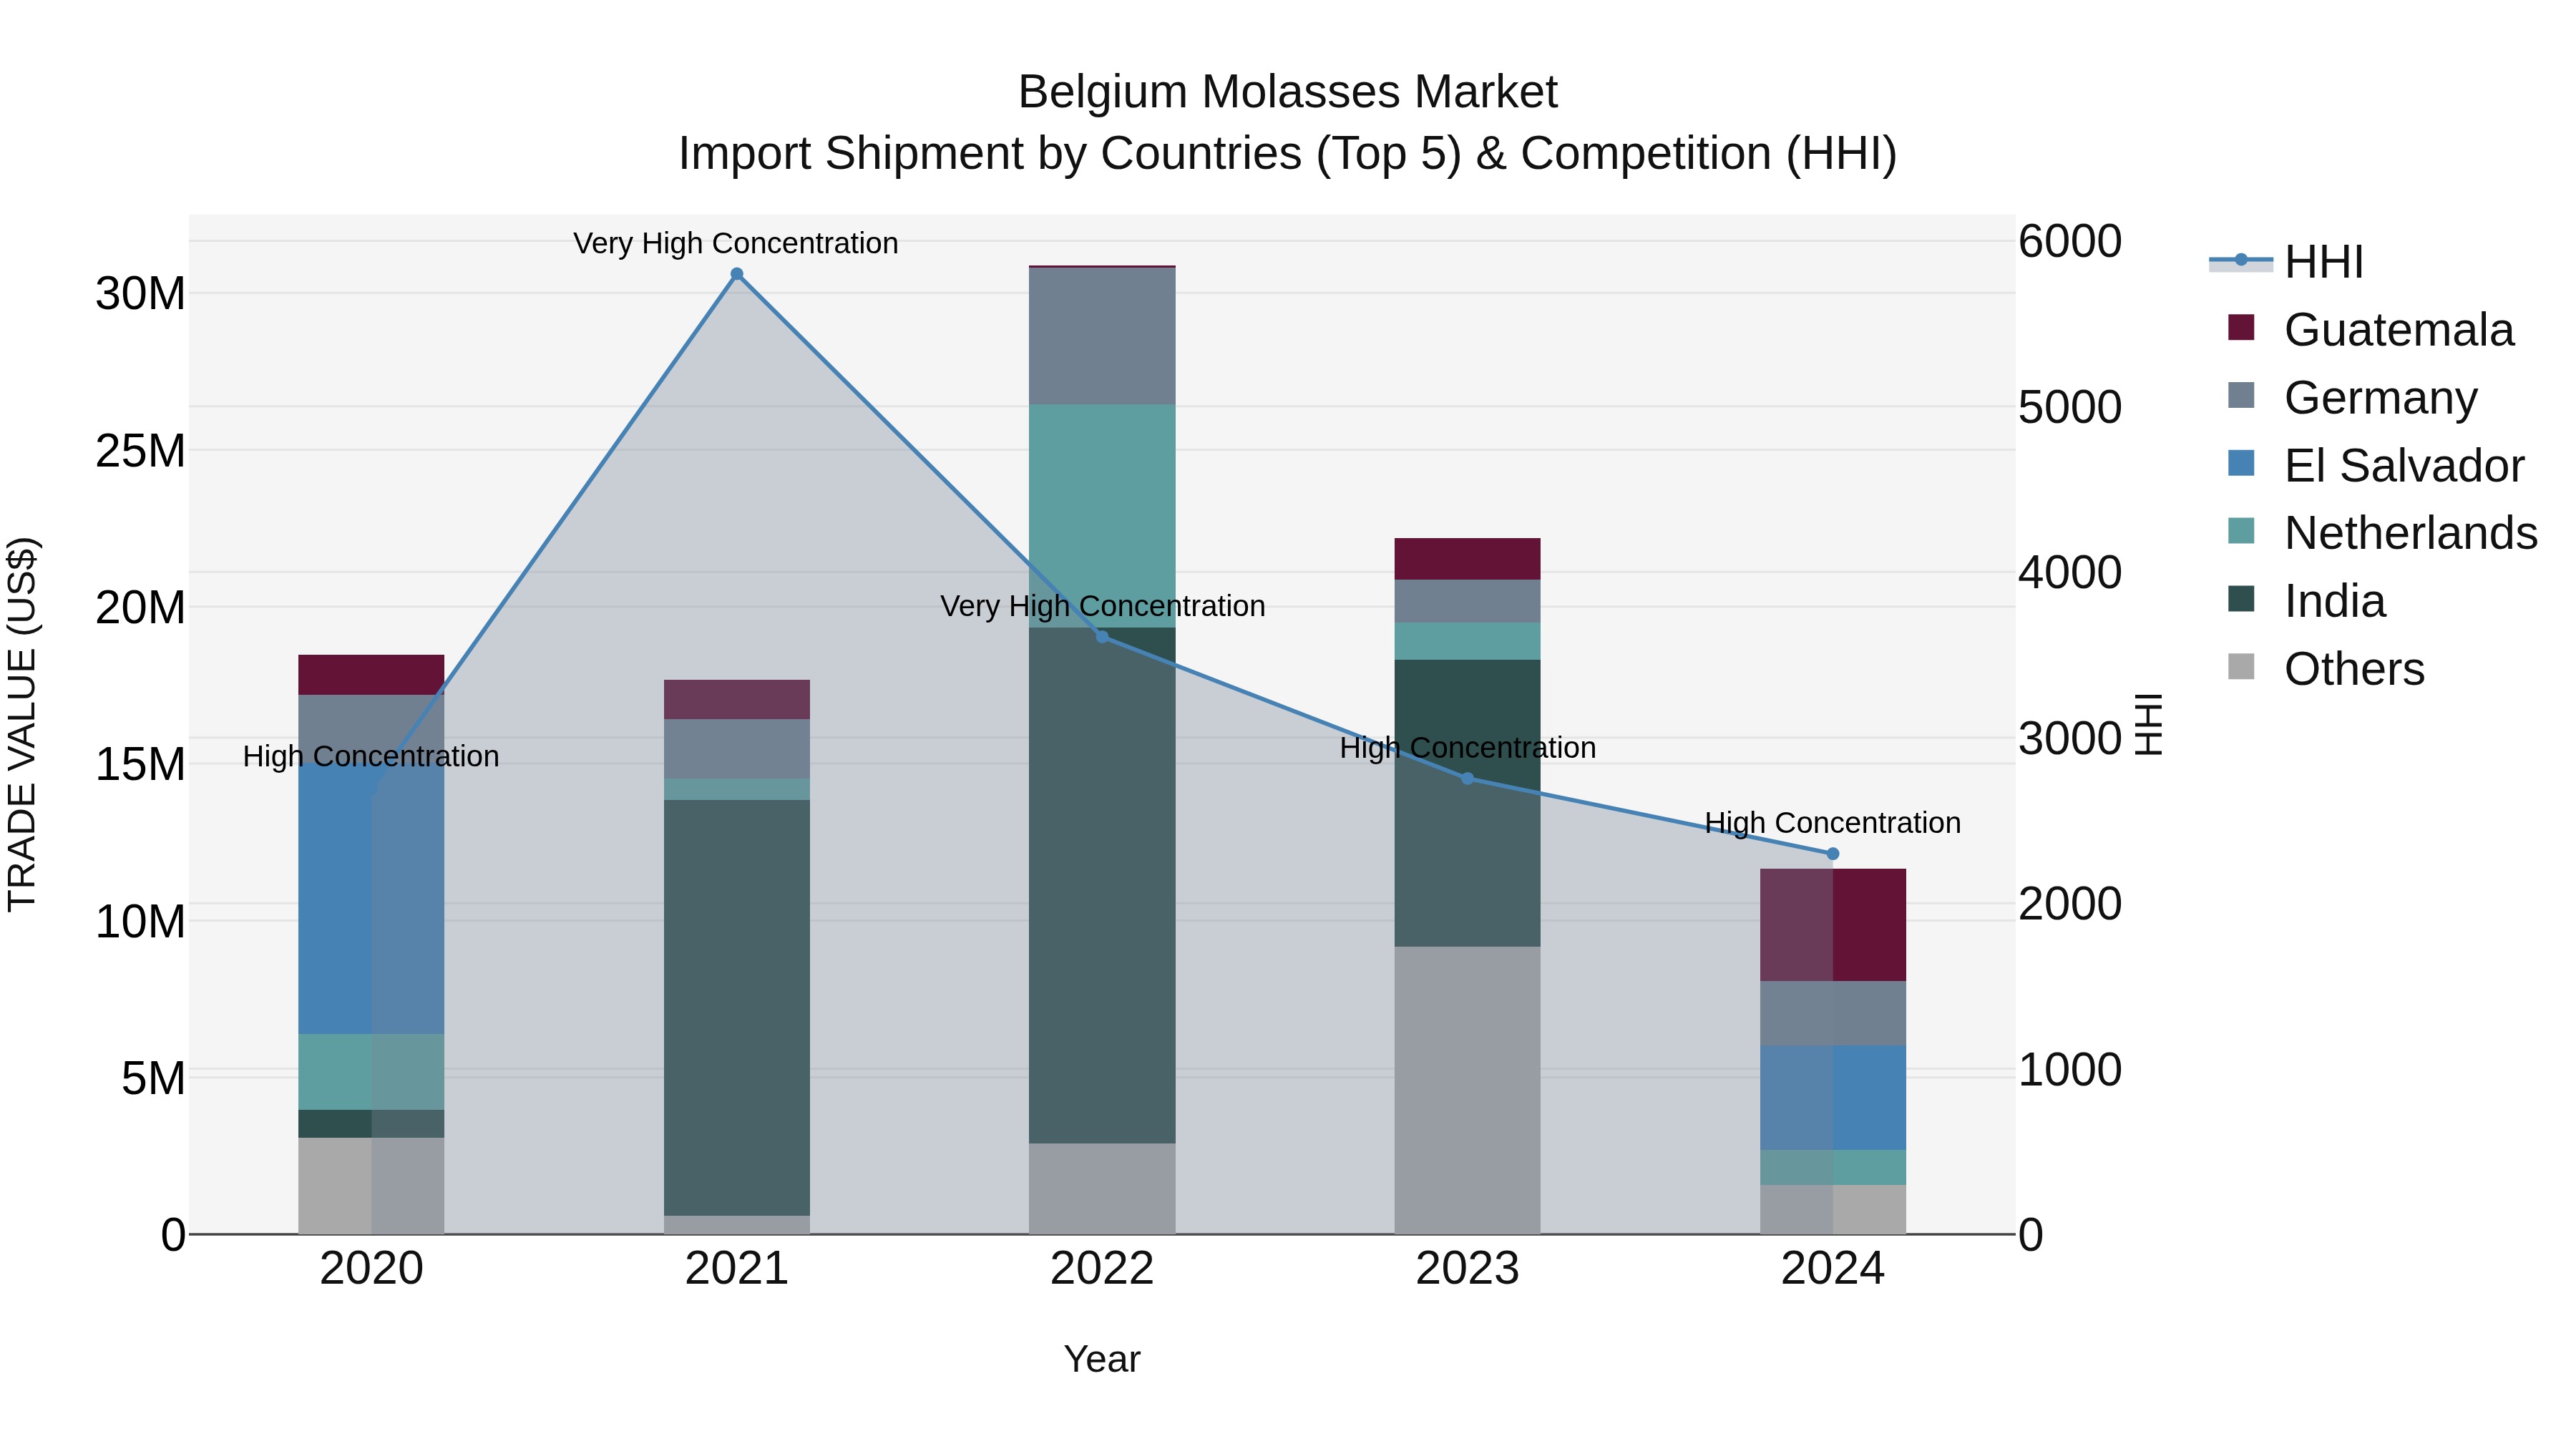
Belgium Molasses Market Top 5 Importing Countries and Market Competition (HHI) Analysis
Belgium continued to be a key player in molasses imports in 2024, with Guatemala, El Salvador, Germany, USA, and the Netherlands dominating the market. Despite a high concentration level measured by the HHI, the industry experienced a significant decline in the compound annual growth rate (CAGR) of -10.9% from 2020 to 2024. Additionally, the growth rate plummeted even further in 2024, with a sharp decline of -47.52% compared to the previous year. These figures suggest a challenging landscape for molasses importers in Belgium, necessitating strategic adjustments to navigate the market effectively.
Belgium Molasses Market Overview
The molasses market in Belgium is growing due to the increasing demand for this versatile by-product in various applications, including food, beverages, and animal feed. Molasses, known for its rich nutrient content, is used as a sweetener and fermentation substrate. Innovations in production processes and the emphasis on sustainable agriculture are driving market growth.
Drivers of the market
The molasses market in Belgium is driven by the demand for this byproduct of sugar production used in various applications, including food, beverages, and animal feed. Molasses offers valuable nutrients and functional properties. Belgium`s focus on food processing and advancements in molasses utilization support market growth. The increasing need for versatile and cost-effective ingredients drives market development.
Challenges of the market
The Belgium molasses market faces challenges in sourcing and quality control. Securing a consistent supply of high-quality molasses can be challenging due to agricultural fluctuations and market competition. Additionally, ensuring that molasses meets stringent quality standards for various applications, such as food and feed, requires robust quality control measures.
Government Policy of the market
Government policies in Belgium promote the molasses market by encouraging the use of high-quality and sustainable molasses products. Grants for research and development in advanced molasses processing technologies enhance market competitiveness. Policies ensuring quality and safety standards drive the adoption of molasses in various applications.
Key Highlights of the Report:
- Belgium Molasses Market Outlook
- Market Size of Belgium Molasses Market, 2024
- Forecast of Belgium Molasses Market, 2031
- Historical Data and Forecast of Belgium Molasses Revenues & Volume for the Period 2021-2031
- Belgium Molasses Market Trend Evolution
- Belgium Molasses Market Drivers and Challenges
- Belgium Molasses Price Trends
- Belgium Molasses Porter`s Five Forces
- Belgium Molasses Industry Life Cycle
- Historical Data and Forecast of Belgium Molasses Market Revenues & Volume By Source for the Period 2021-2031
- Historical Data and Forecast of Belgium Molasses Market Revenues & Volume By Sugarcane for the Period 2021-2031
- Historical Data and Forecast of Belgium Molasses Market Revenues & Volume By Sugarbeet for the Period 2021-2031
- Historical Data and Forecast of Belgium Molasses Market Revenues & Volume By Type for the Period 2021-2031
- Historical Data and Forecast of Belgium Molasses Market Revenues & Volume By Regular Molasses for the Period 2021-2031
- Historical Data and Forecast of Belgium Molasses Market Revenues & Volume By Blackstrap Molasses for the Period 2021-2031
- Historical Data and Forecast of Belgium Molasses Market Revenues & Volume By Nature for the Period 2021-2031
- Historical Data and Forecast of Belgium Molasses Market Revenues & Volume By Organic for the Period 2021-2031
- Historical Data and Forecast of Belgium Molasses Market Revenues & Volume By Conventional for the Period 2021-2031
- Historical Data and Forecast of Belgium Molasses Market Revenues & Volume By End-Use for the Period 2021-2031
- Historical Data and Forecast of Belgium Molasses Market Revenues & Volume By Industrial for the Period 2021-2031
- Historical Data and Forecast of Belgium Molasses Market Revenues & Volume By Commercial for the Period 2021-2031
- Historical Data and Forecast of Belgium Molasses Market Revenues & Volume By Household for the Period 2021-2031
- Historical Data and Forecast of Belgium Molasses Market Revenues & Volume By Sales Channel for the Period 2021-2031
- Historical Data and Forecast of Belgium Molasses Market Revenues & Volume By Direct for the Period 2021-2031
- Historical Data and Forecast of Belgium Molasses Market Revenues & Volume By Indirect for the Period 2021-2031
- Belgium Molasses Import Export Trade Statistics
- Market Opportunity Assessment By Source
- Market Opportunity Assessment By Type
- Market Opportunity Assessment By Nature
- Market Opportunity Assessment By End-Use
- Market Opportunity Assessment By Sales Channel
- Belgium Molasses Top Companies Market Share
- Belgium Molasses Competitive Benchmarking By Technical and Operational Parameters
- Belgium Molasses Company Profiles
- Belgium Molasses Key Strategic Recommendations
Frequently Asked Questions About the Market Study (FAQs):
6Wresearch actively monitors the Belgium Molasses Market and publishes its comprehensive annual report, highlighting emerging trends, growth drivers, revenue analysis, and forecast outlook. Our insights help businesses to make data-backed strategic decisions with ongoing market dynamics. Our analysts track relevent industries related to the Belgium Molasses Market, allowing our clients with actionable intelligence and reliable forecasts tailored to emerging regional needs.
Yes, we provide customisation as per your requirements. To learn more, feel free to contact us on sales@6wresearch.com
1 Executive Summary |
2 Introduction |
2.1 Key Highlights of the Report |
2.2 Report Description |
2.3 Market Scope & Segmentation |
2.4 Research Methodology |
2.5 Assumptions |
3 Belgium Molasses? Market Overview |
3.1 Belgium Country Macro Economic Indicators |
3.2 Belgium Molasses? Market Revenues & Volume, 2021 & 2031F |
3.3 Belgium Molasses? Market - Industry Life Cycle |
3.4 Belgium Molasses? Market - Porter's Five Forces |
3.5 Belgium Molasses? Market Revenues & Volume Share, By Source, 2021 & 2031F |
3.6 Belgium Molasses? Market Revenues & Volume Share, By Type, 2021 & 2031F |
3.7 Belgium Molasses? Market Revenues & Volume Share, By Nature, 2021 & 2031F |
3.8 Belgium Molasses? Market Revenues & Volume Share, By End-Use, 2021 & 2031F |
3.9 Belgium Molasses? Market Revenues & Volume Share, By Sales Channel, 2021 & 2031F |
4 Belgium Molasses? Market Dynamics |
4.1 Impact Analysis |
4.2 Market Drivers |
4.2.1 Increasing demand for natural sweeteners in the food and beverage industry |
4.2.2 Growing awareness about the health benefits of molasses as a natural sweetener and nutritional supplement |
4.2.3 Rising adoption of molasses in animal feed for its nutritional value |
4.3 Market Restraints |
4.3.1 Fluctuations in raw material prices impacting production costs |
4.3.2 Competition from other sweeteners like sugar, honey, and artificial sweeteners |
4.3.3 Regulatory challenges related to quality control and food safety standards |
5 Belgium Molasses? Market Trends |
6 Belgium Molasses? Market Segmentations |
6.1 Belgium Molasses? Market, By Source |
6.1.1 Overview and Analysis |
6.1.2 Belgium Molasses? Market Revenues & Volume, By Sugarcane, 2021-2031F |
6.1.3 Belgium Molasses? Market Revenues & Volume, By Sugarbeet, 2021-2031F |
6.2 Belgium Molasses? Market, By Type |
6.2.1 Overview and Analysis |
6.2.2 Belgium Molasses? Market Revenues & Volume, By Regular Molasses, 2021-2031F |
6.2.3 Belgium Molasses? Market Revenues & Volume, By Blackstrap Molasses, 2021-2031F |
6.3 Belgium Molasses? Market, By Nature |
6.3.1 Overview and Analysis |
6.3.2 Belgium Molasses? Market Revenues & Volume, By Organic, 2021-2031F |
6.3.3 Belgium Molasses? Market Revenues & Volume, By Conventional, 2021-2031F |
6.4 Belgium Molasses? Market, By End-Use |
6.4.1 Overview and Analysis |
6.4.2 Belgium Molasses? Market Revenues & Volume, By Industrial? , 2021-2031F |
6.4.3 Belgium Molasses? Market Revenues & Volume, By Commercial, 2021-2031F |
6.4.4 Belgium Molasses? Market Revenues & Volume, By Household, 2021-2031F |
6.5 Belgium Molasses? Market, By Sales Channel |
6.5.1 Overview and Analysis |
6.5.2 Belgium Molasses? Market Revenues & Volume, By Direct , 2021-2031F |
6.5.3 Belgium Molasses? Market Revenues & Volume, By Indirect, 2021-2031F |
7 Belgium Molasses? Market Import-Export Trade Statistics |
7.1 Belgium Molasses? Market Export to Major Countries |
7.2 Belgium Molasses? Market Imports from Major Countries |
8 Belgium Molasses? Market Key Performance Indicators |
8.1 Average selling price of molasses in the market |
8.2 Number of new product launches containing molasses |
8.3 Percentage increase in molasses consumption in different industries |
9 Belgium Molasses? Market - Opportunity Assessment |
9.1 Belgium Molasses? Market Opportunity Assessment, By Source, 2021 & 2031F |
9.2 Belgium Molasses? Market Opportunity Assessment, By Type, 2021 & 2031F |
9.3 Belgium Molasses? Market Opportunity Assessment, By Nature, 2021 & 2031F |
9.4 Belgium Molasses? Market Opportunity Assessment, By End-Use, 2021 & 2031F |
9.5 Belgium Molasses? Market Opportunity Assessment, By Sales Channel, 2021 & 2031F |
10 Belgium Molasses? Market - Competitive Landscape |
10.1 Belgium Molasses? Market Revenue Share, By Companies, 2024 |
10.2 Belgium Molasses? Market Competitive Benchmarking, By Operating and Technical Parameters |
11 Company Profiles |
12 Recommendations | 13 Disclaimer |
Export potential assessment - trade Analytics for 2030
Export potential enables firms to identify high-growth global markets with greater confidence by combining advanced trade intelligence with a structured quantitative methodology. The framework analyzes emerging demand trends and country-level import patterns while integrating macroeconomic and trade datasets such as GDP and population forecasts, bilateral import–export flows, tariff structures, elasticity differentials between developed and developing economies, geographic distance, and import demand projections. Using weighted trade values from 2020–2024 as the base period to project country-to-country export potential for 2030, these inputs are operationalized through calculated drivers such as gravity model parameters, tariff impact factors, and projected GDP per-capita growth. Through an analysis of hidden potentials, demand hotspots, and market conditions that are most favorable to success, this method enables firms to focus on target countries, maximize returns, and global expansion with data, backed by accuracy.
By factoring in the projected importer demand gap that is currently unmet and could be potential opportunity, it identifies the potential for the Exporter (Country) among 190 countries, against the general trade analysis, which identifies the biggest importer or exporter.
To discover high-growth global markets and optimize your business strategy:
Click Here
Pricing
- Single User License$ 1,995
- Department License$ 2,400
- Site License$ 3,120
- Global License$ 3,795

Search
Thought Leadership and Analyst Meet


Our Clients
Latest Reports
- Taiwan Food Delivery Platform Market (2026-2032) | Companies, Outlook, Analysis, Trends, Value, Revenue, Segmentation, Share, Forecast, Competitive Landscape, Growth, Size & Forecast
- United Kingdom (UK) Long-term Care Insurance Market (2026-2032) | Growth, Share, Consumer Insights, Drivers, Opportunities, Competition, Pricing Analysis, Segments, Restraints, Companies, Competitive, Value, Outlook, Size, Demand, Analysis, Challenges, Strategic Insights, Investment Trends, Revenue, Trends, Supply, Forecast
- United Kingdom (UK) Long Term Care Market (2026-2032) | Companies, Outlook, Analysis, Trends, Value, Revenue, Segmentation, Share, Forecast, Competitive Landscape, Growth, Size & Forecast
- Iraq Insulation and Waterproofing Market (2026-2032) | Outlook, Drivers, Growth, Size, Share, Industry, Revenue, Trends, Demand, Competitive, Strategic Insights, Opportunities, Segments, Companies, Challenges, Strategy, Consumer Insights, Analysis, Investment Trends, Value, Segmentation, Forecast, Restraints
- India Switchgear Market Outlook (2026-2032) | Size, Share, Trends, Growth, Revenue, Forecast, Analysis, Value, Outlook
- Pakistan Contraceptive Implants Market (2025-2031) | Demand, Growth, Size, Share, Industry, Pricing Analysis, Competitive, Strategic Insights, Strategy, Consumer Insights, Analysis, Investment Trends, Opportunities, Revenue, Segments, Value, Segmentation, Supply, Forecast, Restraints, Outlook, Competition, Drivers, Trends, Companies, Challenges
- Sri Lanka Packaging Market (2026-2032) | Outlook, Competition, Drivers, Trends, Demand, Pricing Analysis, Competitive, Strategic Insights, Companies, Challenges, Strategy, Consumer Insights, Analysis, Investment Trends, Opportunities, Growth, Size, Share, Industry, Revenue, Segments, Value, Segmentation, Supply, Forecast, Restraints
- India Kids Watches Market (2026-2032) | Strategy, Consumer Insights, Analysis, Investment Trends, Opportunities, Growth, Size, Share, Industry, Revenue, Segments, Value, Segmentation, Supply, Forecast, Restraints, Outlook, Competition, Drivers, Trends, Demand, Pricing Analysis, Competitive, Strategic Insights, Companies, Challenges
- Saudi Arabia Core Assurance Service Market (2025-2031) | Strategy, Consumer Insights, Analysis, Investment Trends, Opportunities, Growth, Size, Share, Industry, Revenue, Segments, Value, Segmentation, Supply, Forecast, Restraints, Outlook, Competition, Drivers, Trends, Demand, Pricing Analysis, Competitive, Strategic Insights, Companies, Challenges
- Romania Uninterruptible Power Supply (UPS) Market (2026-2032) | Industry, Analysis, Revenue, Size, Forecast, Outlook, Value, Trends, Share, Growth & Companies
Industry Events and Analyst Meet

India EV Show 2026

EV tech India Expo 2026

Auto Tech Asia 2026

Battery Tech India 2026

Smart Production Solutions Guangzhou 2026
Whitepaper
- Middle East & Africa Commercial Security Market Click here to view more.
- Middle East & Africa Fire Safety Systems & Equipment Market Click here to view more.
- GCC Drone Market Click here to view more.
- Middle East Lighting Fixture Market Click here to view more.
- GCC Physical & Perimeter Security Market Click here to view more.
6WResearch In News
- Doha a strategic location for EV manufacturing hub: IPA Qatar
- Demand for luxury TVs surging in the GCC, says Samsung
- Empowering Growth: The Thriving Journey of Bangladesh’s Cable Industry
- Demand for luxury TVs surging in the GCC, says Samsung
- Video call with a traditional healer? Once unthinkable, it’s now common in South Africa
- Intelligent Buildings To Smooth GCC’s Path To Net Zero