Belgium Regional Jet Market (2026-2032) | Growth, Pricing Analysis, Value, Industry, Strategy, Competition, Demand, Size, Restraints, Consumer Insights, Opportunities, Supply, Segmentation, Analysis, Outlook, Companies, Investment Trends, Challenges, Forecast, Competitive, Revenue, Share, Strategic Insights, Trends, Drivers, Segments
Market Forecast By Type (Small Regional Jets, Medium Regional Jets, Large Regional Jets, Hybrid Regional Jets, Electric Regional Jets), By Seating Capacity (30-50 Seats, 50-100 Seats, 100-150 Seats, 50-80 Seats, 20-50 Seats), By Range (Short-Haul, Medium-Range, Long-Haul, Eco-Friendly, Zero Emission), By End-Use (Regional Airlines, Low-Cost Carriers, Major Airlines, Sustainable Aviation, Urban Air Mobility) And Competitive Landscape
| Product Code: ETC10414786 | Publication Date: Apr 2025 | Updated Date: Apr 2026 | Product Type: Market Research Report | |
| Publisher: 6Wresearch | Author: Bhawna Singh | No. of Pages: 65 | No. of Figures: 34 | No. of Tables: 19 |
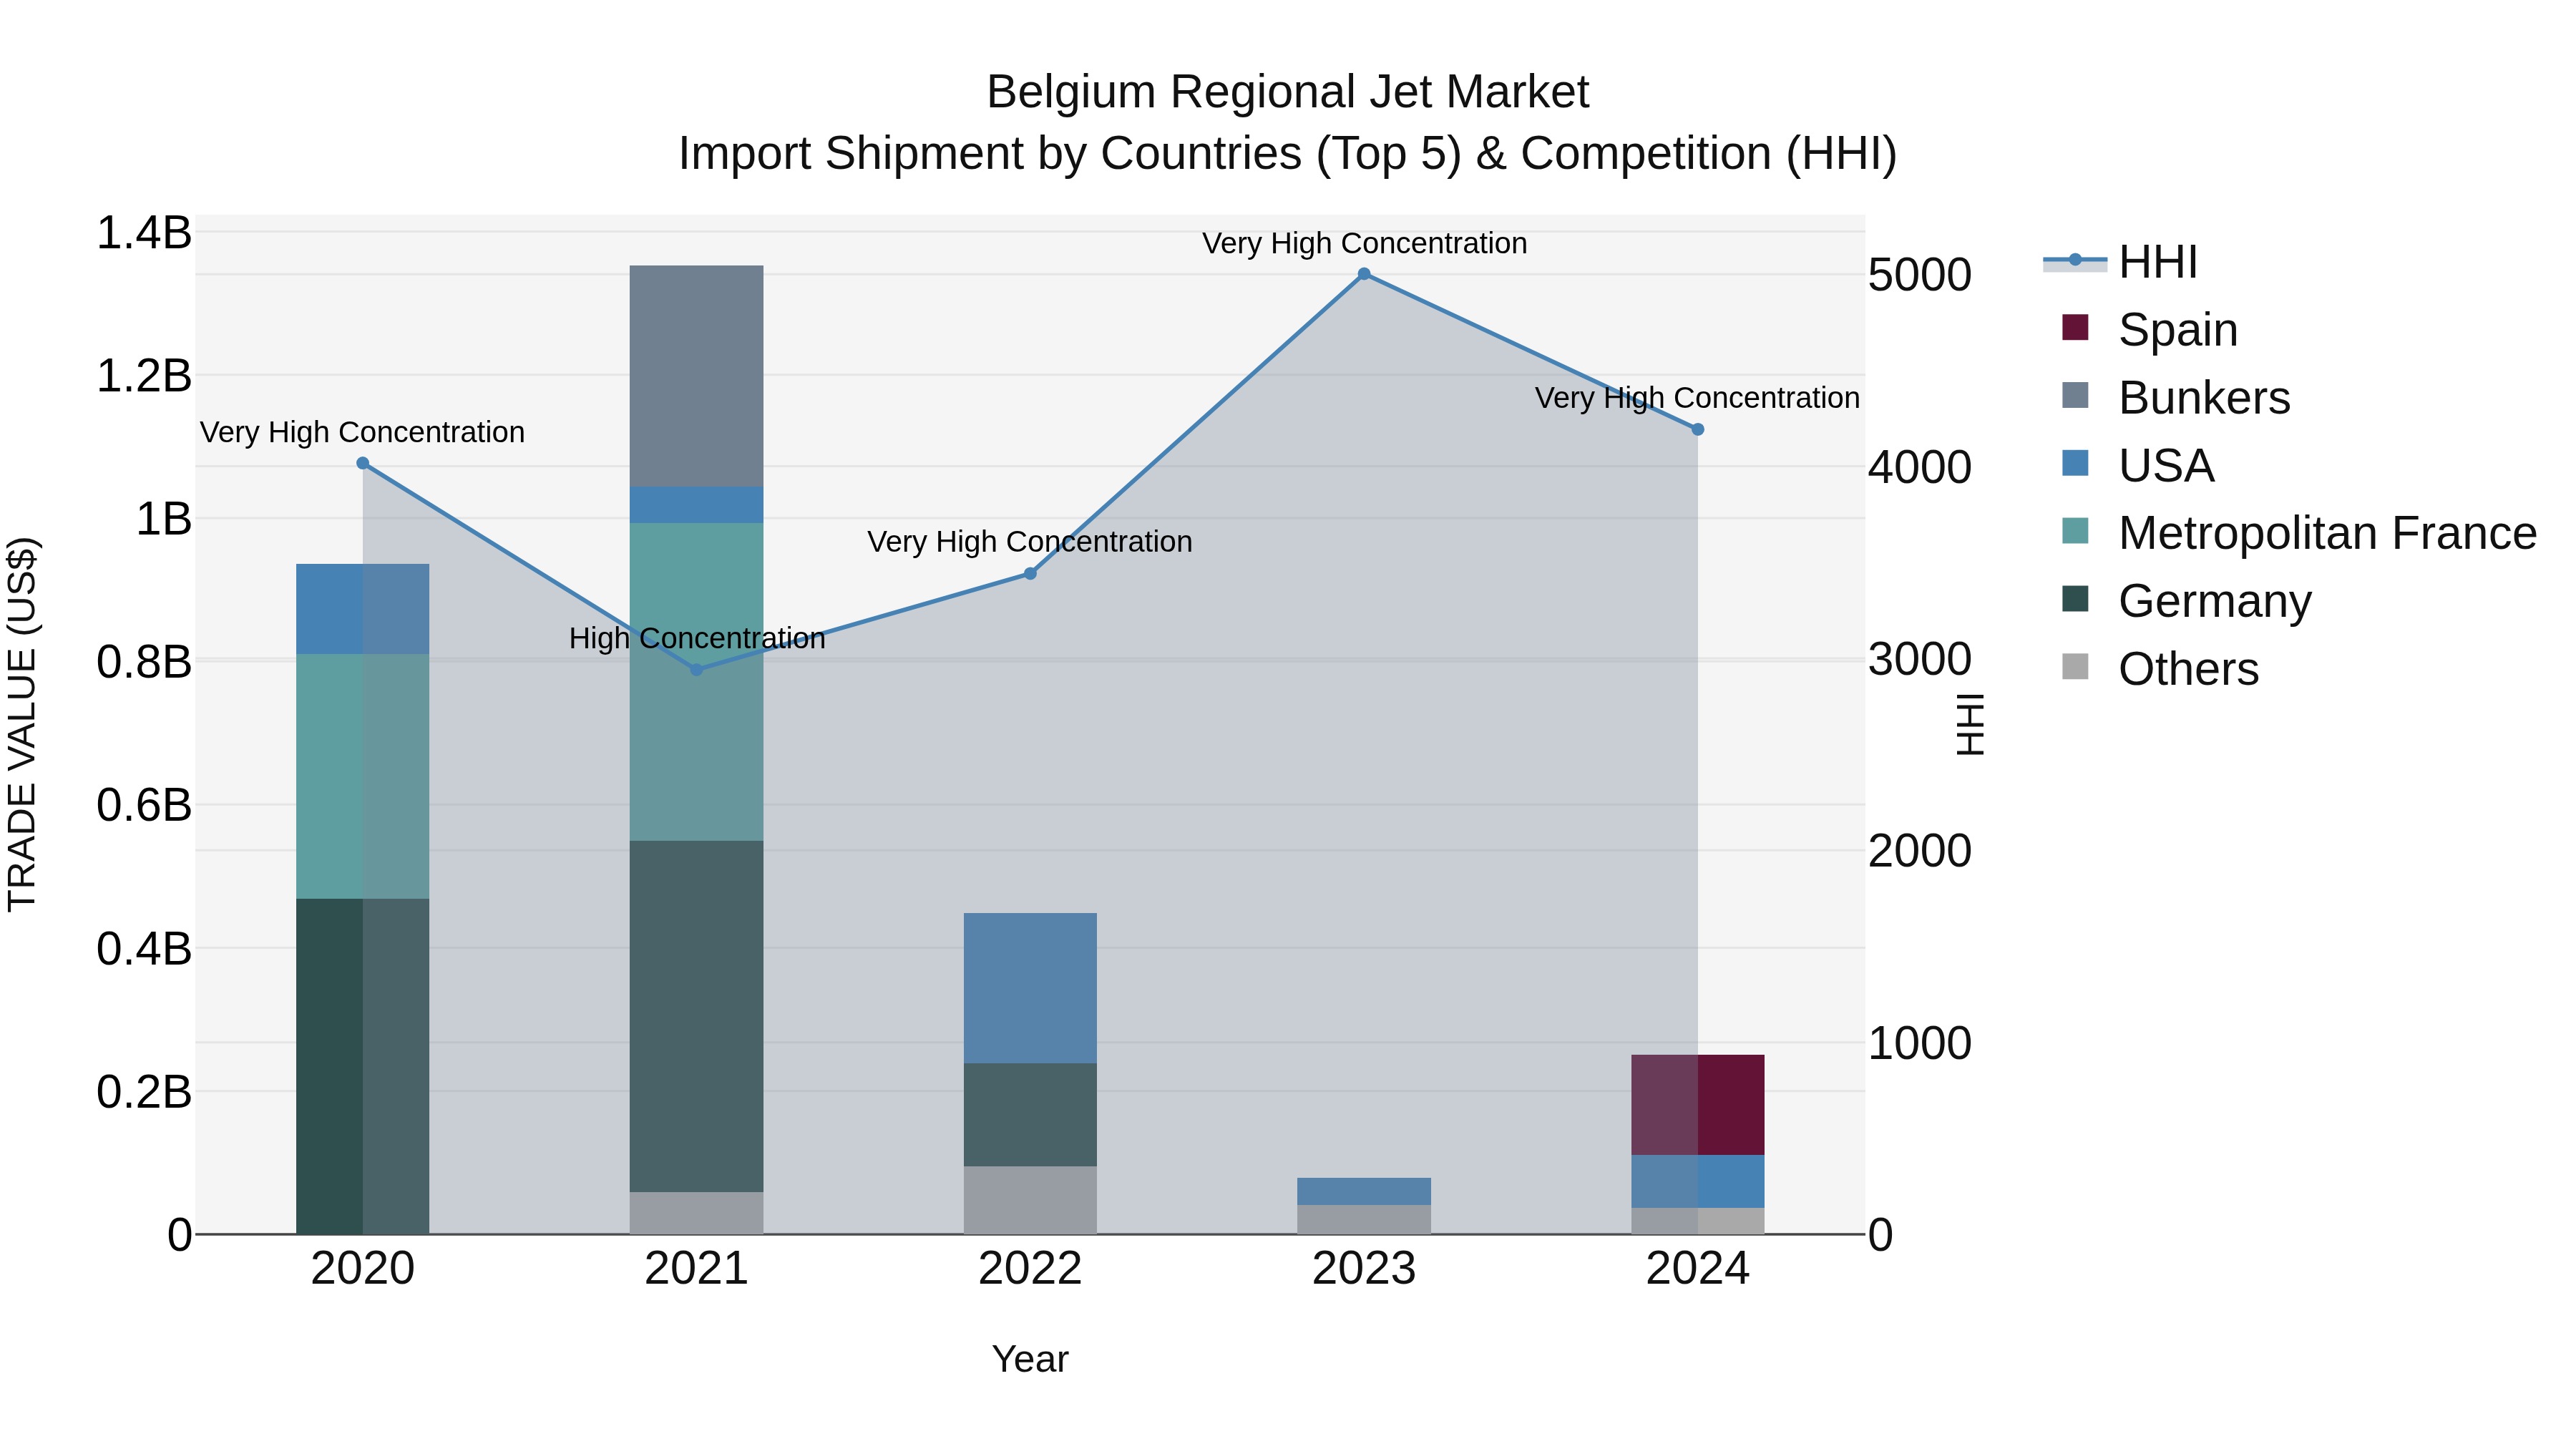
Belgium Regional Jet Market Top 5 Importing Countries and Market Competition (HHI) Analysis
In 2024, Belgium saw a significant increase in regional jet import shipments, with top exporting countries being Spain, USA, Israel, Bunkers, and the Democratic Republic of the Congo. Despite the high Herfindahl-Hirschman Index indicating market concentration, the industry experienced a notable growth rate of 216.39% from 2023 to 2024. However, the compound annual growth rate (CAGR) for the period 2020-2024 was -28.07%, suggesting fluctuations in the market. This data highlights the dynamic nature of the regional jet import market in Belgium, with potential opportunities for further analysis and strategic planning.
Key Highlights of the Report:
- Belgium Regional Jet Market Outlook
- Market Size of Belgium Regional Jet Market, 2025
- Forecast of Belgium Regional Jet Market, 2032
- Historical Data and Forecast of Belgium Regional Jet Revenues & Volume for the Period 2022 - 2032F
- Belgium Regional Jet Market Trend Evolution
- Belgium Regional Jet Market Drivers and Challenges
- Belgium Regional Jet Price Trends
- Belgium Regional Jet Porter's Five Forces
- Belgium Regional Jet Industry Life Cycle
- Historical Data and Forecast of Belgium Regional Jet Market Revenues & Volume By Type for the Period 2022 - 2032F
- Historical Data and Forecast of Belgium Regional Jet Market Revenues & Volume By Small Regional Jets for the Period 2022 - 2032F
- Historical Data and Forecast of Belgium Regional Jet Market Revenues & Volume By Medium Regional Jets for the Period 2022 - 2032F
- Historical Data and Forecast of Belgium Regional Jet Market Revenues & Volume By Large Regional Jets for the Period 2022 - 2032F
- Historical Data and Forecast of Belgium Regional Jet Market Revenues & Volume By Hybrid Regional Jets for the Period 2022 - 2032F
- Historical Data and Forecast of Belgium Regional Jet Market Revenues & Volume By Electric Regional Jets for the Period 2022 - 2032F
- Historical Data and Forecast of Belgium Regional Jet Market Revenues & Volume By Seating Capacity for the Period 2022 - 2032F
- Historical Data and Forecast of Belgium Regional Jet Market Revenues & Volume By 30-50 Seats for the Period 2022 - 2032F
- Historical Data and Forecast of Belgium Regional Jet Market Revenues & Volume By 50-100 Seats for the Period 2022 - 2032F
- Historical Data and Forecast of Belgium Regional Jet Market Revenues & Volume By 100-150 Seats for the Period 2022 - 2032F
- Historical Data and Forecast of Belgium Regional Jet Market Revenues & Volume By 50-80 Seats for the Period 2022 - 2032F
- Historical Data and Forecast of Belgium Regional Jet Market Revenues & Volume By 20-50 Seats for the Period 2022 - 2032F
- Historical Data and Forecast of Belgium Regional Jet Market Revenues & Volume By Range for the Period 2022 - 2032F
- Historical Data and Forecast of Belgium Regional Jet Market Revenues & Volume By Short-Haul for the Period 2022 - 2032F
- Historical Data and Forecast of Belgium Regional Jet Market Revenues & Volume By Medium-Range for the Period 2022 - 2032F
- Historical Data and Forecast of Belgium Regional Jet Market Revenues & Volume By Long-Haul for the Period 2022 - 2032F
- Historical Data and Forecast of Belgium Regional Jet Market Revenues & Volume By Eco-Friendly for the Period 2022 - 2032F
- Historical Data and Forecast of Belgium Regional Jet Market Revenues & Volume By Zero Emission for the Period 2022 - 2032F
- Historical Data and Forecast of Belgium Regional Jet Market Revenues & Volume By End-Use for the Period 2022 - 2032F
- Historical Data and Forecast of Belgium Regional Jet Market Revenues & Volume By Regional Airlines for the Period 2022 - 2032F
- Historical Data and Forecast of Belgium Regional Jet Market Revenues & Volume By Low-Cost Carriers for the Period 2022 - 2032F
- Historical Data and Forecast of Belgium Regional Jet Market Revenues & Volume By Major Airlines for the Period 2022 - 2032F
- Historical Data and Forecast of Belgium Regional Jet Market Revenues & Volume By Sustainable Aviation for the Period 2022 - 2032F
- Historical Data and Forecast of Belgium Regional Jet Market Revenues & Volume By Urban Air Mobility for the Period 2022 - 2032F
- Belgium Regional Jet Import Export Trade Statistics
- Market Opportunity Assessment By Type
- Market Opportunity Assessment By Seating Capacity
- Market Opportunity Assessment By Range
- Market Opportunity Assessment By End-Use
- Belgium Regional Jet Top Companies Market Share
- Belgium Regional Jet Competitive Benchmarking By Technical and Operational Parameters
- Belgium Regional Jet Company Profiles
- Belgium Regional Jet Key Strategic Recommendations
Frequently Asked Questions About the Market Study (FAQs):
6Wresearch actively monitors the Belgium Regional Jet Market and publishes its comprehensive annual report, highlighting emerging trends, growth drivers, revenue analysis, and forecast outlook. Our insights help businesses to make data-backed strategic decisions with ongoing market dynamics. Our analysts track relevent industries related to the Belgium Regional Jet Market, allowing our clients with actionable intelligence and reliable forecasts tailored to emerging regional needs.
Yes, we provide customisation as per your requirements. To learn more, feel free to contact us on sales@6wresearch.com
1 Executive Summary |
2 Introduction |
2.1 Key Highlights of the Report |
2.2 Report Description |
2.3 Market Scope & Segmentation |
2.4 Research Methodology |
2.5 Assumptions |
3 Belgium Regional Jet Market Overview |
3.1 Belgium Country Macro Economic Indicators |
3.2 Belgium Regional Jet Market Revenues & Volume, 2022 & 2032F |
3.3 Belgium Regional Jet Market - Industry Life Cycle |
3.4 Belgium Regional Jet Market - Porter's Five Forces |
3.5 Belgium Regional Jet Market Revenues & Volume Share, By Type, 2022 & 2032F |
3.6 Belgium Regional Jet Market Revenues & Volume Share, By Seating Capacity, 2022 & 2032F |
3.7 Belgium Regional Jet Market Revenues & Volume Share, By Range, 2022 & 2032F |
3.8 Belgium Regional Jet Market Revenues & Volume Share, By End-Use, 2022 & 2032F |
4 Belgium Regional Jet Market Dynamics |
4.1 Impact Analysis |
4.2 Market Drivers |
4.2.1 Increasing demand for regional air travel in Belgium due to growing connectivity and economic development |
4.2.2 Technological advancements in regional jet manufacturing leading to more fuel-efficient and cost-effective aircraft |
4.2.3 Government initiatives and investments in regional aviation infrastructure to support regional jet market growth |
4.3 Market Restraints |
4.3.1 Fluctuating fuel prices impacting operational costs of regional jet operators |
4.3.2 Regulatory challenges and environmental concerns affecting the sustainability of regional jet operations |
5 Belgium Regional Jet Market Trends |
6 Belgium Regional Jet Market, By Types |
6.1 Belgium Regional Jet Market, By Type |
6.1.1 Overview and Analysis |
6.1.2 Belgium Regional Jet Market Revenues & Volume, By Type, 2022 - 2032F |
6.1.3 Belgium Regional Jet Market Revenues & Volume, By Small Regional Jets, 2022 - 2032F |
6.1.4 Belgium Regional Jet Market Revenues & Volume, By Medium Regional Jets, 2022 - 2032F |
6.1.5 Belgium Regional Jet Market Revenues & Volume, By Large Regional Jets, 2022 - 2032F |
6.1.6 Belgium Regional Jet Market Revenues & Volume, By Hybrid Regional Jets, 2022 - 2032F |
6.1.7 Belgium Regional Jet Market Revenues & Volume, By Electric Regional Jets, 2022 - 2032F |
6.2 Belgium Regional Jet Market, By Seating Capacity |
6.2.1 Overview and Analysis |
6.2.2 Belgium Regional Jet Market Revenues & Volume, By 30-50 Seats, 2022 - 2032F |
6.2.3 Belgium Regional Jet Market Revenues & Volume, By 50-100 Seats, 2022 - 2032F |
6.2.4 Belgium Regional Jet Market Revenues & Volume, By 100-150 Seats, 2022 - 2032F |
6.2.5 Belgium Regional Jet Market Revenues & Volume, By 50-80 Seats, 2022 - 2032F |
6.2.6 Belgium Regional Jet Market Revenues & Volume, By 20-50 Seats, 2022 - 2032F |
6.3 Belgium Regional Jet Market, By Range |
6.3.1 Overview and Analysis |
6.3.2 Belgium Regional Jet Market Revenues & Volume, By Short-Haul, 2022 - 2032F |
6.3.3 Belgium Regional Jet Market Revenues & Volume, By Medium-Range, 2022 - 2032F |
6.3.4 Belgium Regional Jet Market Revenues & Volume, By Long-Haul, 2022 - 2032F |
6.3.5 Belgium Regional Jet Market Revenues & Volume, By Eco-Friendly, 2022 - 2032F |
6.3.6 Belgium Regional Jet Market Revenues & Volume, By Zero Emission, 2022 - 2032F |
6.4 Belgium Regional Jet Market, By End-Use |
6.4.1 Overview and Analysis |
6.4.2 Belgium Regional Jet Market Revenues & Volume, By Regional Airlines, 2022 - 2032F |
6.4.3 Belgium Regional Jet Market Revenues & Volume, By Low-Cost Carriers, 2022 - 2032F |
6.4.4 Belgium Regional Jet Market Revenues & Volume, By Major Airlines, 2022 - 2032F |
6.4.5 Belgium Regional Jet Market Revenues & Volume, By Sustainable Aviation, 2022 - 2032F |
6.4.6 Belgium Regional Jet Market Revenues & Volume, By Urban Air Mobility, 2022 - 2032F |
7 Belgium Regional Jet Market Import-Export Trade Statistics |
7.1 Belgium Regional Jet Market Export to Major Countries |
7.2 Belgium Regional Jet Market Imports from Major Countries |
8 Belgium Regional Jet Market Key Performance Indicators |
8.1 Average aircraft utilization rate |
8.2 On-time performance of regional jet flights |
8.3 Load factor (percentage of seats filled on regional jet flights) |
8.4 Average ticket prices for regional jet routes |
8.5 Maintenance cost per flight hour for regional jets |
9 Belgium Regional Jet Market - Opportunity Assessment |
9.1 Belgium Regional Jet Market Opportunity Assessment, By Type, 2022 & 2032F |
9.2 Belgium Regional Jet Market Opportunity Assessment, By Seating Capacity, 2022 & 2032F |
9.3 Belgium Regional Jet Market Opportunity Assessment, By Range, 2022 & 2032F |
9.4 Belgium Regional Jet Market Opportunity Assessment, By End-Use, 2022 & 2032F |
10 Belgium Regional Jet Market - Competitive Landscape |
10.1 Belgium Regional Jet Market Revenue Share, By Companies, 2025 |
10.2 Belgium Regional Jet Market Competitive Benchmarking, By Operating and Technical Parameters |
11 Company Profiles |
12 Recommendations |
13 Disclaimer |
Export potential assessment - trade Analytics for 2030
Export potential enables firms to identify high-growth global markets with greater confidence by combining advanced trade intelligence with a structured quantitative methodology. The framework analyzes emerging demand trends and country-level import patterns while integrating macroeconomic and trade datasets such as GDP and population forecasts, bilateral import–export flows, tariff structures, elasticity differentials between developed and developing economies, geographic distance, and import demand projections. Using weighted trade values from 2020–2024 as the base period to project country-to-country export potential for 2030, these inputs are operationalized through calculated drivers such as gravity model parameters, tariff impact factors, and projected GDP per-capita growth. Through an analysis of hidden potentials, demand hotspots, and market conditions that are most favorable to success, this method enables firms to focus on target countries, maximize returns, and global expansion with data, backed by accuracy.
By factoring in the projected importer demand gap that is currently unmet and could be potential opportunity, it identifies the potential for the Exporter (Country) among 190 countries, against the general trade analysis, which identifies the biggest importer or exporter.
To discover high-growth global markets and optimize your business strategy:
Click Here
Pricing
- Single User License$ 1,995
- Department License$ 2,400
- Site License$ 3,120
- Global License$ 3,795

Search
Thought Leadership and Analyst Meet


Our Clients
Latest Reports
- China Electric Appliance Rental Market (2026-2032) | Trends, Revenue, Growth, Challenges, Size, Value, Outlook, Pricing, Strategy, Insights, Restraints, segmentation, Companies, Investment Opportunities, Analysis, Demand, Drivers, Competition, Forecast, Share
- Chile Electric Appliance Rental Market (2026-2032) | Outlook, Competition, Drivers, Strategy, Revenue, Analysis, Value, Pricing, Restraints, Size, Demand, Share, Growth, Forecast, Challenges, Insights, Investment Opportunities, Companies, Trends, segmentation
- Cambodia Electric Appliance Rental Market (2026-2032) | Companies, Analysis, Restraints, Pricing, Insights, Challenges, Outlook, Strategy, Forecast, Trends, Competition, Value, Revenue, Investment Opportunities, segmentation, Drivers, Size, Demand, Growth, Share
- Brazil Electric Appliance Rental Market (2026-2032) | Revenue, Strategy, Forecast, Companies, segmentation, Competition, Size, Investment Opportunities, Pricing, Restraints, Outlook, Challenges, Analysis, Drivers, Value, Demand, Insights, Trends, Growth, Share
- Bangladesh Electric Appliance Rental Market (2026-2032) | Drivers, Forecast, Investment Opportunities, Strategy, Insights, Demand, Challenges, Outlook, Trends, Competition, Value, Revenue, Size, Pricing, Analysis, Companies, Restraints, segmentation, Share, Growth
- Bahrain Electric Appliance Rental Market (2026-2032) | Outlook, Size, Competition, Restraints, Drivers, Value, Trends, Investment Opportunities, Insights, Forecast, Revenue, Strategy, Growth, Share, Demand, Analysis, Challenges, Companies, segmentation, Pricing
- Azerbaijan Electric Appliance Rental Market (2026-2032) | Trends, Investment Opportunities, Restraints, Insights, Strategy, Competition, Value, Growth, Demand, Drivers, Analysis, Forecast, Size, Share, Outlook, segmentation, Pricing, Challenges, Revenue, Companies
- Australia Electric Appliance Rental Market (2026-2032) | Challenges, Restraints, Forecast, Demand, Size, Competition, Pricing, Investment Opportunities, Revenue, Trends, Drivers, Growth, Outlook, Analysis, Strategy, Value, segmentation, Insights, Companies, Share
- Argentina Electric Appliance Rental Market (2026-2032) | Growth, Trends, Insights, Outlook, Forecast, Size, Drivers, Analysis, Restraints, Challenges, Share, Revenue, Investment Opportunities, Strategy, Demand, Value, Companies, segmentation, Competition, Pricing
- Algeria Electric Appliance Rental Market (2026-2032) | Share, Size, Value, Strategy, Competition, Outlook, Challenges, Companies, Trends, Pricing, Insights, Forecast, Investment Opportunities, Revenue, Growth, Restraints, segmentation, Analysis, Demand, Drivers
Industry Events and Analyst Meet

HIMTEX 2026

India Refining Summit 2026

India EV Show 2026

EV tech India Expo 2026

Auto Tech Asia 2026
Whitepaper
- Middle East & Africa Commercial Security Market Click here to view more.
- Middle East & Africa Fire Safety Systems & Equipment Market Click here to view more.
- GCC Drone Market Click here to view more.
- Middle East Lighting Fixture Market Click here to view more.
- GCC Physical & Perimeter Security Market Click here to view more.
6WResearch In News
- Doha a strategic location for EV manufacturing hub: IPA Qatar
- Demand for luxury TVs surging in the GCC, says Samsung
- Empowering Growth: The Thriving Journey of Bangladesh’s Cable Industry
- Demand for luxury TVs surging in the GCC, says Samsung
- Video call with a traditional healer? Once unthinkable, it’s now common in South Africa
- Intelligent Buildings To Smooth GCC’s Path To Net Zero