Belgium Technical Glass Market (2026-2032) | Share, Restraints, Segmentation, Companies, Trends, Demand, Growth, Supply, Outlook, Challenges, Competitive, Revenue, Size, Analysis, Strategic Insights, Drivers, Competition, Consumer Insights, Investment Trends, Opportunities, Value, Industry, Pricing Analysis, Forecast, Segments, Strategy
Market Forecast By Product Type (Borosilicate Glass, Aluminosilicate Glass, Fused Quartz), By Material Type (SilicaBased, MetalOxide Based, Pure Silica), By Application (Optical Lenses, Display Screens, Laboratory Equipment), By Property (High Heat Resistance, Scratch Resistance, Chemical Stability), By End Use (Electronics, Automotive, Healthcare) And Competitive Landscape
| Product Code: ETC10903426 | Publication Date: Apr 2025 | Updated Date: Apr 2026 | Product Type: Market Research Report | |
| Publisher: 6Wresearch | No. of Pages: 65 | No. of Figures: 34 | No. of Tables: 19 | |
Belgium Technical Glass Market - Import Trends (2019-2025)
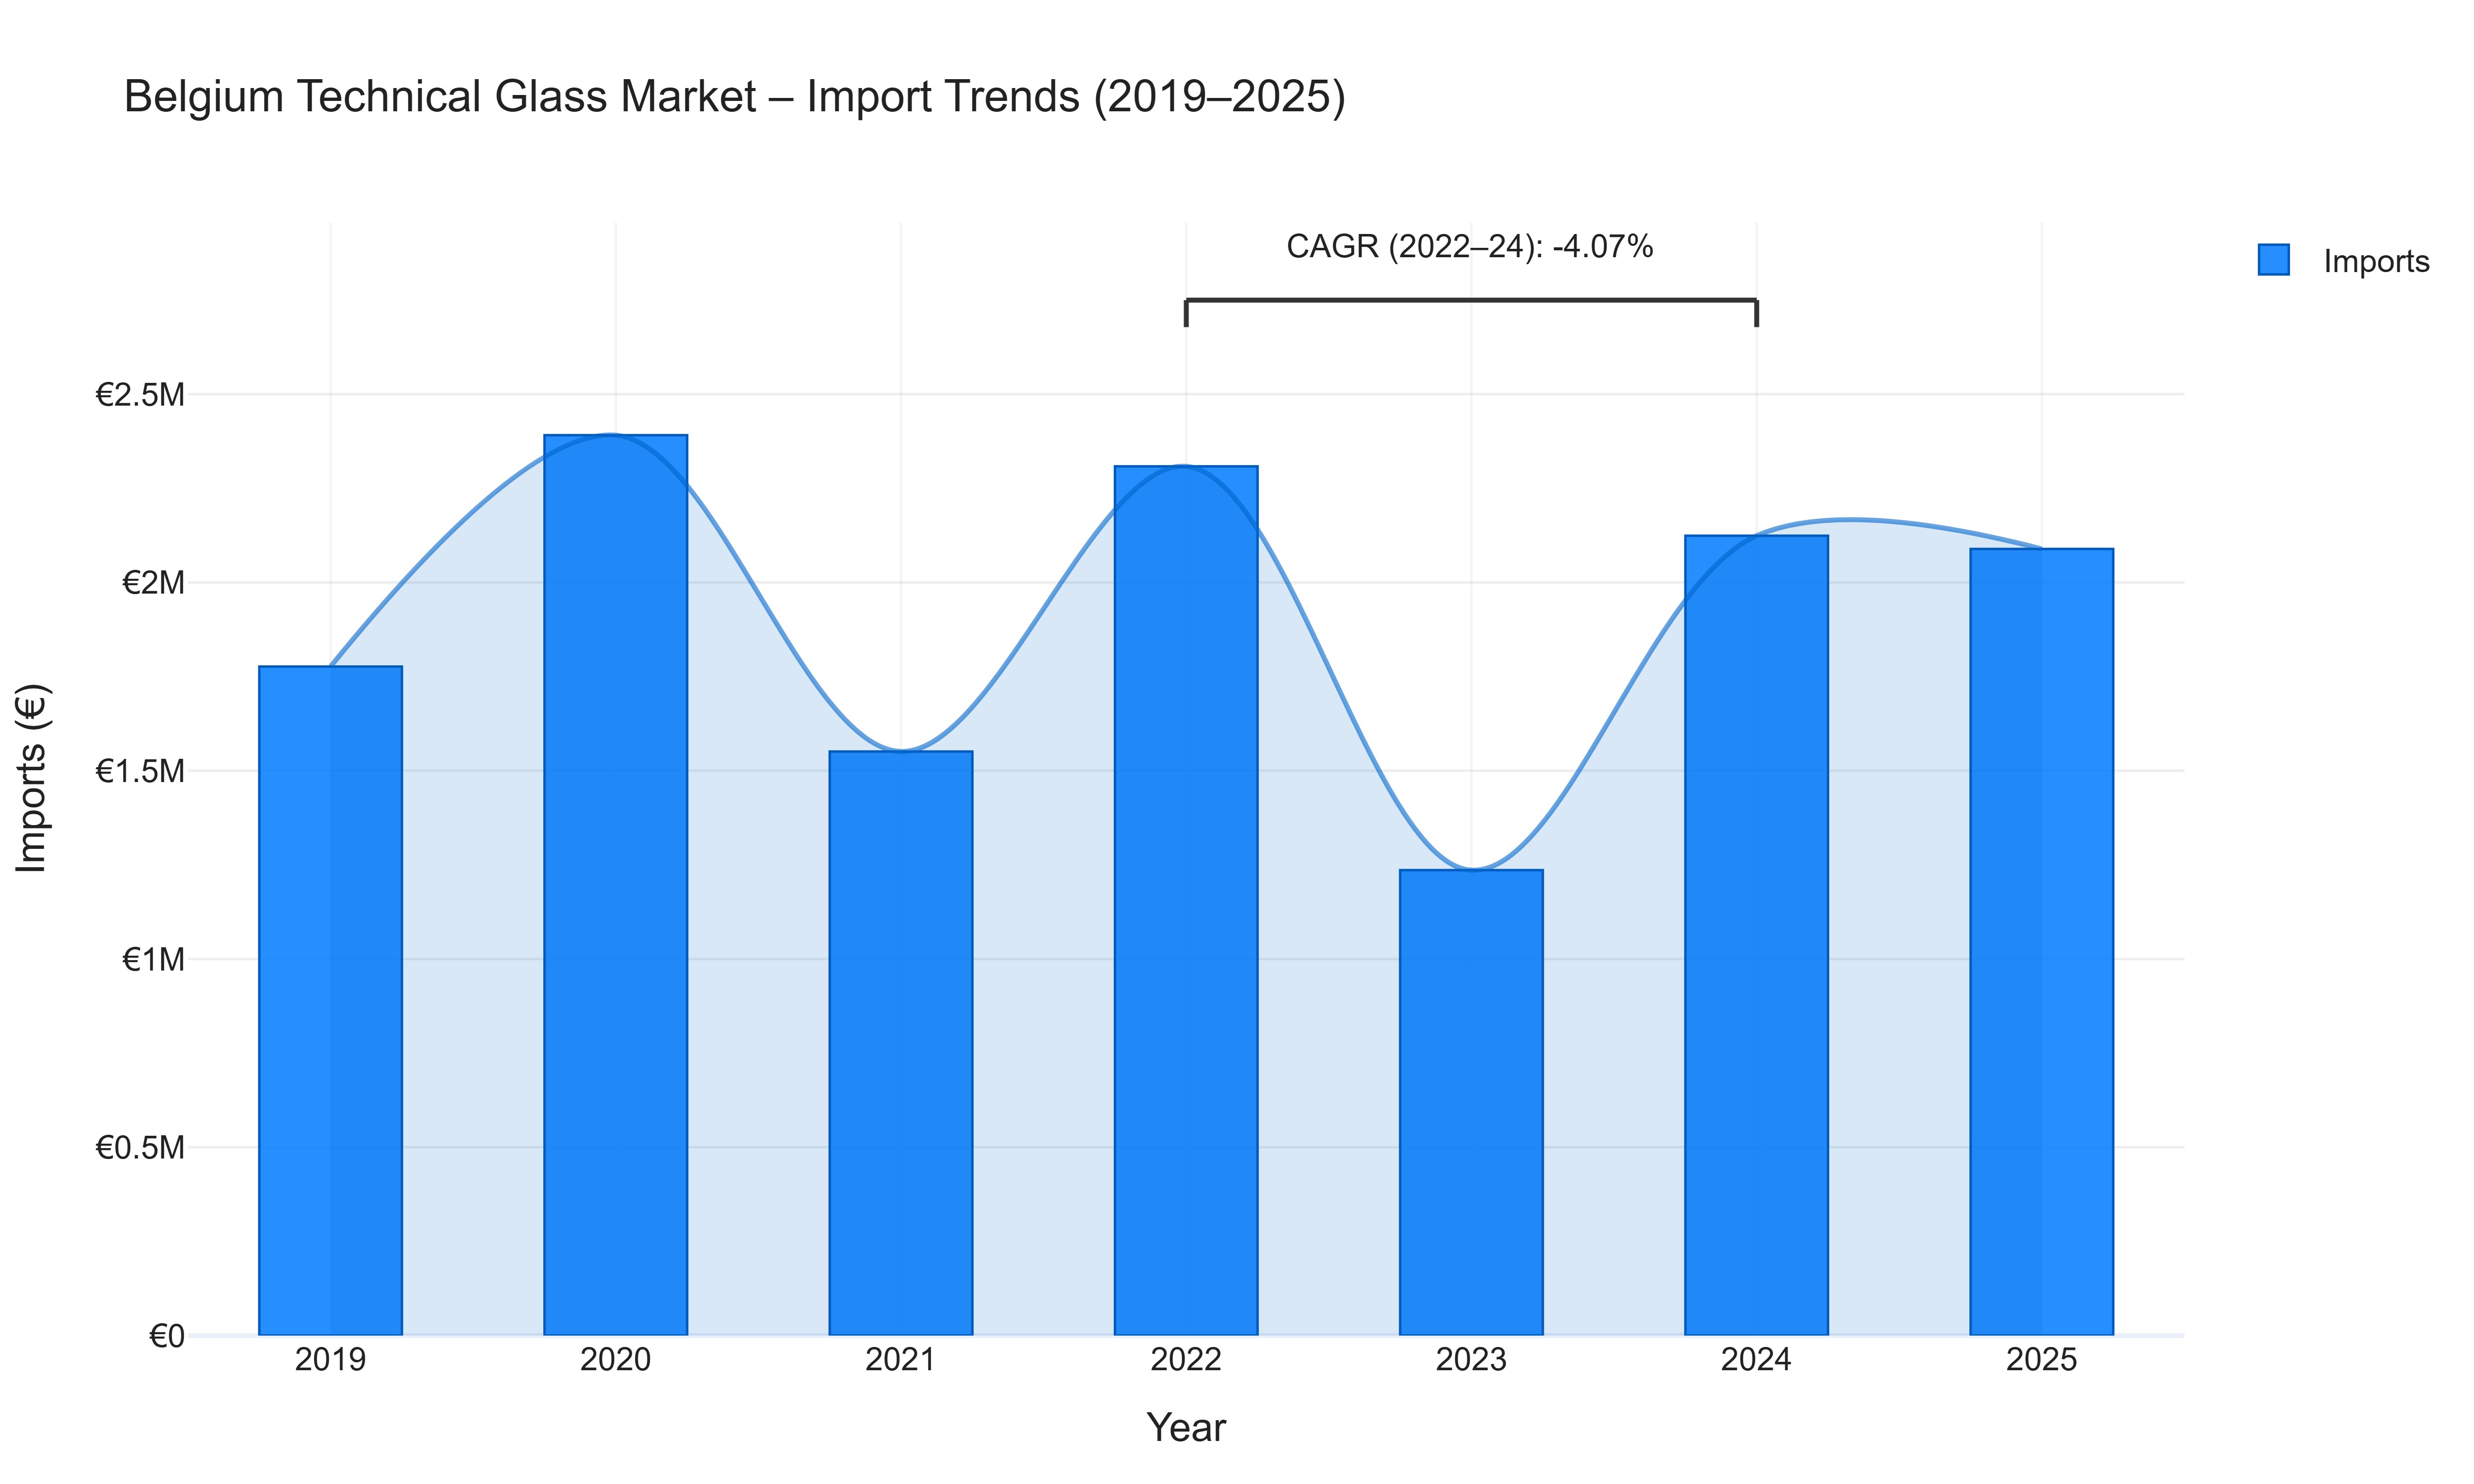
In the Belgium Technical Glass Market, Import Values displayed significant fluctuations over the years. Noteworthy peaks in import activity were observed in 2020 (€2.39 million) and 2024 (€2.12 million). These peaks were likely influenced by increased demand for technical glass products, possibly driven by advancements in technology and infrastructure projects. Conversely, 2021 and 2023 saw sharp declines in imports, possibly due to supply chain disruptions or economic uncertainties impacting purchasing decisions. The Compound Annual Growth Rate (CAGR) of -4.07% from 2022 to 2024 indicates a slight overall decline in import values during this period, reflecting a challenging market environment or shifting preferences towards domestic production. Despite fluctuations, the market continues to showcase resilience and potential for growth in the technical glass import sector.
Key Highlights of the Report:
- Belgium Technical Glass Market Outlook
- Market Size of Belgium Technical Glass Market, 2025
- Forecast of Belgium Technical Glass Market, 2032
- Historical Data and Forecast of Belgium Technical Glass Revenues & Volume for the Period 2022 - 2032F
- Belgium Technical Glass Market Trend Evolution
- Belgium Technical Glass Market Drivers and Challenges
- Belgium Technical Glass Price Trends
- Belgium Technical Glass Porter's Five Forces
- Belgium Technical Glass Industry Life Cycle
- Historical Data and Forecast of Belgium Technical Glass Market Revenues & Volume By Product Type for the Period 2022 - 2032F
- Historical Data and Forecast of Belgium Technical Glass Market Revenues & Volume By Borosilicate Glass for the Period 2022 - 2032F
- Historical Data and Forecast of Belgium Technical Glass Market Revenues & Volume By Aluminosilicate Glass for the Period 2022 - 2032F
- Historical Data and Forecast of Belgium Technical Glass Market Revenues & Volume By Fused Quartz for the Period 2022 - 2032F
- Historical Data and Forecast of Belgium Technical Glass Market Revenues & Volume By Material Type for the Period 2022 - 2032F
- Historical Data and Forecast of Belgium Technical Glass Market Revenues & Volume By SilicaBased for the Period 2022 - 2032F
- Historical Data and Forecast of Belgium Technical Glass Market Revenues & Volume By MetalOxide Based for the Period 2022 - 2032F
- Historical Data and Forecast of Belgium Technical Glass Market Revenues & Volume By Pure Silica for the Period 2022 - 2032F
- Historical Data and Forecast of Belgium Technical Glass Market Revenues & Volume By Application for the Period 2022 - 2032F
- Historical Data and Forecast of Belgium Technical Glass Market Revenues & Volume By Optical Lenses for the Period 2022 - 2032F
- Historical Data and Forecast of Belgium Technical Glass Market Revenues & Volume By Display Screens for the Period 2022 - 2032F
- Historical Data and Forecast of Belgium Technical Glass Market Revenues & Volume By Laboratory Equipment for the Period 2022 - 2032F
- Historical Data and Forecast of Belgium Technical Glass Market Revenues & Volume By Property for the Period 2022 - 2032F
- Historical Data and Forecast of Belgium Technical Glass Market Revenues & Volume By High Heat Resistance for the Period 2022 - 2032F
- Historical Data and Forecast of Belgium Technical Glass Market Revenues & Volume By Scratch Resistance for the Period 2022 - 2032F
- Historical Data and Forecast of Belgium Technical Glass Market Revenues & Volume By Chemical Stability for the Period 2022 - 2032F
- Historical Data and Forecast of Belgium Technical Glass Market Revenues & Volume By End Use for the Period 2022 - 2032F
- Historical Data and Forecast of Belgium Technical Glass Market Revenues & Volume By Electronics for the Period 2022 - 2032F
- Historical Data and Forecast of Belgium Technical Glass Market Revenues & Volume By Automotive for the Period 2022 - 2032F
- Historical Data and Forecast of Belgium Technical Glass Market Revenues & Volume By Healthcare for the Period 2022 - 2032F
- Belgium Technical Glass Import Export Trade Statistics
- Market Opportunity Assessment By Product Type
- Market Opportunity Assessment By Material Type
- Market Opportunity Assessment By Application
- Market Opportunity Assessment By Property
- Market Opportunity Assessment By End Use
- Belgium Technical Glass Top Companies Market Share
- Belgium Technical Glass Competitive Benchmarking By Technical and Operational Parameters
- Belgium Technical Glass Company Profiles
- Belgium Technical Glass Key Strategic Recommendations
Frequently Asked Questions About the Market Study (FAQs):
6Wresearch actively monitors the Belgium Technical Glass Market and publishes its comprehensive annual report, highlighting emerging trends, growth drivers, revenue analysis, and forecast outlook. Our insights help businesses to make data-backed strategic decisions with ongoing market dynamics. Our analysts track relevent industries related to the Belgium Technical Glass Market, allowing our clients with actionable intelligence and reliable forecasts tailored to emerging regional needs.
Yes, we provide customisation as per your requirements. To learn more, feel free to contact us on sales@6wresearch.com
1 Executive Summary |
2 Introduction |
2.1 Key Highlights of the Report |
2.2 Report Description |
2.3 Market Scope & Segmentation |
2.4 Research Methodology |
2.5 Assumptions |
3 Belgium Technical Glass Market Overview |
3.1 Belgium Country Macro Economic Indicators |
3.2 Belgium Technical Glass Market Revenues & Volume, 2022 & 2032F |
3.3 Belgium Technical Glass Market - Industry Life Cycle |
3.4 Belgium Technical Glass Market - Porter's Five Forces |
3.5 Belgium Technical Glass Market Revenues & Volume Share, By Product Type, 2022 & 2032F |
3.6 Belgium Technical Glass Market Revenues & Volume Share, By Material Type, 2022 & 2032F |
3.7 Belgium Technical Glass Market Revenues & Volume Share, By Application, 2022 & 2032F |
3.8 Belgium Technical Glass Market Revenues & Volume Share, By Property, 2022 & 2032F |
3.9 Belgium Technical Glass Market Revenues & Volume Share, By End Use, 2022 & 2032F |
4 Belgium Technical Glass Market Dynamics |
4.1 Impact Analysis |
4.2 Market Drivers |
4.2.1 Increasing demand for energy-efficient buildings and infrastructure, driving the adoption of technical glass for insulation and sustainability purposes. |
4.2.2 Growing focus on aesthetics and design in architecture, leading to higher demand for specialized technical glass products. |
4.2.3 Government regulations promoting the use of sustainable materials, including technical glass, in construction projects. |
4.3 Market Restraints |
4.3.1 High production costs associated with technical glass manufacturing, limiting market growth. |
4.3.2 Fluctuating raw material prices impacting the overall cost of technical glass products. |
4.3.3 Intense competition from alternative materials, such as plastics and composites, posing a challenge to the market growth. |
5 Belgium Technical Glass Market Trends |
6 Belgium Technical Glass Market, By Types |
6.1 Belgium Technical Glass Market, By Product Type |
6.1.1 Overview and Analysis |
6.1.2 Belgium Technical Glass Market Revenues & Volume, By Product Type, 2022 - 2032F |
6.1.3 Belgium Technical Glass Market Revenues & Volume, By Borosilicate Glass, 2022 - 2032F |
6.1.4 Belgium Technical Glass Market Revenues & Volume, By Aluminosilicate Glass, 2022 - 2032F |
6.1.5 Belgium Technical Glass Market Revenues & Volume, By Fused Quartz, 2022 - 2032F |
6.2 Belgium Technical Glass Market, By Material Type |
6.2.1 Overview and Analysis |
6.2.2 Belgium Technical Glass Market Revenues & Volume, By SilicaBased, 2022 - 2032F |
6.2.3 Belgium Technical Glass Market Revenues & Volume, By MetalOxide Based, 2022 - 2032F |
6.2.4 Belgium Technical Glass Market Revenues & Volume, By Pure Silica, 2022 - 2032F |
6.3 Belgium Technical Glass Market, By Application |
6.3.1 Overview and Analysis |
6.3.2 Belgium Technical Glass Market Revenues & Volume, By Optical Lenses, 2022 - 2032F |
6.3.3 Belgium Technical Glass Market Revenues & Volume, By Display Screens, 2022 - 2032F |
6.3.4 Belgium Technical Glass Market Revenues & Volume, By Laboratory Equipment, 2022 - 2032F |
6.4 Belgium Technical Glass Market, By Property |
6.4.1 Overview and Analysis |
6.4.2 Belgium Technical Glass Market Revenues & Volume, By High Heat Resistance, 2022 - 2032F |
6.4.3 Belgium Technical Glass Market Revenues & Volume, By Scratch Resistance, 2022 - 2032F |
6.4.4 Belgium Technical Glass Market Revenues & Volume, By Chemical Stability, 2022 - 2032F |
6.5 Belgium Technical Glass Market, By End Use |
6.5.1 Overview and Analysis |
6.5.2 Belgium Technical Glass Market Revenues & Volume, By Electronics, 2022 - 2032F |
6.5.3 Belgium Technical Glass Market Revenues & Volume, By Automotive, 2022 - 2032F |
6.5.4 Belgium Technical Glass Market Revenues & Volume, By Healthcare, 2022 - 2032F |
7 Belgium Technical Glass Market Import-Export Trade Statistics |
7.1 Belgium Technical Glass Market Export to Major Countries |
7.2 Belgium Technical Glass Market Imports from Major Countries |
8 Belgium Technical Glass Market Key Performance Indicators |
8.1 Energy Efficiency Rating of technical glass products. |
8.2 Number of new architectural projects incorporating technical glass. |
8.3 Rate of adoption of sustainable practices in construction projects involving technical glass. |
9 Belgium Technical Glass Market - Opportunity Assessment |
9.1 Belgium Technical Glass Market Opportunity Assessment, By Product Type, 2022 & 2032F |
9.2 Belgium Technical Glass Market Opportunity Assessment, By Material Type, 2022 & 2032F |
9.3 Belgium Technical Glass Market Opportunity Assessment, By Application, 2022 & 2032F |
9.4 Belgium Technical Glass Market Opportunity Assessment, By Property, 2022 & 2032F |
9.5 Belgium Technical Glass Market Opportunity Assessment, By End Use, 2022 & 2032F |
10 Belgium Technical Glass Market - Competitive Landscape |
10.1 Belgium Technical Glass Market Revenue Share, By Companies, 2025 |
10.2 Belgium Technical Glass Market Competitive Benchmarking, By Operating and Technical Parameters |
11 Company Profiles |
12 Recommendations |
13 Disclaimer |
Global Go To Market Strategy - 2030
Export potential enables firms to identify high-growth global markets with greater confidence by combining advanced trade intelligence with a structured quantitative methodology. The framework analyzes emerging demand trends and country-level import patterns while integrating macroeconomic and trade datasets such as GDP and population forecasts, bilateral import–export flows, tariff structures, elasticity differentials between developed and developing economies, geographic distance, and import demand projections. Using weighted trade values from 2020–2024 as the base period to project country-to-country export potential for 2030, these inputs are operationalized through calculated drivers such as gravity model parameters, tariff impact factors, and projected GDP per-capita growth. Through an analysis of hidden potentials, demand hotspots, and market conditions that are most favorable to success, this method enables firms to focus on target countries, maximize returns, and global expansion with data, backed by accuracy.
By factoring in the projected importer demand gap that is currently unmet and could be potential opportunity, it identifies the potential for the Exporter (Country) among 190 countries, against the general trade analysis, which identifies the biggest importer or exporter.
To discover high-growth global markets and optimize your business strategy:
Click Here
Pricing
- Single User License$ 1,995
- Department License$ 2,400
- Site License$ 3,120
- Global License$ 3,795

Leadership Perspectives from Industry Events
Search
Thought Leadership and Analyst Meet


Our Clients
6WResearch In News
- India Air Conditioner Market Set for Strong Rebound in 2026 After Weather-Led Correction and GST-Driven Recovery: 6Wresearch
- ADAS in India: How Automatic Emergency Braking, Blind Spot Detection & Driver Monitoring are Transforming Road Safety
- Doha a strategic location for EV manufacturing hub: IPA Qatar
- Demand for luxury TVs surging in the GCC, says Samsung
- Empowering Growth: The Thriving Journey of Bangladesh’s Cable Industry
- Demand for luxury TVs surging in the GCC, says Samsung
Latest Reports
- Poland Fire Protection Systems Market (2026-2032)
- Cape Verde Portable Hand-Thrown Extinguisher Market (2026-2032)
- Canada Portable Hand-Thrown Extinguisher Market (2026-2032)
- Cameroon Portable Hand-Thrown Extinguisher Market (2026-2032)
- Burundi Portable Hand-Thrown Extinguisher Market (2026-2032)
- Burkina Faso Portable Hand-Thrown Extinguisher Market (2026-2032)
- Bulgaria Portable Hand-Thrown Extinguisher Market (2026-2032)
- Brunei Portable Hand-Thrown Extinguisher Market (2026-2032)
- Botswana Portable Hand-Thrown Extinguisher Market (2026-2032)
- Bosnia and Herzegovina Portable Hand-Thrown Extinguisher Market (2026-2032)
Industry Events and Analyst Meet

HIMTEX 2026

India Refining Summit 2026

India EV Show 2026

EV tech India Expo 2026

Auto Tech Asia 2026
Whitepaper
- Middle East & Africa Commercial Security Market Click here to view more.
- Middle East & Africa Fire Safety Systems & Equipment Market Click here to view more.
- GCC Drone Market Click here to view more.
- Middle East Lighting Fixture Market Click here to view more.
- GCC Physical & Perimeter Security Market Click here to view more.