Benin Sandblasting Machines Market (2026-2032) | Share, Industry, Companies, Size, Outlook, Segmentation, Trends, Value, Revenue, Growth, Forecast & Analysis
Market Forecast By Blasting Type (Dry Blasting, Wet Blasting), By Control System (Automatic, Semi-automatic, Manual), By Tank Capacity (Less than 1000L, 1000L - 2000L, 2000L - 3000L, More than 3000L), By Product (Portable, Stationary), By End-user (Automotive, Construction, Marine, Oil & Gas, Petrochemicals, Others) And Competitive Landscape
| Product Code: ETC5212408 | Publication Date: Nov 2023 | Updated Date: Feb 2026 | Product Type: Market Research Report | |
| Publisher: 6Wresearch | Author: Shubham Padhi | No. of Pages: 60 | No. of Figures: 30 | No. of Tables: 5 |
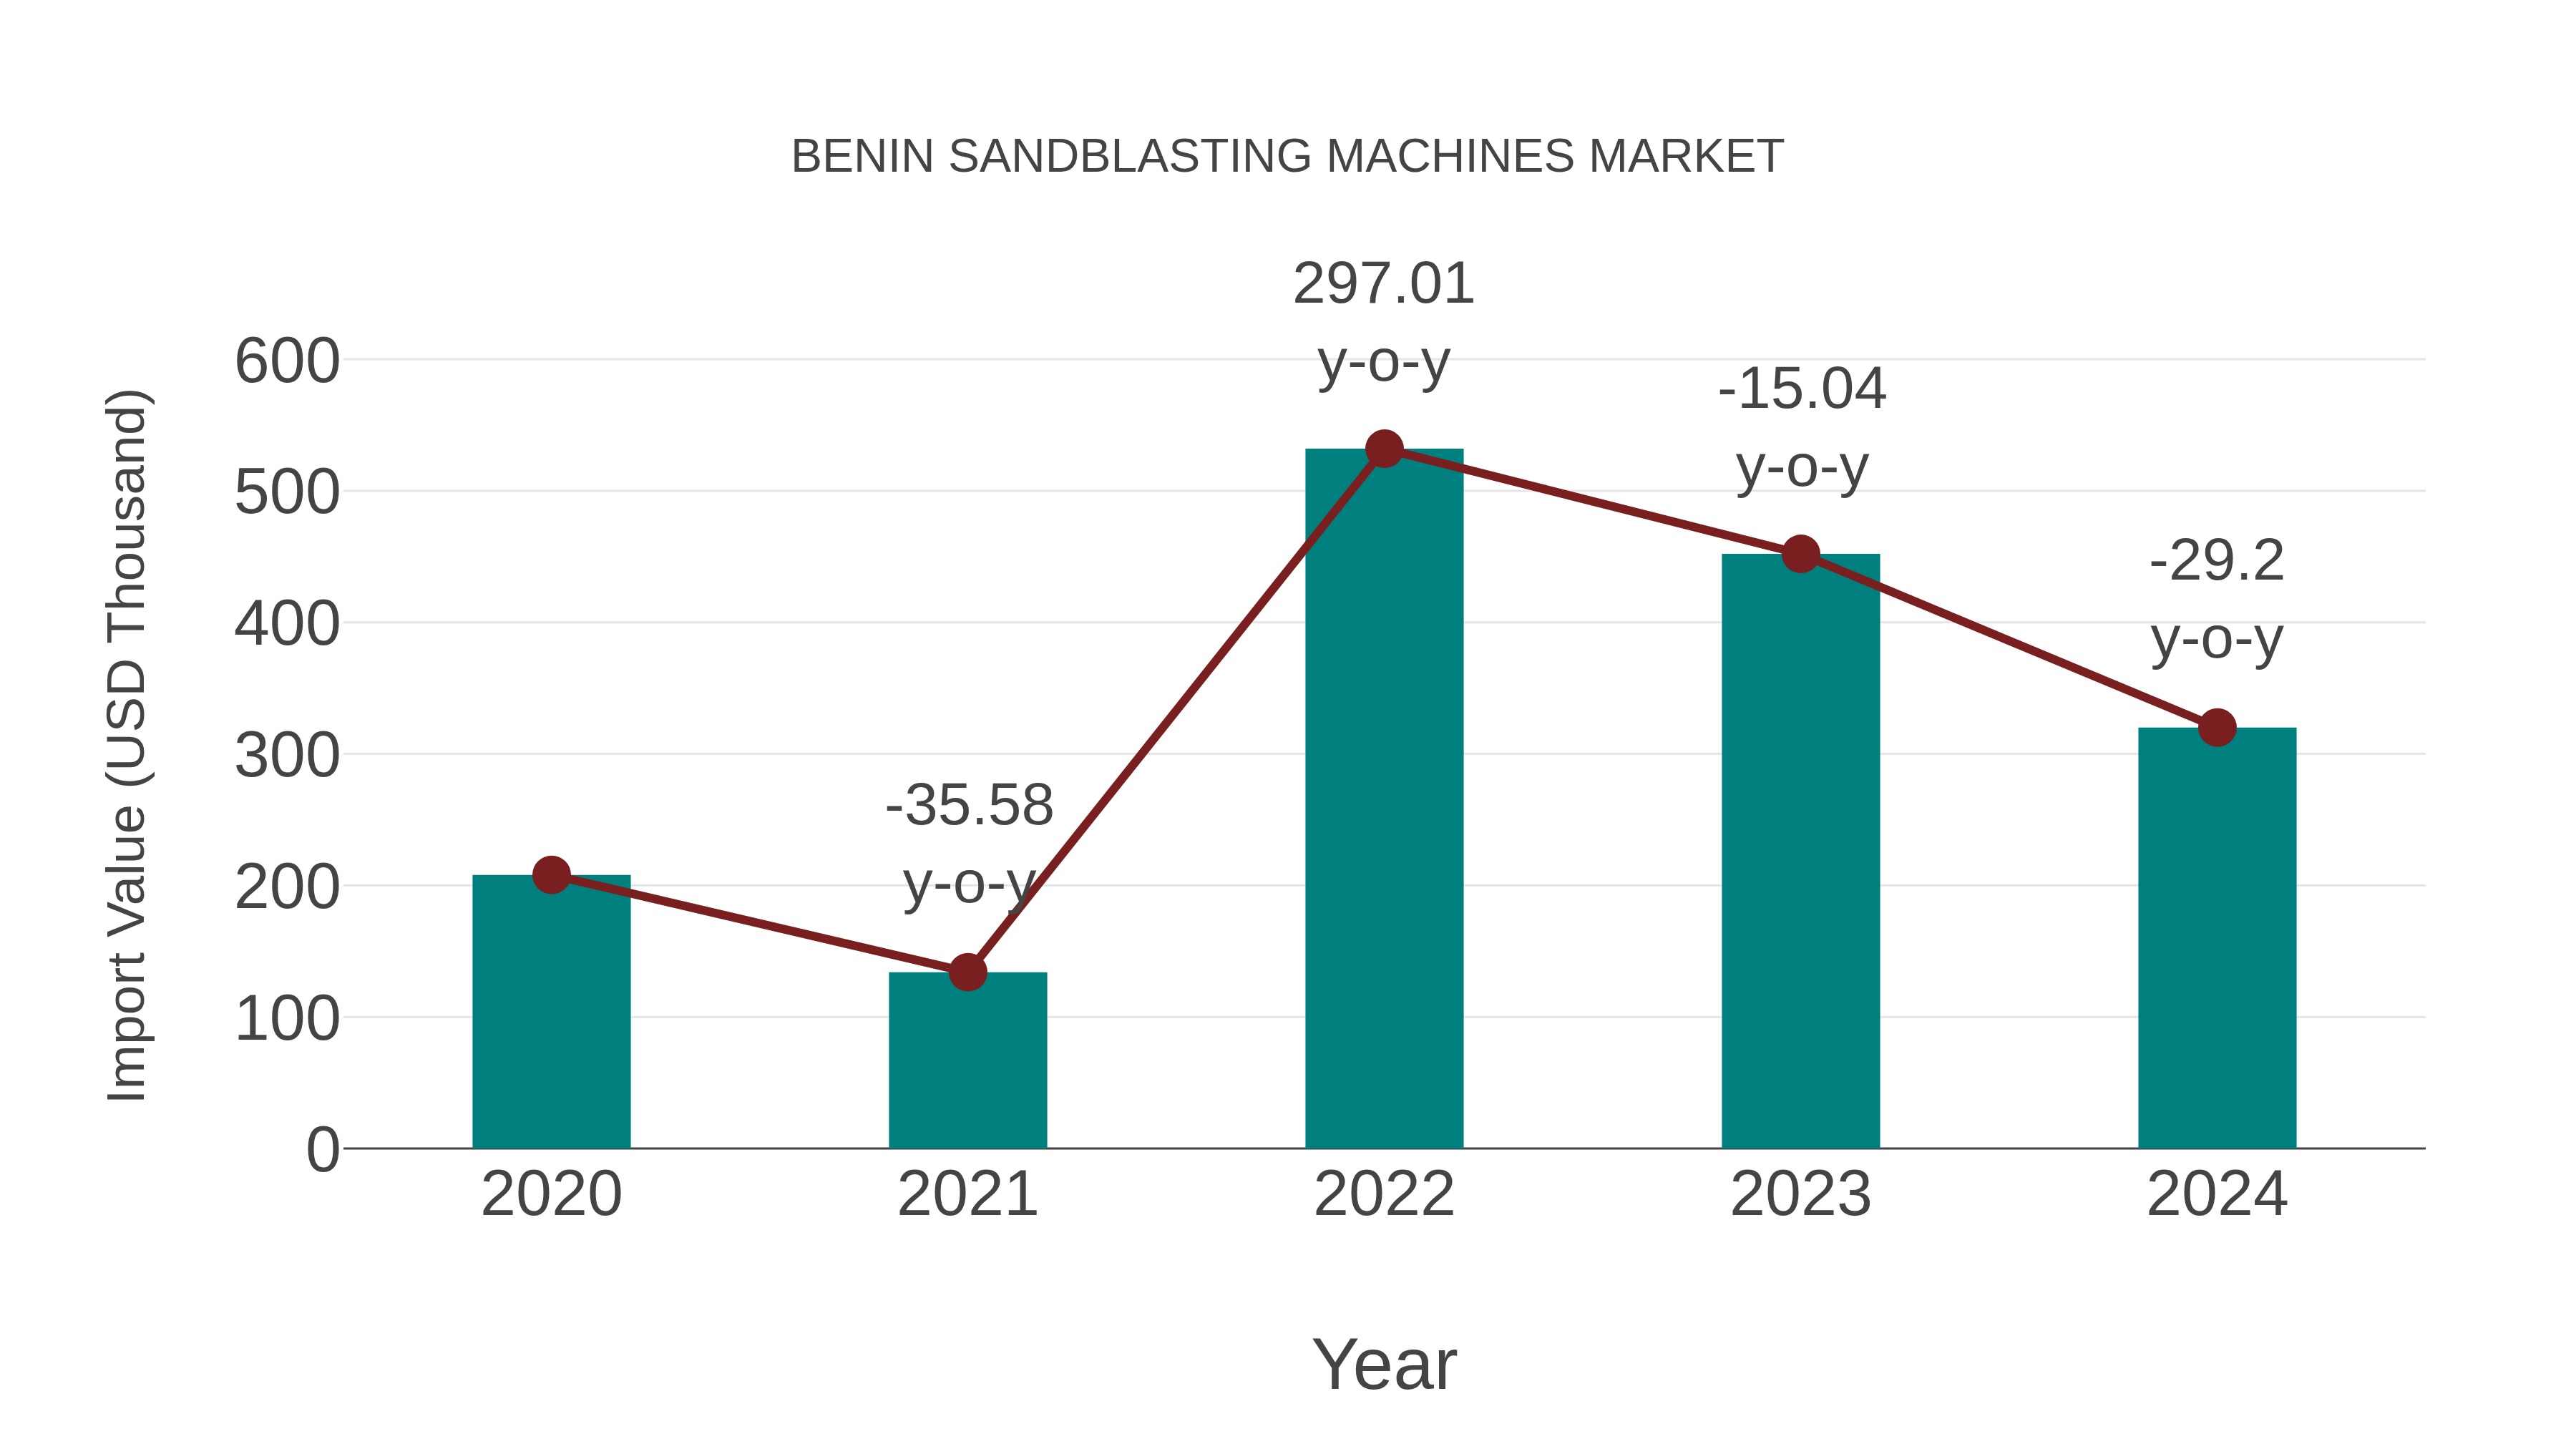
Benin Sandblasting Machines Market: Import Trend Analysis
Benin`s import trend for sandblasting machines saw a decline in growth from 2023 to 2024, with a rate of -29.2%. However, the compound annual growth rate (CAGR) from 2020 to 2024 stood at 11.37%. This drop in import growth could be attributed to fluctuating demand or changes in trade policies impacting the market.
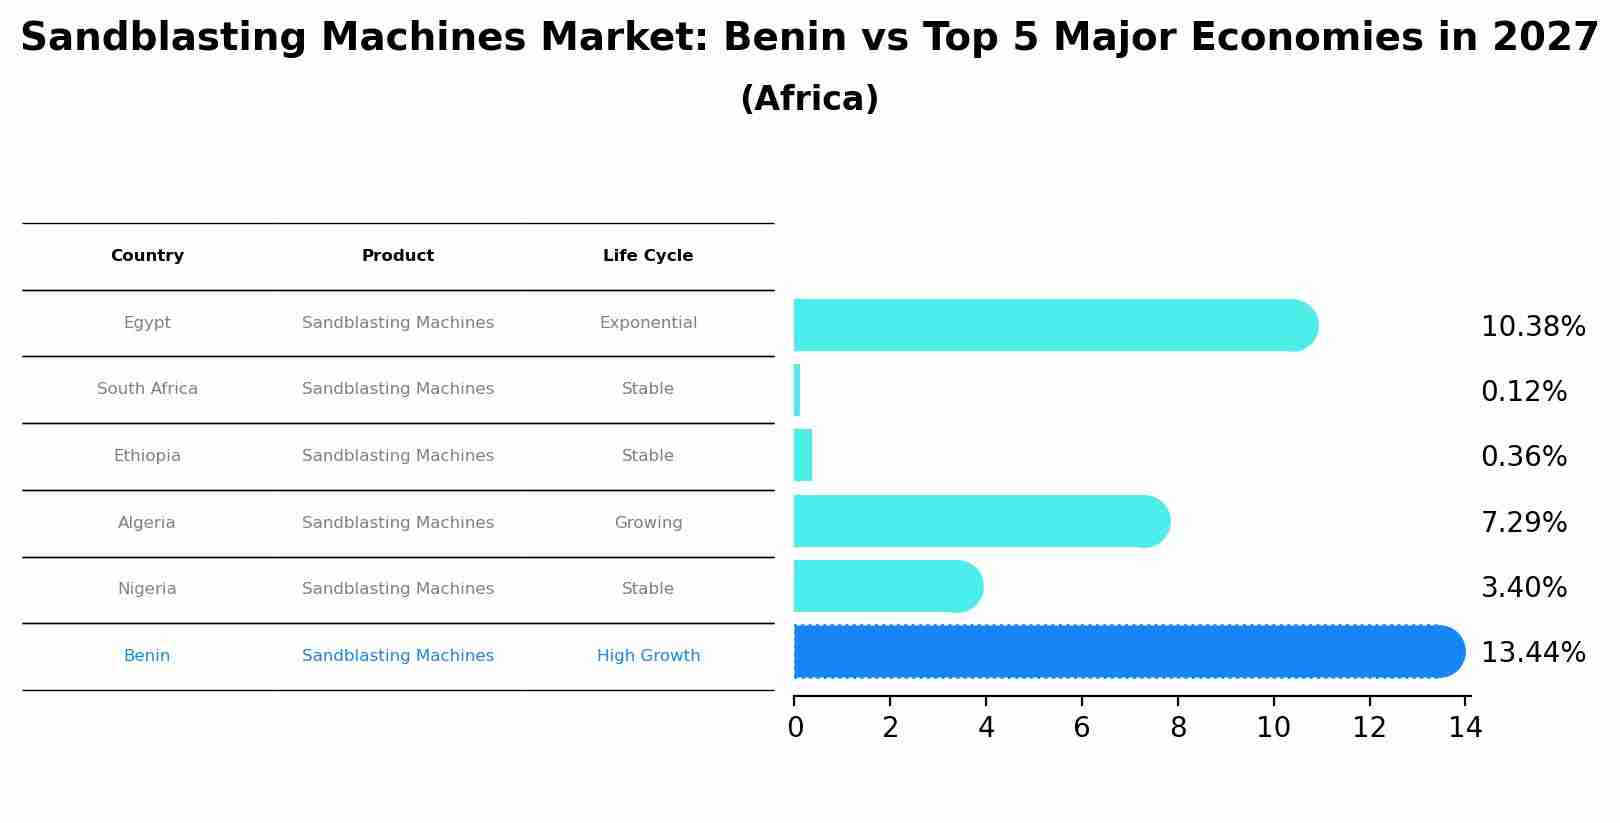
Sandblasting Machines Market: Benin vs Top 5 Major Economies in 2027 (Africa)
Benin's Sandblasting Machines market is anticipated to experience a high growth rate of 13.44% by 2027, reflecting trends observed in the largest economy Egypt, followed by South Africa, Ethiopia, Algeria and Nigeria.
Key Highlights of the Report:
- Benin Sandblasting Machines Market Outlook
- Market Size of Benin Sandblasting Machines Market, 2025
- Forecast of Benin Sandblasting Machines Market, 2032
- Historical Data and Forecast of Benin Sandblasting Machines Revenues & Volume for the Period 2022-2032F
- Benin Sandblasting Machines Market Trend Evolution
- Benin Sandblasting Machines Market Drivers and Challenges
- Benin Sandblasting Machines Price Trends
- Benin Sandblasting Machines Porter`s Five Forces
- Benin Sandblasting Machines Industry Life Cycle
- Historical Data and Forecast of Benin Sandblasting Machines Market Revenues & Volume By Blasting Type for the Period 2022-2032F
- Historical Data and Forecast of Benin Sandblasting Machines Market Revenues & Volume By Dry Blasting for the Period 2022-2032F
- Historical Data and Forecast of Benin Sandblasting Machines Market Revenues & Volume By Wet Blasting for the Period 2022-2032F
- Historical Data and Forecast of Benin Sandblasting Machines Market Revenues & Volume By Control System for the Period 2022-2032F
- Historical Data and Forecast of Benin Sandblasting Machines Market Revenues & Volume By Automatic for the Period 2022-2032F
- Historical Data and Forecast of Benin Sandblasting Machines Market Revenues & Volume By Semi-automatic for the Period 2022-2032F
- Historical Data and Forecast of Benin Sandblasting Machines Market Revenues & Volume By Manual for the Period 2022-2032F
- Historical Data and Forecast of Benin Sandblasting Machines Market Revenues & Volume By Tank Capacity for the Period 2022-2032F
- Historical Data and Forecast of Benin Sandblasting Machines Market Revenues & Volume By Less than 1000L for the Period 2022-2032F
- Historical Data and Forecast of Benin Sandblasting Machines Market Revenues & Volume By 1000L - 2000L for the Period 2022-2032F
- Historical Data and Forecast of Benin Sandblasting Machines Market Revenues & Volume By 2000L - 3000L for the Period 2022-2032F
- Historical Data and Forecast of Benin Sandblasting Machines Market Revenues & Volume By More than 3000L for the Period 2022-2032F
- Historical Data and Forecast of Benin Sandblasting Machines Market Revenues & Volume By Product for the Period 2022-2032F
- Historical Data and Forecast of Benin Sandblasting Machines Market Revenues & Volume By Portable for the Period 2022-2032F
- Historical Data and Forecast of Benin Sandblasting Machines Market Revenues & Volume By Stationary for the Period 2022-2032F
- Historical Data and Forecast of Benin Sandblasting Machines Market Revenues & Volume By End-user for the Period 2022-2032F
- Historical Data and Forecast of Benin Sandblasting Machines Market Revenues & Volume By Automotive for the Period 2022-2032F
- Historical Data and Forecast of Benin Sandblasting Machines Market Revenues & Volume By Construction for the Period 2022-2032F
- Historical Data and Forecast of Benin Sandblasting Machines Market Revenues & Volume By Marine for the Period 2022-2032F
- Historical Data and Forecast of Benin Sandblasting Machines Market Revenues & Volume By Oil & Gas for the Period 2022-2032F
- Historical Data and Forecast of Benin Sandblasting Machines Market Revenues & Volume By Petrochemicals for the Period 2022-2032F
- Historical Data and Forecast of Benin Sandblasting Machines Market Revenues & Volume By Others for the Period 2022-2032F
- Benin Sandblasting Machines Import Export Trade Statistics
- Market Opportunity Assessment By Blasting Type
- Market Opportunity Assessment By Control System
- Market Opportunity Assessment By Tank Capacity
- Market Opportunity Assessment By Product
- Market Opportunity Assessment By End-user
- Benin Sandblasting Machines Top Companies Market Share
- Benin Sandblasting Machines Competitive Benchmarking By Technical and Operational Parameters
- Benin Sandblasting Machines Company Profiles
- Benin Sandblasting Machines Key Strategic Recommendations
Frequently Asked Questions About the Market Study (FAQs):
6Wresearch actively monitors the Benin Sandblasting Machines Market and publishes its comprehensive annual report, highlighting emerging trends, growth drivers, revenue analysis, and forecast outlook. Our insights help businesses to make data-backed strategic decisions with ongoing market dynamics. Our analysts track relevent industries related to the Benin Sandblasting Machines Market, allowing our clients with actionable intelligence and reliable forecasts tailored to emerging regional needs.
Yes, we provide customisation as per your requirements. To learn more, feel free to contact us on sales@6wresearch.com
1 Executive Summary |
2 Introduction |
2.1 Key Highlights of the Report |
2.2 Report Description |
2.3 Market Scope & Segmentation |
2.4 Research Methodology |
2.5 Assumptions |
3 Benin Sandblasting Machines Market Overview |
3.1 Benin Country Macro Economic Indicators |
3.2 Benin Sandblasting Machines Market Revenues & Volume, 2022 & 2032F |
3.3 Benin Sandblasting Machines Market - Industry Life Cycle |
3.4 Benin Sandblasting Machines Market - Porter's Five Forces |
3.5 Benin Sandblasting Machines Market Revenues & Volume Share, By Blasting Type, 2022 & 2032F |
3.6 Benin Sandblasting Machines Market Revenues & Volume Share, By Control System, 2022 & 2032F |
3.7 Benin Sandblasting Machines Market Revenues & Volume Share, By Tank Capacity, 2022 & 2032F |
3.8 Benin Sandblasting Machines Market Revenues & Volume Share, By Product, 2022 & 2032F |
3.9 Benin Sandblasting Machines Market Revenues & Volume Share, By End-user, 2022 & 2032F |
4 Benin Sandblasting Machines Market Dynamics |
4.1 Impact Analysis |
4.2 Market Drivers |
4.2.1 Growing industrialization in Benin leading to increased demand for sandblasting machines |
4.2.2 Rising focus on infrastructure development driving the need for surface preparation equipment |
4.2.3 Advancements in technology improving the efficiency and effectiveness of sandblasting machines |
4.3 Market Restraints |
4.3.1 High initial investment cost associated with purchasing sandblasting machines |
4.3.2 Lack of awareness and skilled workforce in operating sandblasting equipment |
4.3.3 Environmental concerns related to dust and abrasive material emissions during sandblasting processes |
5 Benin Sandblasting Machines Market Trends |
6 Benin Sandblasting Machines Market Segmentations |
6.1 Benin Sandblasting Machines Market, By Blasting Type |
6.1.1 Overview and Analysis |
6.1.2 Benin Sandblasting Machines Market Revenues & Volume, By Dry Blasting, 2022-2032F |
6.1.3 Benin Sandblasting Machines Market Revenues & Volume, By Wet Blasting, 2022-2032F |
6.2 Benin Sandblasting Machines Market, By Control System |
6.2.1 Overview and Analysis |
6.2.2 Benin Sandblasting Machines Market Revenues & Volume, By Automatic, 2022-2032F |
6.2.3 Benin Sandblasting Machines Market Revenues & Volume, By Semi-automatic, 2022-2032F |
6.2.4 Benin Sandblasting Machines Market Revenues & Volume, By Manual, 2022-2032F |
6.3 Benin Sandblasting Machines Market, By Tank Capacity |
6.3.1 Overview and Analysis |
6.3.2 Benin Sandblasting Machines Market Revenues & Volume, By Less than 1000L, 2022-2032F |
6.3.3 Benin Sandblasting Machines Market Revenues & Volume, By 1000L - 2000L, 2022-2032F |
6.3.4 Benin Sandblasting Machines Market Revenues & Volume, By 2000L - 3000L, 2022-2032F |
6.3.5 Benin Sandblasting Machines Market Revenues & Volume, By More than 3000L, 2022-2032F |
6.4 Benin Sandblasting Machines Market, By Product |
6.4.1 Overview and Analysis | 6.4.2 Benin Sandblasting Machines Market Revenues & Volume, By Portable, 2022-2032F |
6.4.3 Benin Sandblasting Machines Market Revenues & Volume, By Stationary, 2022-2032F |
6.5 Benin Sandblasting Machines Market, By End-user |
6.5.1 Overview and Analysis |
6.5.2 Benin Sandblasting Machines Market Revenues & Volume, By Automotive, 2022-2032F |
6.5.3 Benin Sandblasting Machines Market Revenues & Volume, By Construction, 2022-2032F |
6.5.4 Benin Sandblasting Machines Market Revenues & Volume, By Marine, 2022-2032F |
6.5.5 Benin Sandblasting Machines Market Revenues & Volume, By Oil & Gas, 2022-2032F |
6.5.6 Benin Sandblasting Machines Market Revenues & Volume, By Petrochemicals, 2022-2032F |
6.5.7 Benin Sandblasting Machines Market Revenues & Volume, By Others, 2022-2032F |
7 Benin Sandblasting Machines Market Import-Export Trade Statistics |
7.1 Benin Sandblasting Machines Market Export to Major Countries |
7.2 Benin Sandblasting Machines Market Imports from Major Countries |
8 Benin Sandblasting Machines Market Key Performance Indicators |
8.1 Average utilization rate of sandblasting machines in Benin |
8.2 Rate of adoption of eco-friendly and sustainable sandblasting technologies |
8.3 Number of training programs conducted to enhance the skillset of sandblasting machine operators |
9 Benin Sandblasting Machines Market - Opportunity Assessment |
9.1 Benin Sandblasting Machines Market Opportunity Assessment, By Blasting Type, 2022 & 2032F |
9.2 Benin Sandblasting Machines Market Opportunity Assessment, By Control System, 2022 & 2032F |
9.3 Benin Sandblasting Machines Market Opportunity Assessment, By Tank Capacity, 2022 & 2032F |
9.4 Benin Sandblasting Machines Market Opportunity Assessment, By Product, 2022 & 2032F |
9.5 Benin Sandblasting Machines Market Opportunity Assessment, By End-user, 2022 & 2032F |
10 Benin Sandblasting Machines Market - Competitive Landscape |
10.1 Benin Sandblasting Machines Market Revenue Share, By Companies, 2025 |
10.2 Benin Sandblasting Machines Market Competitive Benchmarking, By Operating and Technical Parameters |
11 Company Profiles |
12 Recommendations | 13 Disclaimer |
Global Go To Market Strategy - 2030
Export potential enables firms to identify high-growth global markets with greater confidence by combining advanced trade intelligence with a structured quantitative methodology. The framework analyzes emerging demand trends and country-level import patterns while integrating macroeconomic and trade datasets such as GDP and population forecasts, bilateral import–export flows, tariff structures, elasticity differentials between developed and developing economies, geographic distance, and import demand projections. Using weighted trade values from 2020–2024 as the base period to project country-to-country export potential for 2030, these inputs are operationalized through calculated drivers such as gravity model parameters, tariff impact factors, and projected GDP per-capita growth. Through an analysis of hidden potentials, demand hotspots, and market conditions that are most favorable to success, this method enables firms to focus on target countries, maximize returns, and global expansion with data, backed by accuracy.
By factoring in the projected importer demand gap that is currently unmet and could be potential opportunity, it identifies the potential for the Exporter (Country) among 190 countries, against the general trade analysis, which identifies the biggest importer or exporter.
To discover high-growth global markets and optimize your business strategy:
Click Here
Pricing
- Single User License$ 1,995
- Department License$ 2,400
- Site License$ 3,120
- Global License$ 3,795

Leadership Perspectives from Industry Events
Search
Thought Leadership and Analyst Meet


Our Clients
6WResearch In News
- Doha a strategic location for EV manufacturing hub: IPA Qatar
- Demand for luxury TVs surging in the GCC, says Samsung
- Empowering Growth: The Thriving Journey of Bangladesh’s Cable Industry
- Demand for luxury TVs surging in the GCC, says Samsung
- Video call with a traditional healer? Once unthinkable, it’s now common in South Africa
- Intelligent Buildings To Smooth GCC’s Path To Net Zero
Latest Reports
- Taiwan Airport Wireless Infrastructure Market (2026-2032)
- Vietnam Airport Wireless Infrastructure Market (2026-2032)
- Thailand Airport Wireless Infrastructure Market (2026-2032)
- South Korea Airport Wireless Infrastructure Market (2026-2032)
- Romania Airport Wireless Infrastructure Market (2026-2032)
- Qatar Airport Wireless Infrastructure Market (2026-2032)
- Philippines Airport Wireless Infrastructure Market (2026-2032)
- Japan Airport Wireless Infrastructure Market (2026-2032)
- Taiwan Airport Winter Services Market (2026-2032)
- Vietnam Airport Winter Services Market (2026-2032)
Industry Events and Analyst Meet

HIMTEX 2026

India Refining Summit 2026

India EV Show 2026

EV tech India Expo 2026

Auto Tech Asia 2026
Whitepaper
- Middle East & Africa Commercial Security Market Click here to view more.
- Middle East & Africa Fire Safety Systems & Equipment Market Click here to view more.
- GCC Drone Market Click here to view more.
- Middle East Lighting Fixture Market Click here to view more.
- GCC Physical & Perimeter Security Market Click here to view more.