Bhutan Candy Market (2025-2031) | Size, Analysis, Industry, Forecast, Growth, Share, Trends, Segmentation, Revenue, Outlook, Value & Companies
Market Forecast By Product Type (Chocolate Candy, Non-Chocolate Candy), By Distribution (Supermarkets and Hypermarkets, Convenience Stores, Specialist Retailers, Online Retail, Others) And Competitive Landscape
| Product Code: ETC5378260 | Publication Date: Nov 2023 | Updated Date: Aug 2025 | Product Type: Market Research Report | |
| Publisher: 6Wresearch | Author: Bhawna Singh | No. of Pages: 60 | No. of Figures: 30 | No. of Tables: 5 |
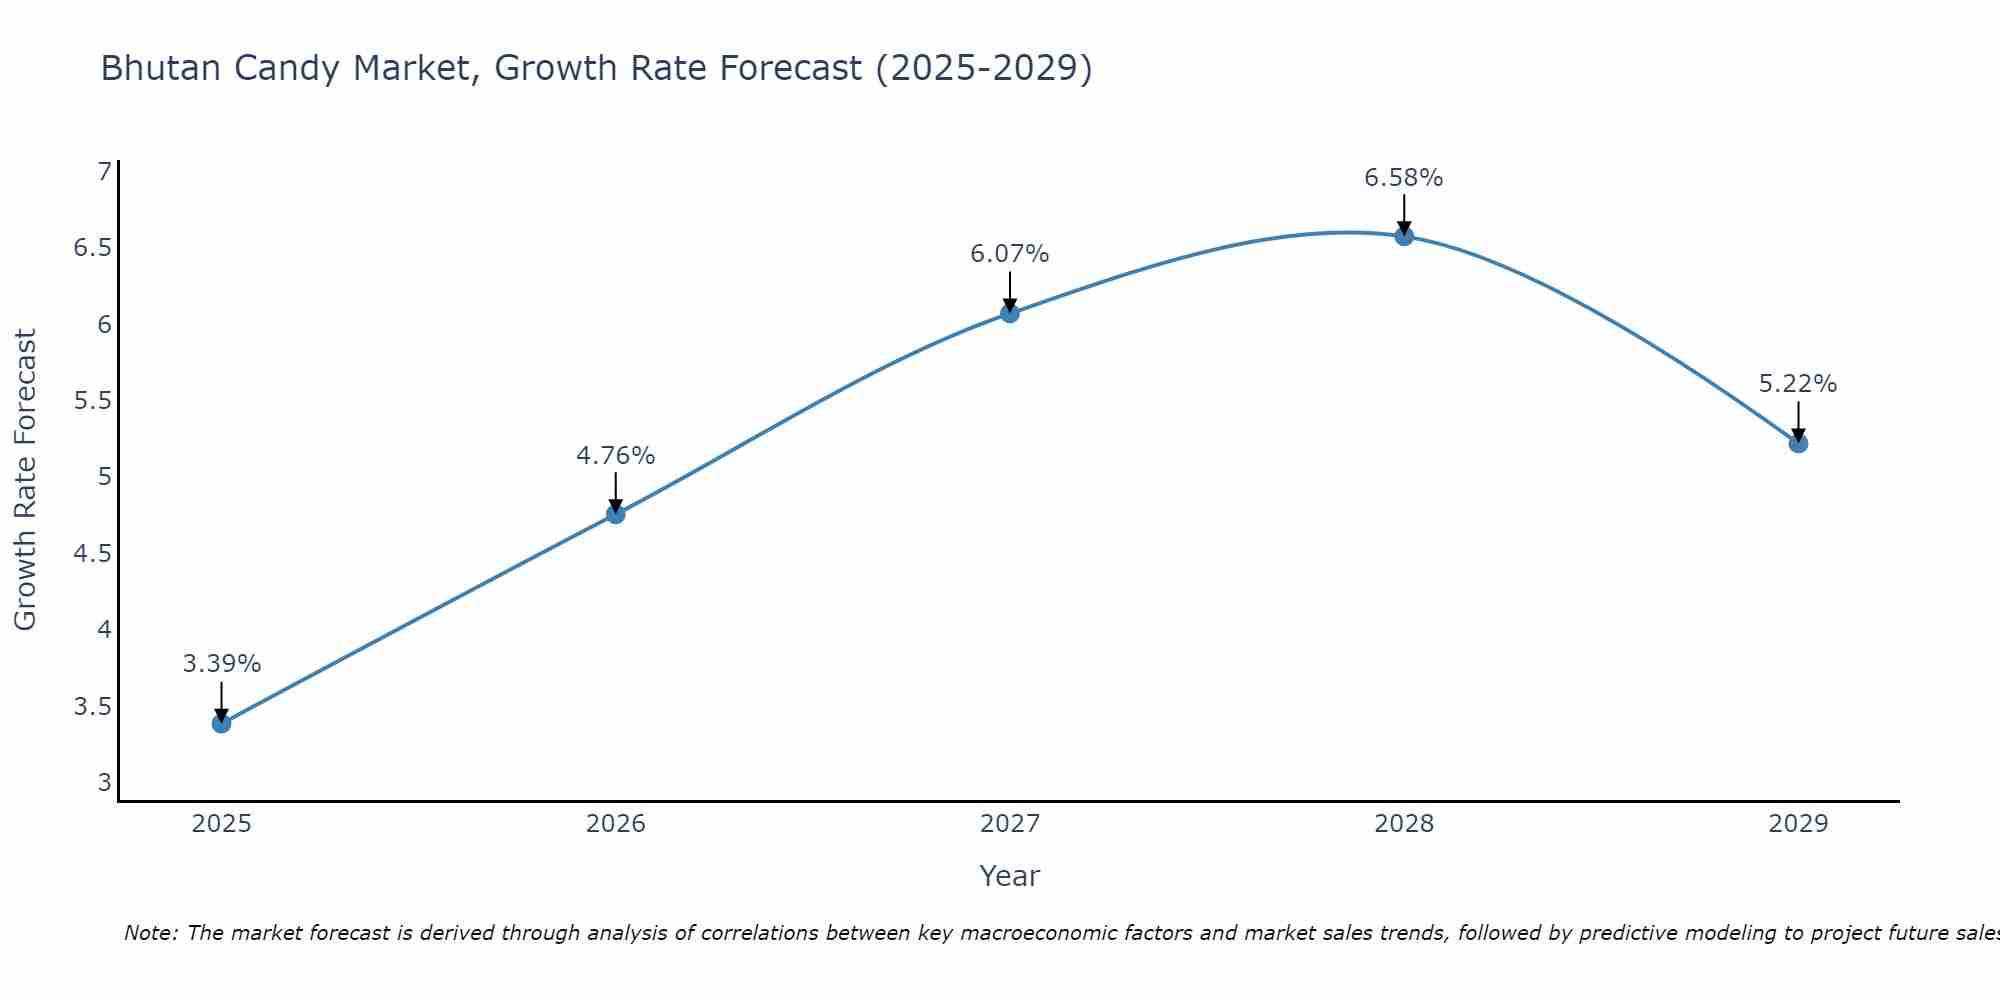
Bhutan Candy Market Size Growth Rate
The Bhutan Candy Market is projected to witness mixed growth rate patterns during 2025 to 2029. Starting at 3.39% in 2025, the market peaks at 6.58% in 2028, and settles at 5.22% by 2029.
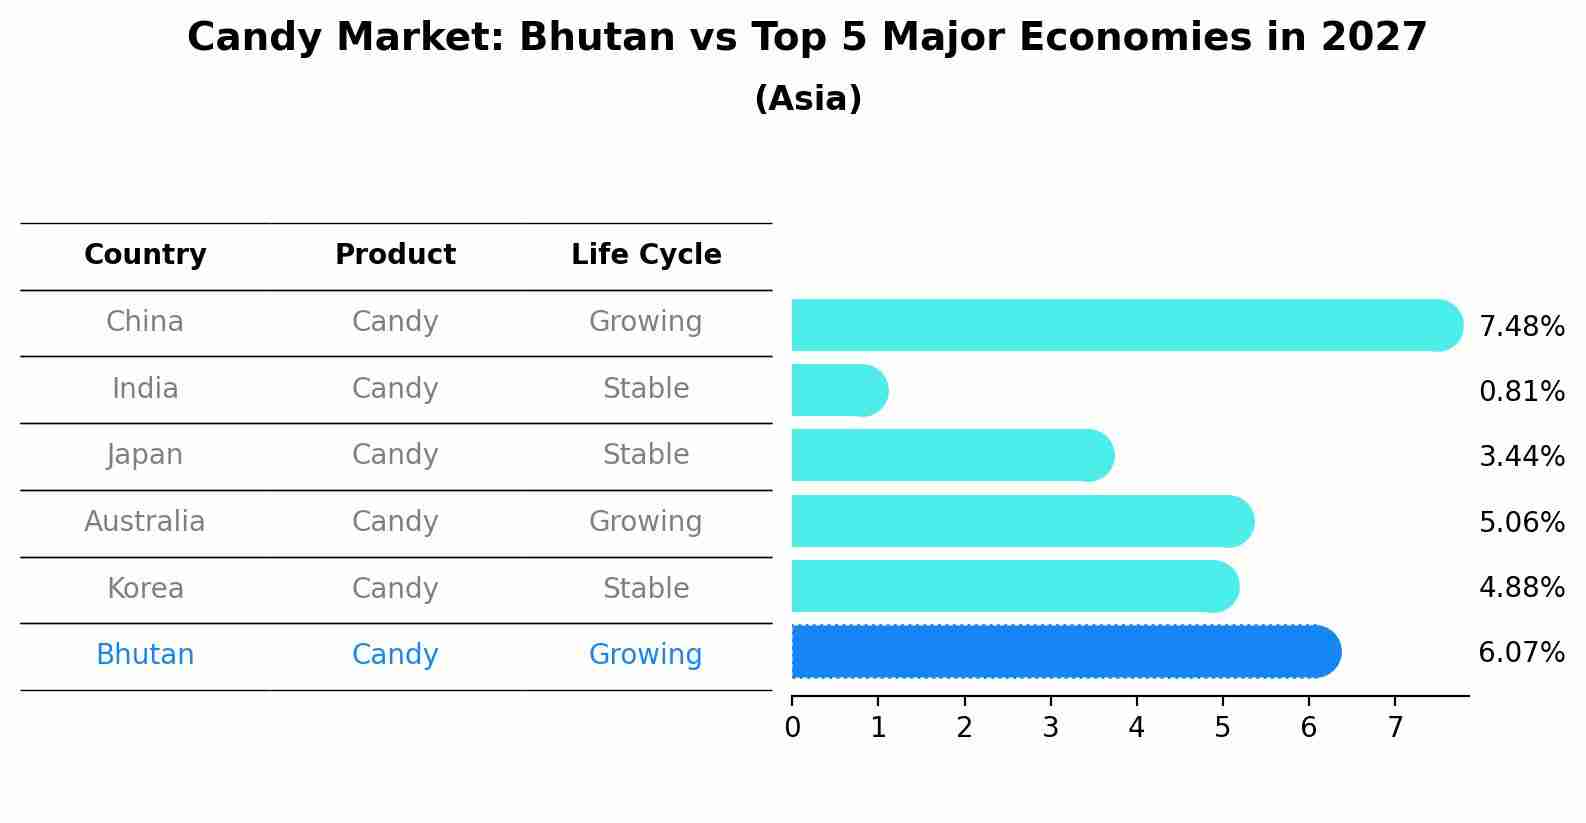
Candy Market: Bhutan vs Top 5 Major Economies in 2027 (Asia)
The Candy market in Bhutan is projected to grow at a growing growth rate of 6.07% by 2027, highlighting the country's increasing focus on advanced technologies within the Asia region, where China holds the dominant position, followed closely by India, Japan, Australia and South Korea, shaping overall regional demand.
Bhutan Candy Market Overview
The candy market in Bhutan is characterized by a mix of traditional sweets and modern confectioneries. As the population grows and consumer preferences evolve, there is an increasing demand for diverse candy products. Local producers and international brands both have a presence in the market, with a focus on innovative flavors and packaging. Government policies aimed at promoting local industries and ensuring food safety standards play a significant role in shaping the market.
Drivers of the market
The Bhutan candy market is driven by increasing disposable incomes and changing consumer preferences towards confectionery products. The market benefits from the rising popularity of premium and innovative candy products that cater to diverse taste preferences. Additionally, the influence of Western culture and media, promoting various types of candies, has increased their consumption. Seasonal demand during festivals and special occasions further stimulates market growth. Moreover, the introduction of healthier candy options, such as sugar-free and organic candies, aligns with the growing health-conscious trend among consumers, supporting the market`s expansion.
Challenges of the market
Bhutan`s candy market faces challenges related to limited manufacturing capabilities and reliance on imported products. High import duties and transportation costs increase the final price of candy, making it less competitive compared to local snacks. Additionally, the market struggles with changing consumer preferences towards healthier options, reducing the demand for traditional candy. Regulatory compliance with food safety standards can also be a hurdle for both local manufacturers and importers, affecting market growth.
Government Policy of the market
The candy market in Bhutan is relatively small but growing, driven by increasing consumer demand for packaged and processed foods. The government regulates the food industry to ensure quality and safety, focusing on health standards to combat rising concerns about nutrition and health. Policies that promote local production and the use of Bhutanese ingredients can boost the market for traditional sweets and modern candies. Additionally, initiatives to encourage tourism and showcase Bhutanese culinary traditions help expand the market both domestically and internationally.
Key Highlights of the Report:
- Bhutan Candy Market Outlook
- Market Size of Bhutan Candy Market, 2024
- Forecast of Bhutan Candy Market, 2031
- Historical Data and Forecast of Bhutan Candy Revenues & Volume for the Period 2021-2031
- Bhutan Candy Market Trend Evolution
- Bhutan Candy Market Drivers and Challenges
- Bhutan Candy Price Trends
- Bhutan Candy Porter`s Five Forces
- Bhutan Candy Industry Life Cycle
- Historical Data and Forecast of Bhutan Candy Market Revenues & Volume By Product Type for the Period 2021-2031
- Historical Data and Forecast of Bhutan Candy Market Revenues & Volume By Chocolate Candy for the Period 2021-2031
- Historical Data and Forecast of Bhutan Candy Market Revenues & Volume By Non-Chocolate Candy for the Period 2021-2031
- Historical Data and Forecast of Bhutan Candy Market Revenues & Volume By Distribution for the Period 2021-2031
- Historical Data and Forecast of Bhutan Candy Market Revenues & Volume By Supermarkets and Hypermarkets for the Period 2021-2031
- Historical Data and Forecast of Bhutan Candy Market Revenues & Volume By Convenience Stores for the Period 2021-2031
- Historical Data and Forecast of Bhutan Candy Market Revenues & Volume By Specialist Retailers for the Period 2021-2031
- Historical Data and Forecast of Bhutan Candy Market Revenues & Volume By Online Retail for the Period 2021-2031
- Historical Data and Forecast of Bhutan Candy Market Revenues & Volume By Others for the Period 2021-2031
- Bhutan Candy Import Export Trade Statistics
- Market Opportunity Assessment By Product Type
- Market Opportunity Assessment By Distribution
- Bhutan Candy Top Companies Market Share
- Bhutan Candy Competitive Benchmarking By Technical and Operational Parameters
- Bhutan Candy Company Profiles
- Bhutan Candy Key Strategic Recommendations
Frequently Asked Questions About the Market Study (FAQs):
6Wresearch actively monitors the Bhutan Candy Market and publishes its comprehensive annual report, highlighting emerging trends, growth drivers, revenue analysis, and forecast outlook. Our insights help businesses to make data-backed strategic decisions with ongoing market dynamics. Our analysts track relevent industries related to the Bhutan Candy Market, allowing our clients with actionable intelligence and reliable forecasts tailored to emerging regional needs.
Yes, we provide customisation as per your requirements. To learn more, feel free to contact us on sales@6wresearch.com
1 Executive Summary |
2 Introduction |
2.1 Key Highlights of the Report |
2.2 Report Description |
2.3 Market Scope & Segmentation |
2.4 Research Methodology |
2.5 Assumptions |
3 Bhutan Candy Market Overview |
3.1 Bhutan Country Macro Economic Indicators |
3.2 Bhutan Candy Market Revenues & Volume, 2021 & 2031F |
3.3 Bhutan Candy Market - Industry Life Cycle |
3.4 Bhutan Candy Market - Porter's Five Forces |
3.5 Bhutan Candy Market Revenues & Volume Share, By Product Type, 2021 & 2031F |
3.6 Bhutan Candy Market Revenues & Volume Share, By Distribution, 2021 & 2031F |
4 Bhutan Candy Market Dynamics |
4.1 Impact Analysis |
4.2 Market Drivers |
4.2.1 Increasing consumer demand for unique and exotic flavors in confectionery products |
4.2.2 Growing popularity of Bhutanese traditional candies among tourists and international markets |
4.2.3 Rising disposable income and changing lifestyles leading to higher spending on premium and indulgent treats |
4.3 Market Restraints |
4.3.1 Limited availability of raw materials and ingredients for traditional Bhutanese candies |
4.3.2 High production costs and limited economies of scale for small candy manufacturers in Bhutan |
5 Bhutan Candy Market Trends |
6 Bhutan Candy Market Segmentations |
6.1 Bhutan Candy Market, By Product Type |
6.1.1 Overview and Analysis |
6.1.2 Bhutan Candy Market Revenues & Volume, By Chocolate Candy, 2021-2031F |
6.1.3 Bhutan Candy Market Revenues & Volume, By Non-Chocolate Candy, 2021-2031F |
6.2 Bhutan Candy Market, By Distribution |
6.2.1 Overview and Analysis |
6.2.2 Bhutan Candy Market Revenues & Volume, By Supermarkets and Hypermarkets, 2021-2031F |
6.2.3 Bhutan Candy Market Revenues & Volume, By Convenience Stores, 2021-2031F |
6.2.4 Bhutan Candy Market Revenues & Volume, By Specialist Retailers, 2021-2031F |
6.2.5 Bhutan Candy Market Revenues & Volume, By Online Retail, 2021-2031F |
6.2.6 Bhutan Candy Market Revenues & Volume, By Others, 2021-2031F |
7 Bhutan Candy Market Import-Export Trade Statistics |
7.1 Bhutan Candy Market Export to Major Countries |
7.2 Bhutan Candy Market Imports from Major Countries |
8 Bhutan Candy Market Key Performance Indicators |
8.1 Percentage of repeat customers for Bhutanese candy brands |
8.2 Average customer rating and feedback on taste, packaging, and quality of Bhutanese candies |
8.3 Number of new product launches and innovations in the Bhutan candy market |
9 Bhutan Candy Market - Opportunity Assessment |
9.1 Bhutan Candy Market Opportunity Assessment, By Product Type, 2021 & 2031F |
9.2 Bhutan Candy Market Opportunity Assessment, By Distribution, 2021 & 2031F |
10 Bhutan Candy Market - Competitive Landscape |
10.1 Bhutan Candy Market Revenue Share, By Companies, 2024 |
10.2 Bhutan Candy Market Competitive Benchmarking, By Operating and Technical Parameters |
11 Company Profiles |
12 Recommendations | 13 Disclaimer |
Export potential assessment - trade Analytics for 2030
Export potential enables firms to identify high-growth global markets with greater confidence by combining advanced trade intelligence with a structured quantitative methodology. The framework analyzes emerging demand trends and country-level import patterns while integrating macroeconomic and trade datasets such as GDP and population forecasts, bilateral import–export flows, tariff structures, elasticity differentials between developed and developing economies, geographic distance, and import demand projections. Using weighted trade values from 2020–2024 as the base period to project country-to-country export potential for 2030, these inputs are operationalized through calculated drivers such as gravity model parameters, tariff impact factors, and projected GDP per-capita growth. Through an analysis of hidden potentials, demand hotspots, and market conditions that are most favorable to success, this method enables firms to focus on target countries, maximize returns, and global expansion with data, backed by accuracy.
By factoring in the projected importer demand gap that is currently unmet and could be potential opportunity, it identifies the potential for the Exporter (Country) among 190 countries, against the general trade analysis, which identifies the biggest importer or exporter.
To discover high-growth global markets and optimize your business strategy:
Click Here
Pricing
- Single User License$ 1,995
- Department License$ 2,400
- Site License$ 3,120
- Global License$ 3,795

Search
Thought Leadership and Analyst Meet


Our Clients
Related Reports
- India Kids Watches Market (2026-2032) | Strategy, Consumer Insights, Analysis, Investment Trends, Opportunities, Growth, Size, Share, Industry, Revenue, Segments, Value, Segmentation, Supply, Forecast, Restraints, Outlook, Competition, Drivers, Trends, Demand, Pricing Analysis, Competitive, Strategic Insights, Companies, Challenges
- Saudi Arabia Core Assurance Service Market (2025-2031) | Strategy, Consumer Insights, Analysis, Investment Trends, Opportunities, Growth, Size, Share, Industry, Revenue, Segments, Value, Segmentation, Supply, Forecast, Restraints, Outlook, Competition, Drivers, Trends, Demand, Pricing Analysis, Competitive, Strategic Insights, Companies, Challenges
- Romania Uninterruptible Power Supply (UPS) Market (2026-2032) | Industry, Analysis, Revenue, Size, Forecast, Outlook, Value, Trends, Share, Growth & Companies
- Saudi Arabia Car Window Tinting Film, Paint Protection Film (PPF), and Ceramic Coating Market (2025-2031) | Strategy, Consumer Insights, Analysis, Investment Trends, Opportunities, Growth, Size, Share, Industry, Revenue, Segments, Value, Segmentation, Supply, Forecast, Restraints, Outlook, Competition, Drivers, Trends, Demand, Pricing Analysis, Competitive, Strategic Insights, Companies, Challenges
- South Africa Stationery Market (2025-2031) | Share, Size, Industry, Value, Growth, Revenue, Analysis, Trends, Segmentation & Outlook
- Afghanistan Rocking Chairs And Adirondack Chairs Market (2026-2032) | Size & Revenue, Competitive Landscape, Share, Segmentation, Industry, Value, Outlook, Analysis, Trends, Growth, Forecast, Companies
- Afghanistan Apparel Market (2026-2032) | Growth, Outlook, Industry, Segmentation, Forecast, Size, Companies, Trends, Value, Share, Analysis & Revenue
- Canada Oil and Gas Market (2026-2032) | Share, Segmentation, Value, Industry, Trends, Forecast, Analysis, Size & Revenue, Growth, Competitive Landscape, Outlook, Companies
- Germany Breakfast Food Market (2026-2032) | Industry, Share, Growth, Size, Companies, Value, Analysis, Revenue, Trends, Forecast & Outlook
- Australia Briquette Market (2025-2031) | Growth, Size, Revenue, Forecast, Analysis, Trends, Value, Share, Industry & Companies
Industry Events and Analyst Meet

Smart Production Solutions Guangzhou 2026

Stationery & Paper Expo Saudi Arabia 2026

Kids & Toys Expo Saudi Arabia 2026

Gifts & Homeware Expo Saudi Arabia 2026

Smart Home Expo 2026
Whitepaper
- Middle East & Africa Commercial Security Market Click here to view more.
- Middle East & Africa Fire Safety Systems & Equipment Market Click here to view more.
- GCC Drone Market Click here to view more.
- Middle East Lighting Fixture Market Click here to view more.
- GCC Physical & Perimeter Security Market Click here to view more.
6WResearch In News
- Doha a strategic location for EV manufacturing hub: IPA Qatar
- Demand for luxury TVs surging in the GCC, says Samsung
- Empowering Growth: The Thriving Journey of Bangladesh’s Cable Industry
- Demand for luxury TVs surging in the GCC, says Samsung
- Video call with a traditional healer? Once unthinkable, it’s now common in South Africa
- Intelligent Buildings To Smooth GCC’s Path To Net Zero