Bolivia Chlorine Market (2025-2031) | Industry, Value, Analysis, Revenue, Companies, Size, Growth, Forecast, Outlook, Segmentation, Share & Trends
Market Forecast By Application (EDC/PVC, Isocyanates and Oxygenates, Chloromethanes, Solvents and Epichlorohydrin, Inorganic Chemicals, Other Applications), By End-user (Water Treatment, Pharmaceutical, Chemicals, Paper and Pulp, Plastic, Pesticides, Other) And Competitive Landscape
| Product Code: ETC4820592 | Publication Date: Nov 2023 | Updated Date: Nov 2025 | Product Type: Market Research Report | |
| Publisher: 6Wresearch | Author: Sachin Kumar Rai | No. of Pages: 60 | No. of Figures: 30 | No. of Tables: 5 |
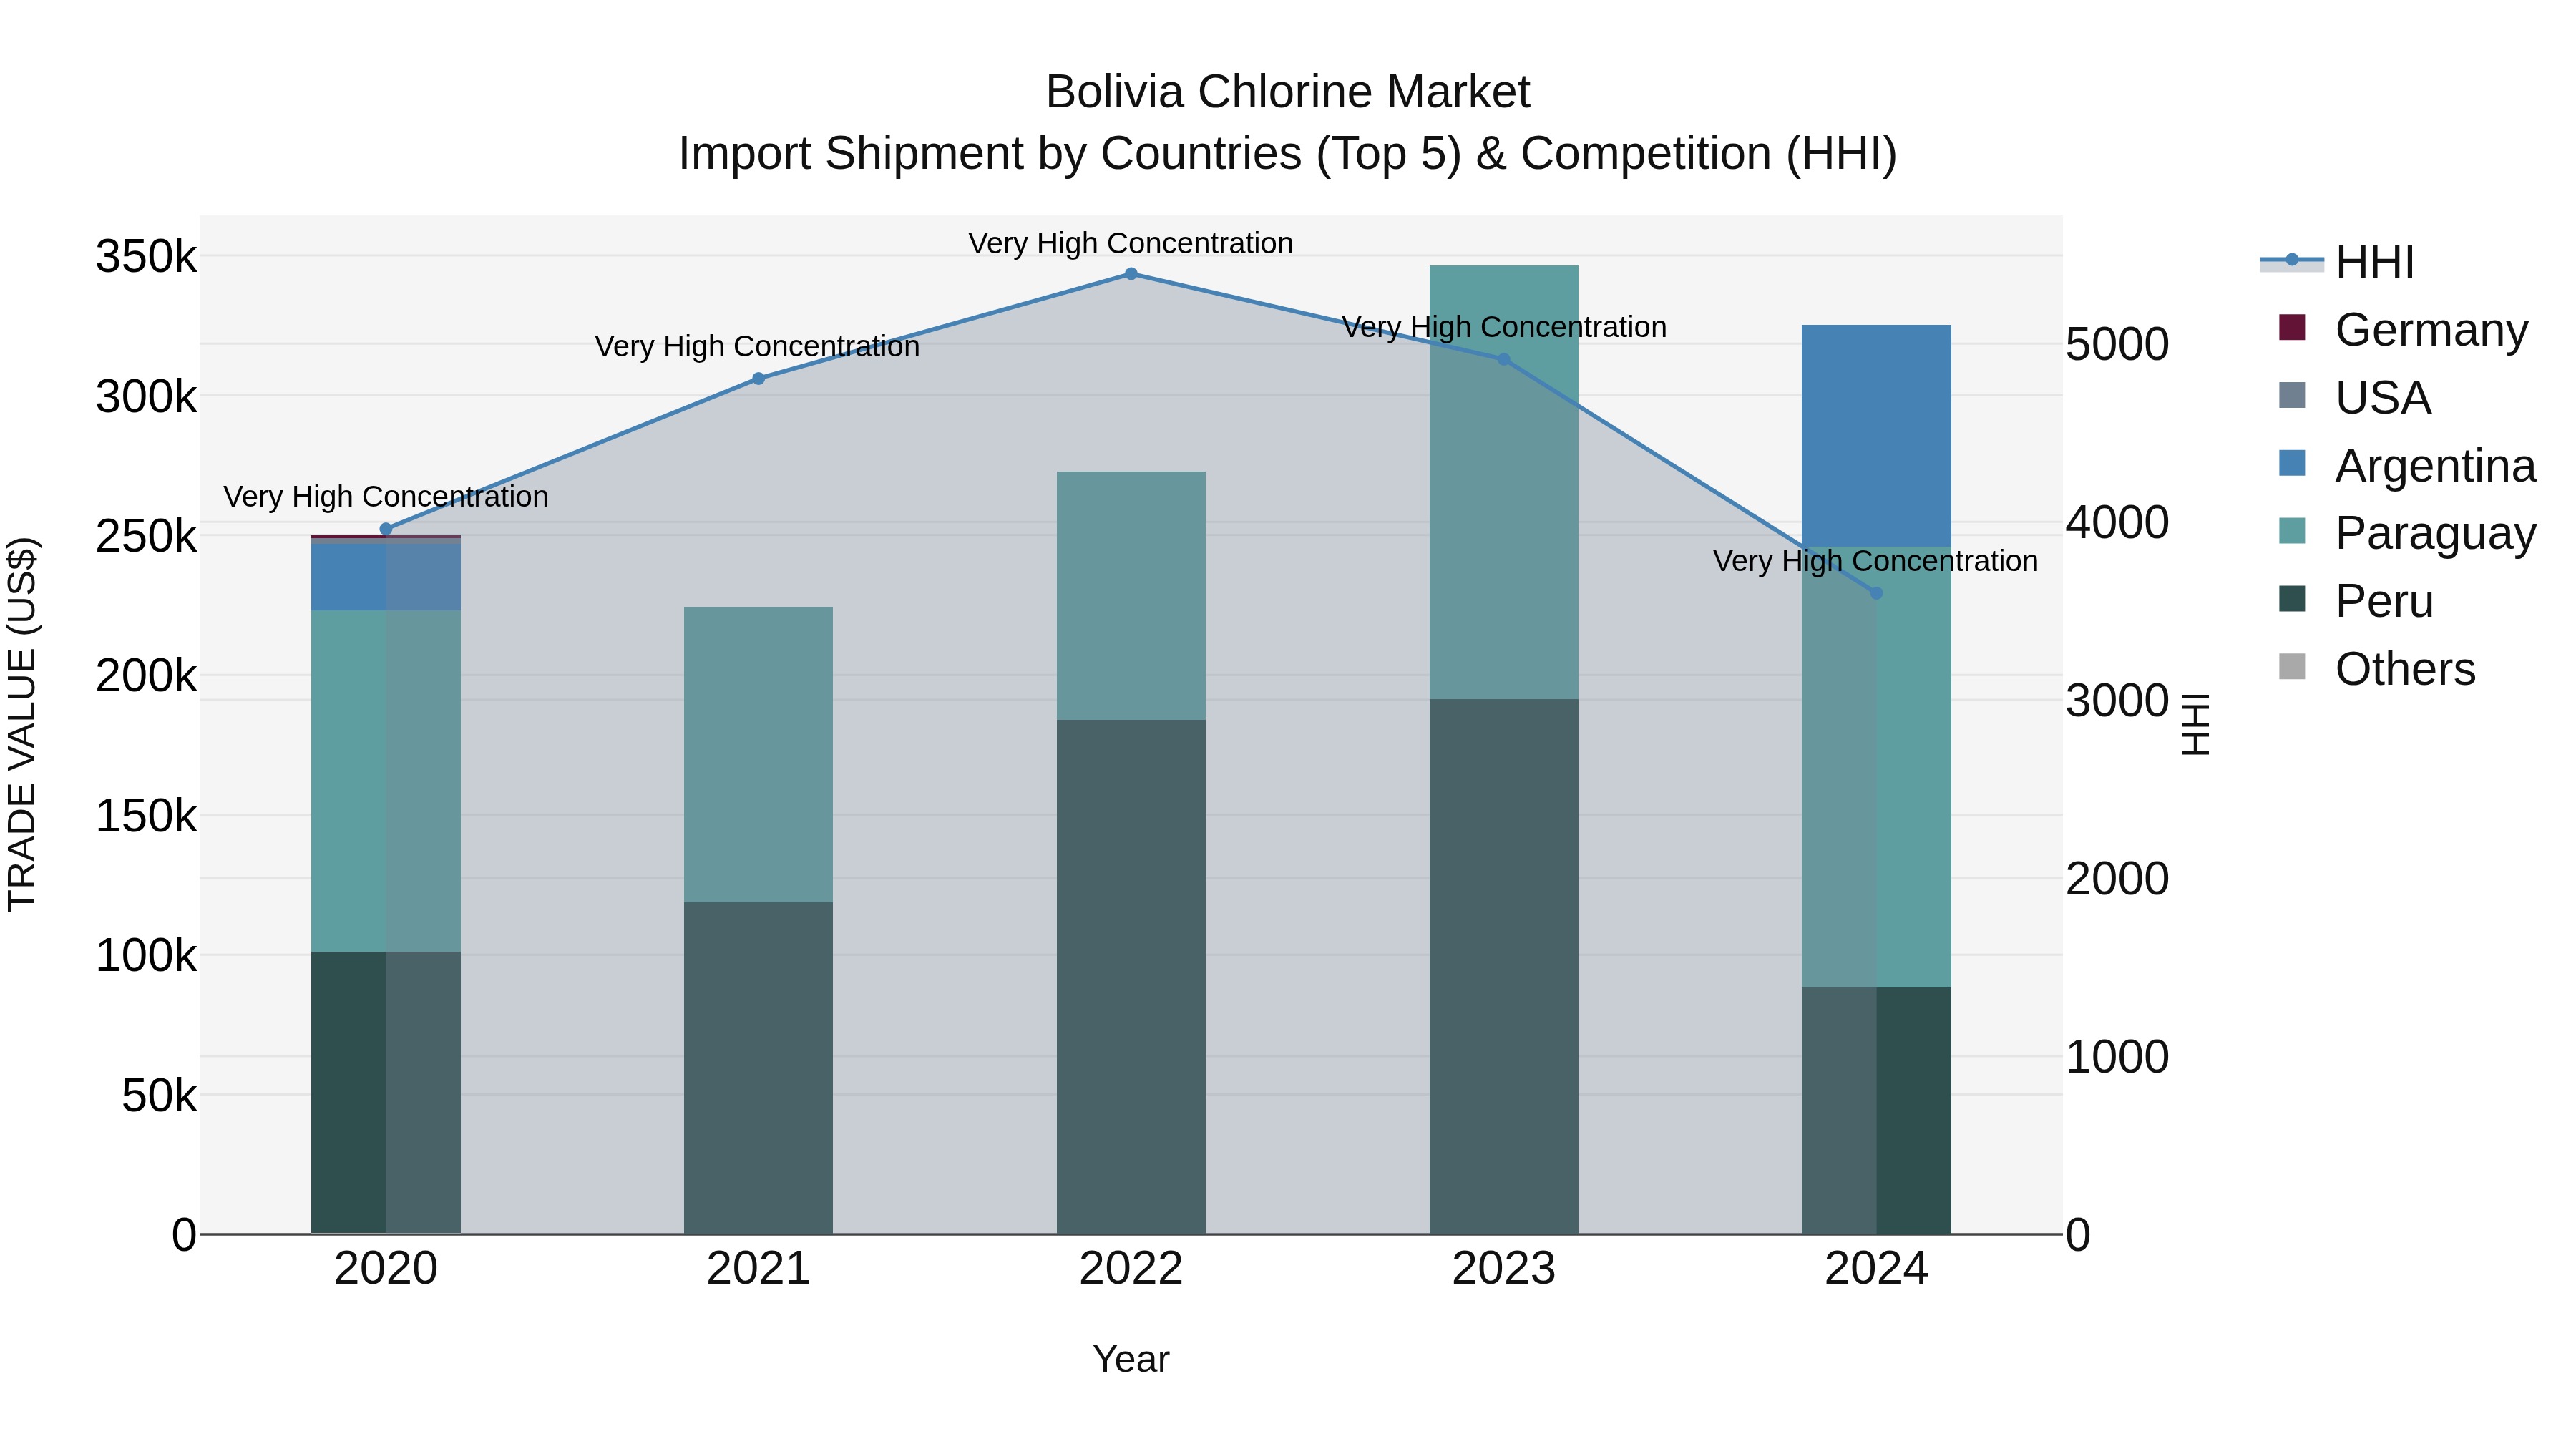
Bolivia Chlorine Market Top 5 Importing Countries and Market Competition (HHI) Analysis
Bolivia chlorine import market in 2024 continued to be dominated by a small number of top exporting countries, with Paraguay, Peru, Argentina, China, and Germany leading the way. The high Herfindahl-Hirschman Index (HHI) indicates a concentrated market. Despite a slight decline in growth rate from 2023 to 2024, the compound annual growth rate (CAGR) over the past four years remained strong at 6.81%. This data suggests a stable yet competitive market for chlorine imports in Bolivia, with opportunities for both domestic and international suppliers to excel.
Bolivia Chlorine Market Overview
The chloroform market in Bolivia is influenced by its use as a solvent in chemical synthesis and industrial processes. Chloroform is used in pharmaceuticals, agrochemicals, and laboratory applications. The market dynamics are affected by regulatory changes and the demand for chloroform in various chemical and manufacturing processes.
Drivers of the market
The Bolivia chlorine market is driven by its use in water treatment, disinfection, and chemical manufacturing. The demand for safe and clean water and the growth of the chemical industry further support market growth.
Challenges of the market
The chlorine market in Bolivia faces several challenges primarily related to environmental regulations and safety concerns. Chlorine is a vital chemical used in various industries, including water treatment and pharmaceuticals, but its production and use come with significant environmental impacts, including potential hazards to both human health and ecosystems. The market must navigate stringent environmental regulations and ensure compliance with safety standards to minimize risks associated with chlorine handling and disposal. Additionally, fluctuations in chlorine production costs and competition from alternative chemicals can impact market stability and growth.
Government Policy of the market
The chlorine market in Bolivia is regulated to ensure the safe handling and use of chlorine in various industrial applications. The government imposes standards for the production, storage, and transportation of chlorine to prevent accidents and environmental contamination. Import regulations require compliance with local safety standards, while policies support the development of local production capabilities and advancements in chlorine technology.
Key Highlights of the Report:
- Bolivia Chlorine Market Outlook
- Market Size of Bolivia Chlorine Market, 2024
- Forecast of Bolivia Chlorine Market, 2031
- Historical Data and Forecast of Bolivia Chlorine Revenues & Volume for the Period 2021-2031
- Bolivia Chlorine Market Trend Evolution
- Bolivia Chlorine Market Drivers and Challenges
- Bolivia Chlorine Price Trends
- Bolivia Chlorine Porter`s Five Forces
- Bolivia Chlorine Industry Life Cycle
- Historical Data and Forecast of Bolivia Chlorine Market Revenues & Volume By Application for the Period 2021-2031
- Historical Data and Forecast of Bolivia Chlorine Market Revenues & Volume By EDC/PVC for the Period 2021-2031
- Historical Data and Forecast of Bolivia Chlorine Market Revenues & Volume By Isocyanates and Oxygenates for the Period 2021-2031
- Historical Data and Forecast of Bolivia Chlorine Market Revenues & Volume By Chloromethanes for the Period 2021-2031
- Historical Data and Forecast of Bolivia Chlorine Market Revenues & Volume By Solvents and Epichlorohydrin for the Period 2021-2031
- Historical Data and Forecast of Bolivia Chlorine Market Revenues & Volume By Inorganic Chemicals for the Period 2021-2031
- Historical Data and Forecast of Bolivia Chlorine Market Revenues & Volume By Other Applications for the Period 2021-2031
- Historical Data and Forecast of Bolivia Chlorine Market Revenues & Volume By End-user for the Period 2021-2031
- Historical Data and Forecast of Bolivia Chlorine Market Revenues & Volume By Water Treatment for the Period 2021-2031
- Historical Data and Forecast of Bolivia Chlorine Market Revenues & Volume By Pharmaceutical for the Period 2021-2031
- Historical Data and Forecast of Bolivia Chlorine Market Revenues & Volume By Chemicals for the Period 2021-2031
- Historical Data and Forecast of Bolivia Chlorine Market Revenues & Volume By Paper and Pulp for the Period 2021-2031
- Historical Data and Forecast of Bolivia Chlorine Market Revenues & Volume By Plastic for the Period 2021-2031
- Historical Data and Forecast of Bolivia Chlorine Market Revenues & Volume By Pesticides for the Period 2021-2031
- Historical Data and Forecast of Bolivia Chlorine Market Revenues & Volume By Other for the Period 2021-2031
- Bolivia Chlorine Import Export Trade Statistics
- Market Opportunity Assessment By Application
- Market Opportunity Assessment By End-user
- Bolivia Chlorine Top Companies Market Share
- Bolivia Chlorine Competitive Benchmarking By Technical and Operational Parameters
- Bolivia Chlorine Company Profiles
- Bolivia Chlorine Key Strategic Recommendations
Frequently Asked Questions About the Market Study (FAQs):
6Wresearch actively monitors the Bolivia Chlorine Market and publishes its comprehensive annual report, highlighting emerging trends, growth drivers, revenue analysis, and forecast outlook. Our insights help businesses to make data-backed strategic decisions with ongoing market dynamics. Our analysts track relevent industries related to the Bolivia Chlorine Market, allowing our clients with actionable intelligence and reliable forecasts tailored to emerging regional needs.
Yes, we provide customisation as per your requirements. To learn more, feel free to contact us on sales@6wresearch.com
1 Executive Summary |
2 Introduction |
2.1 Key Highlights of the Report |
2.2 Report Description |
2.3 Market Scope & Segmentation |
2.4 Research Methodology |
2.5 Assumptions |
3 Bolivia Chlorine Market Overview |
3.1 Bolivia Country Macro Economic Indicators |
3.2 Bolivia Chlorine Market Revenues & Volume, 2021 & 2031F |
3.3 Bolivia Chlorine Market - Industry Life Cycle |
3.4 Bolivia Chlorine Market - Porter's Five Forces |
3.5 Bolivia Chlorine Market Revenues & Volume Share, By Application, 2021 & 2031F |
3.6 Bolivia Chlorine Market Revenues & Volume Share, By End-user, 2021 & 2031F |
4 Bolivia Chlorine Market Dynamics |
4.1 Impact Analysis |
4.2 Market Drivers |
4.2.1 Increasing demand for water treatment and sanitation projects in Bolivia |
4.2.2 Growth in the chemical industry in Bolivia |
4.2.3 Government initiatives promoting the use of chlorine for public health and hygiene |
4.3 Market Restraints |
4.3.1 Fluctuating prices of raw materials used in chlorine production |
4.3.2 Environmental concerns related to the use of chlorine |
4.3.3 Regulatory challenges and compliance requirements in the chlorine industry |
5 Bolivia Chlorine Market Trends |
6 Bolivia Chlorine Market Segmentations |
6.1 Bolivia Chlorine Market, By Application |
6.1.1 Overview and Analysis |
6.1.2 Bolivia Chlorine Market Revenues & Volume, By EDC/PVC, 2021-2031F |
6.1.3 Bolivia Chlorine Market Revenues & Volume, By Isocyanates and Oxygenates, 2021-2031F |
6.1.4 Bolivia Chlorine Market Revenues & Volume, By Chloromethanes, 2021-2031F |
6.1.5 Bolivia Chlorine Market Revenues & Volume, By Solvents and Epichlorohydrin, 2021-2031F |
6.1.6 Bolivia Chlorine Market Revenues & Volume, By Inorganic Chemicals, 2021-2031F |
6.1.7 Bolivia Chlorine Market Revenues & Volume, By Other Applications, 2021-2031F |
6.2 Bolivia Chlorine Market, By End-user |
6.2.1 Overview and Analysis |
6.2.2 Bolivia Chlorine Market Revenues & Volume, By Water Treatment, 2021-2031F |
6.2.3 Bolivia Chlorine Market Revenues & Volume, By Pharmaceutical, 2021-2031F |
6.2.4 Bolivia Chlorine Market Revenues & Volume, By Chemicals, 2021-2031F |
6.2.5 Bolivia Chlorine Market Revenues & Volume, By Paper and Pulp, 2021-2031F |
6.2.6 Bolivia Chlorine Market Revenues & Volume, By Plastic, 2021-2031F |
6.2.7 Bolivia Chlorine Market Revenues & Volume, By Pesticides, 2021-2031F |
7 Bolivia Chlorine Market Import-Export Trade Statistics |
7.1 Bolivia Chlorine Market Export to Major Countries |
7.2 Bolivia Chlorine Market Imports from Major Countries |
8 Bolivia Chlorine Market Key Performance Indicators |
8.1 Adoption rate of chlorine in water treatment projects in Bolivia |
8.2 Number of new applications or industries utilizing chlorine in Bolivia |
8.3 Investment in research and development for chlorine-related technologies and products |
8.4 Environmental impact assessment and sustainability initiatives in the chlorine sector |
8.5 Compliance rate with safety and quality standards in chlorine production and usage |
9 Bolivia Chlorine Market - Opportunity Assessment |
9.1 Bolivia Chlorine Market Opportunity Assessment, By Application, 2021 & 2031F |
9.2 Bolivia Chlorine Market Opportunity Assessment, By End-user, 2021 & 2031F |
10 Bolivia Chlorine Market - Competitive Landscape |
10.1 Bolivia Chlorine Market Revenue Share, By Companies, 2024 |
10.2 Bolivia Chlorine Market Competitive Benchmarking, By Operating and Technical Parameters |
11 Company Profiles |
12 Recommendations | 13 Disclaimer |
Global Go To Market Strategy - 2030
Export potential enables firms to identify high-growth global markets with greater confidence by combining advanced trade intelligence with a structured quantitative methodology. The framework analyzes emerging demand trends and country-level import patterns while integrating macroeconomic and trade datasets such as GDP and population forecasts, bilateral import–export flows, tariff structures, elasticity differentials between developed and developing economies, geographic distance, and import demand projections. Using weighted trade values from 2020–2024 as the base period to project country-to-country export potential for 2030, these inputs are operationalized through calculated drivers such as gravity model parameters, tariff impact factors, and projected GDP per-capita growth. Through an analysis of hidden potentials, demand hotspots, and market conditions that are most favorable to success, this method enables firms to focus on target countries, maximize returns, and global expansion with data, backed by accuracy.
By factoring in the projected importer demand gap that is currently unmet and could be potential opportunity, it identifies the potential for the Exporter (Country) among 190 countries, against the general trade analysis, which identifies the biggest importer or exporter.
To discover high-growth global markets and optimize your business strategy:
Click Here
Pricing
- Single User License$ 1,995
- Department License$ 2,400
- Site License$ 3,120
- Global License$ 3,795

Leadership Perspectives from Industry Events
Search
Thought Leadership and Analyst Meet


Our Clients
6WResearch In News
- India Export Attractiveness Tracker 2026
- India Air Conditioner Market Set for Strong Rebound in 2026 After Weather-Led Correction and GST-Driven Recovery: 6Wresearch
- ADAS in India: How Automatic Emergency Braking, Blind Spot Detection & Driver Monitoring are Transforming Road Safety
- Doha a strategic location for EV manufacturing hub: IPA Qatar
- Demand for luxury TVs surging in the GCC, says Samsung
- Empowering Growth: The Thriving Journey of Bangladesh’s Cable Industry
Latest Reports
- Nicaragua RPG Gaming Market (2026-2032)
- New Zealand RPG Gaming Market (2026-2032)
- Netherlands RPG Gaming Market (2026-2032)
- Nauru RPG Gaming Market (2026-2032)
- Namibia RPG Gaming Market (2026-2032)
- Mozambique RPG Gaming Market (2026-2032)
- Montenegro RPG Gaming Market (2026-2032)
- Mongolia RPG Gaming Market (2026-2032)
- Monaco RPG Gaming Market (2026-2032)
- Micronesia RPG Gaming Market (2026-2032)
Industry Events and Analyst Meet

EV India Expo 2026

HIMTEX 2026

India Refining Summit 2026

India EV Show 2026

EV tech India Expo 2026
Whitepaper
- Middle East & Africa Commercial Security Market Click here to view more.
- Middle East & Africa Fire Safety Systems & Equipment Market Click here to view more.
- GCC Drone Market Click here to view more.
- Middle East Lighting Fixture Market Click here to view more.
- GCC Physical & Perimeter Security Market Click here to view more.