Bolivia Inks Market (2025-2031) | Analysis, Size, Forecast, Industry, Value, Share, Revenue, Trends, Segmentation, Outlook, Companies & Growth
Market Forecast By Type (Non-printing, Printing), By Formulating Technology (Oil-based, Solvent-based, Water-based, UV-cured, Others), By Applications (Packaging, Publication & Commercial, Security, Ceramic Tiles, Tags & Labels, Textiles, Consumer) And Competitive Landscape
| Product Code: ETC5523478 | Publication Date: Nov 2023 | Updated Date: Nov 2025 | Product Type: Market Research Report | |
| Publisher: 6Wresearch | Author: Vasudha | No. of Pages: 60 | No. of Figures: 30 | No. of Tables: 5 |
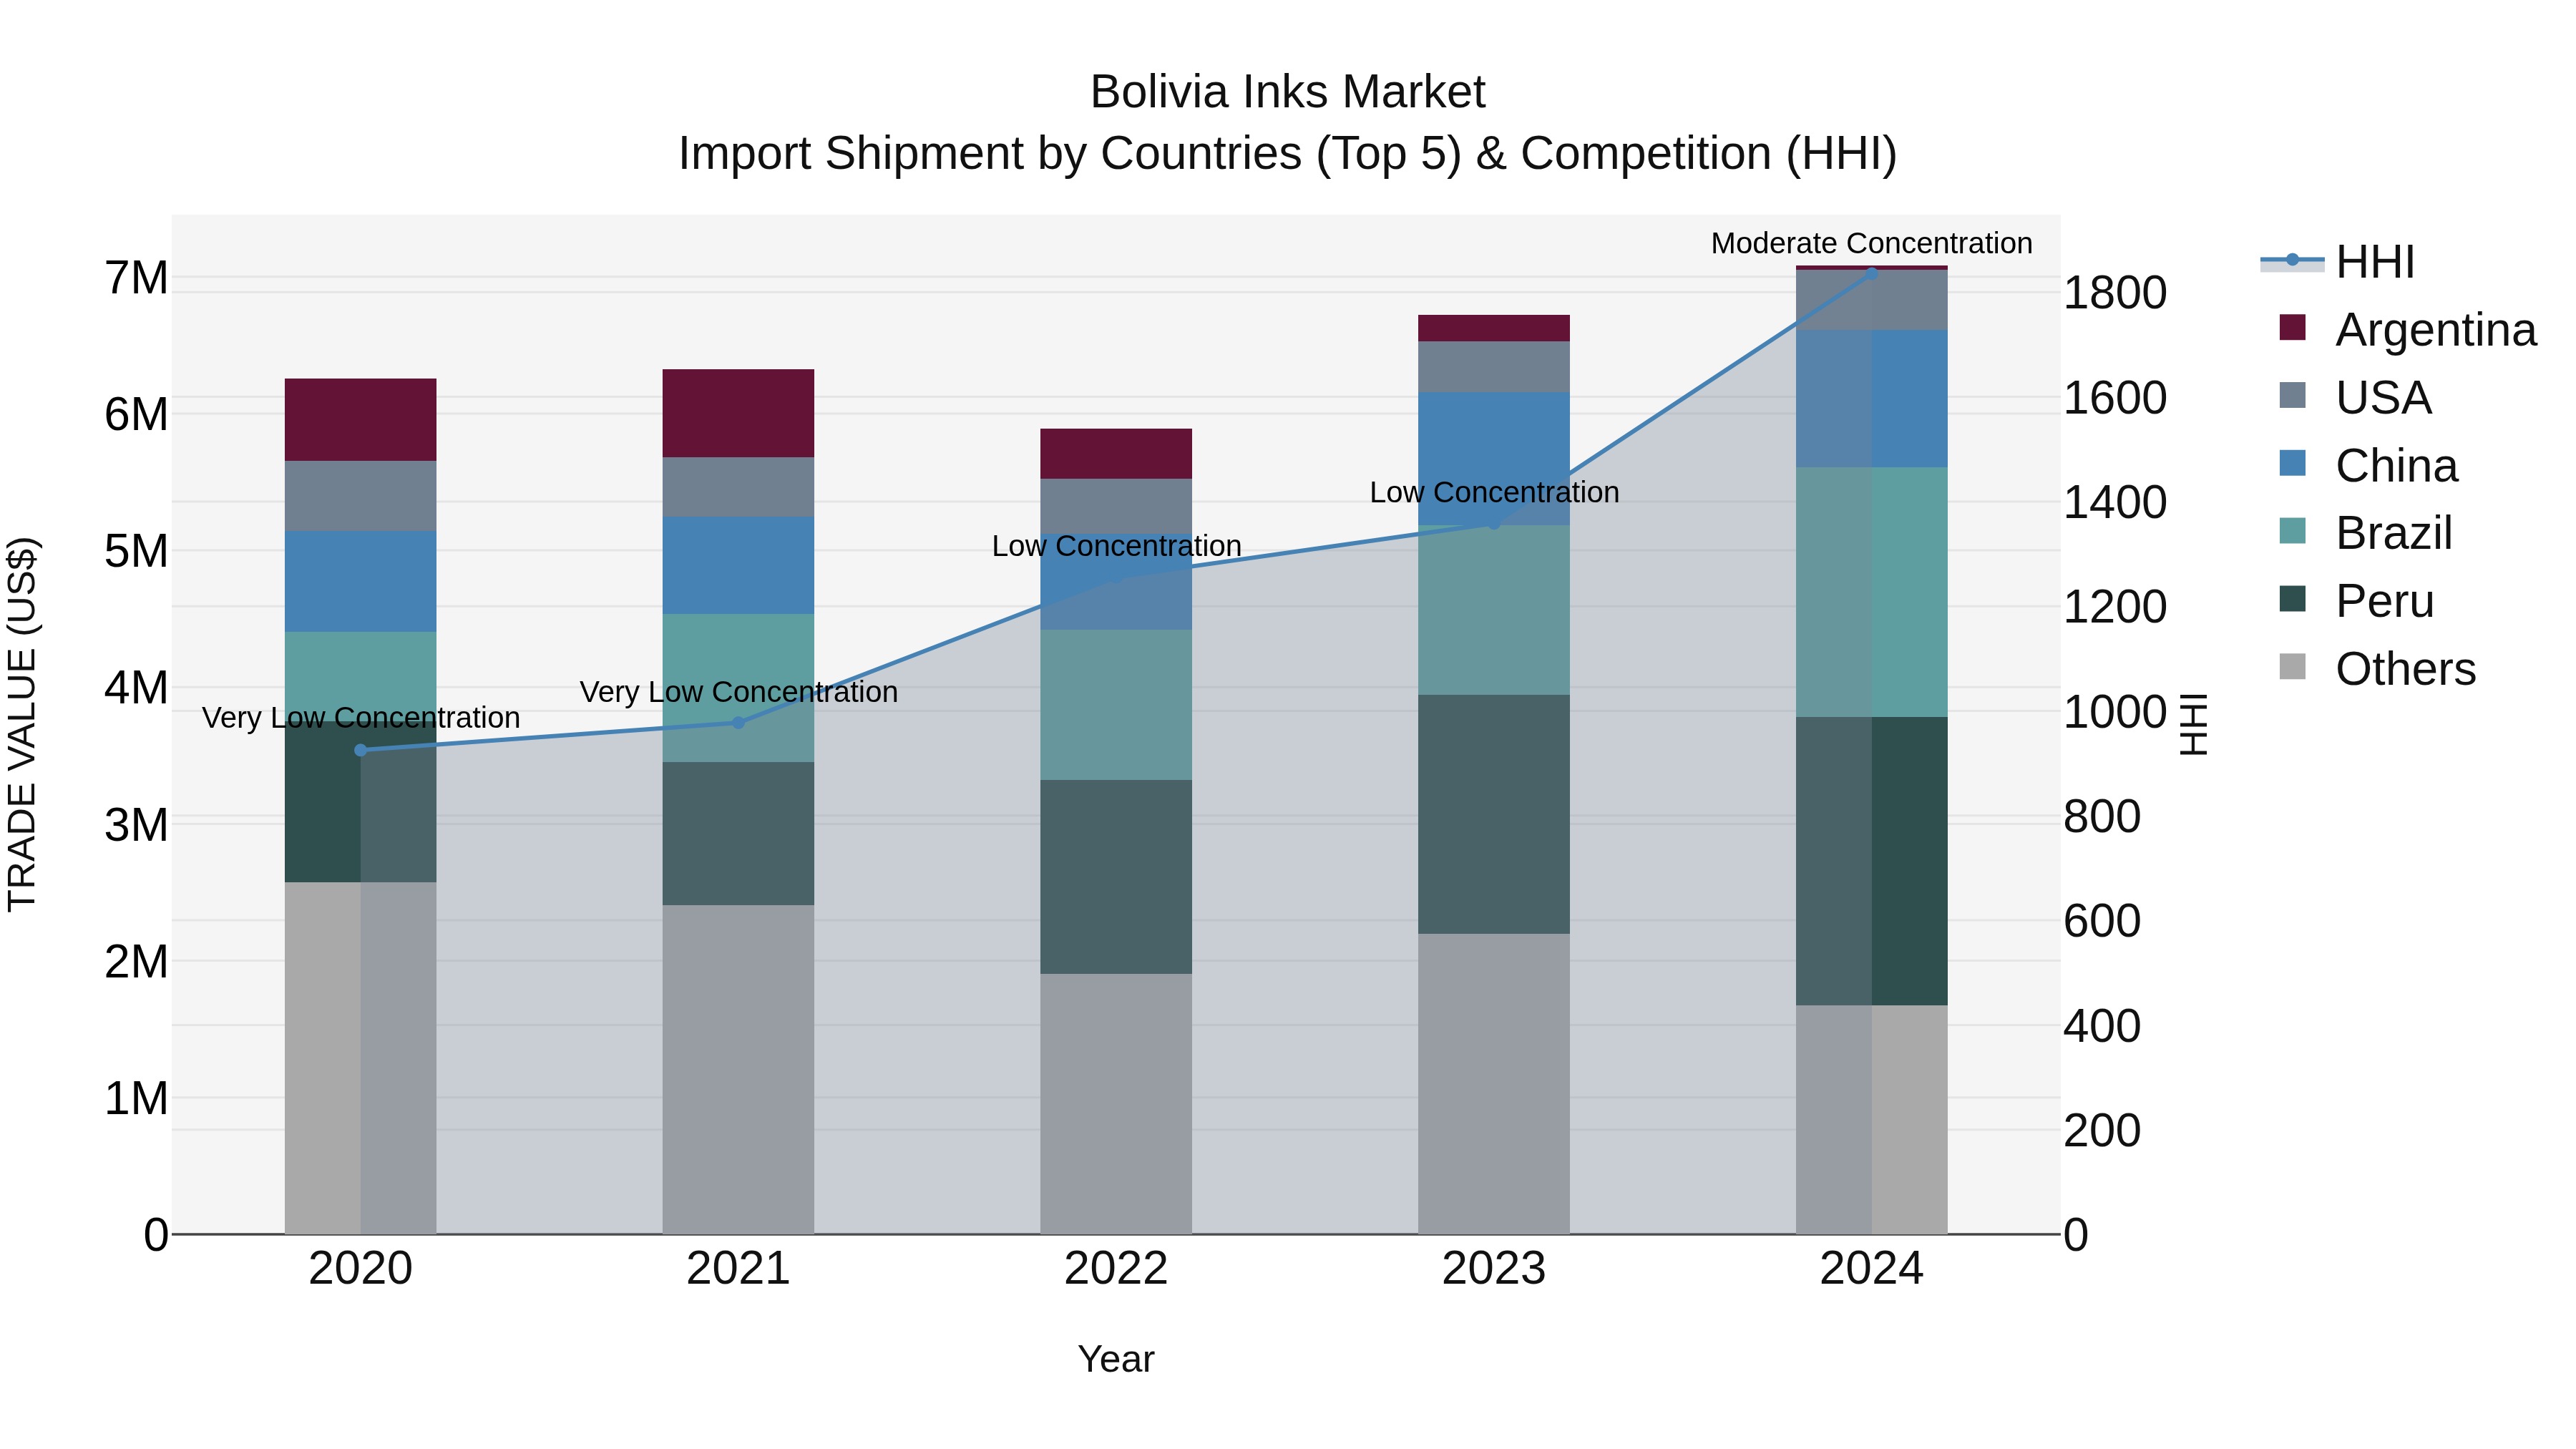
Bolivia Inks Market Top 5 Importing Countries and Market Competition (HHI) Analysis
Bolivia ink import market saw a shift towards moderate concentration in 2024, with top suppliers including Peru, Brazil, China, USA, and Mexico. The 5.36% growth rate from 2023 to 2024 reflects increasing demand. Despite the moderate concentration, the market remains diverse with these key players. The 3.14% CAGR from 2020 to 2024 indicates steady growth in the ink import sector. Bolivia reliance on various countries for ink imports suggests a resilient and adaptable market landscape.
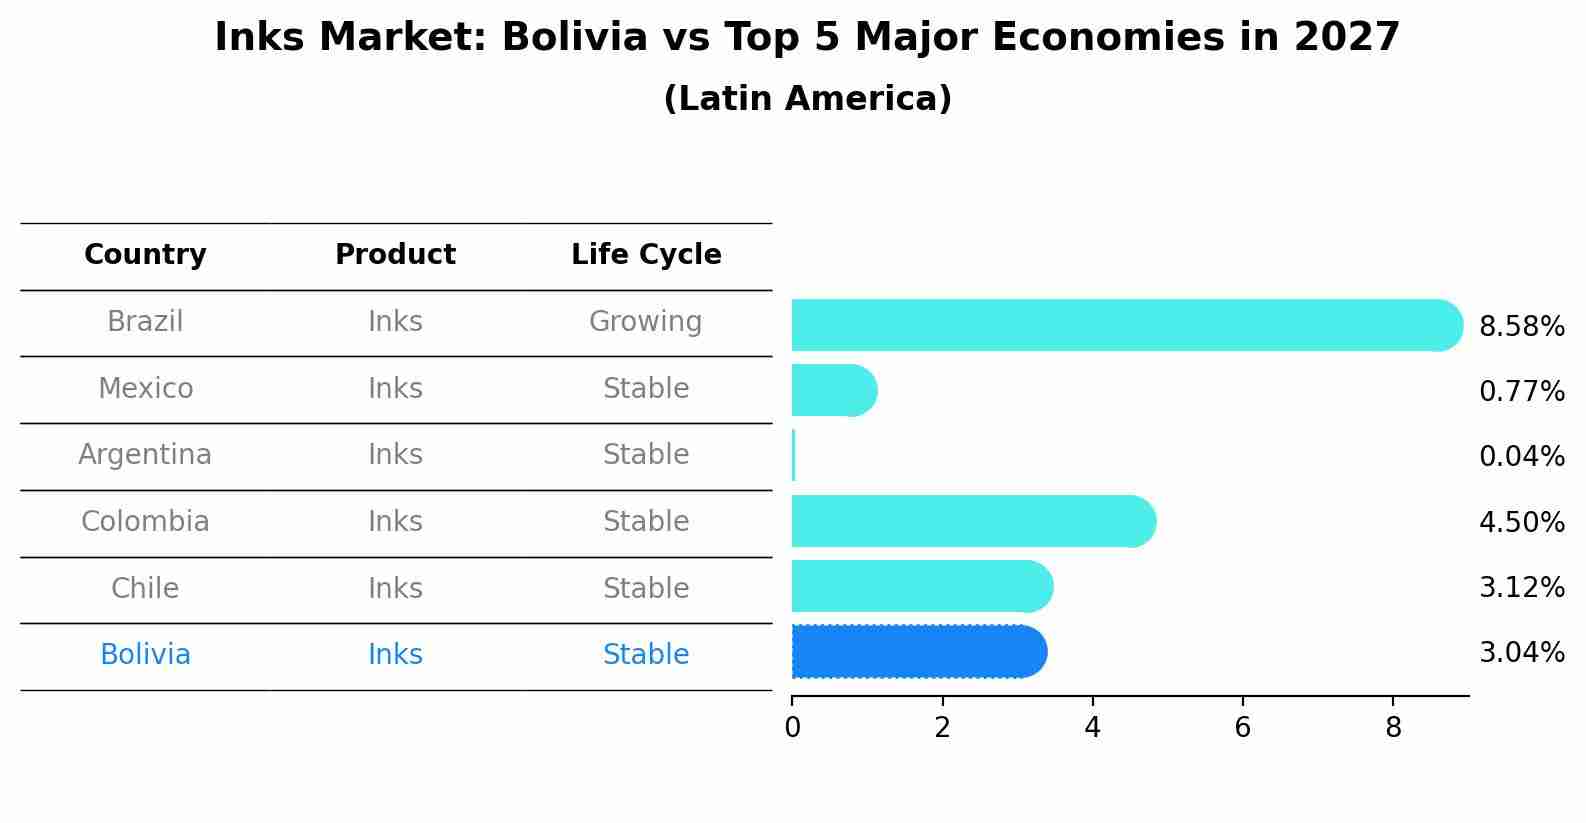
Inks Market: Bolivia vs Top 5 Major Economies in 2027 (Latin America)
By 2027, Bolivia's Inks market is forecasted to achieve a stable growth rate of 3.04%, with Brazil leading the Latin America region, followed by Mexico, Argentina, Colombia and Chile.
Bolivia Inks Market Overview
The market for inks in Bolivia encompasses a wide range of applications, including commercial printing, packaging, and textiles. The market is expanding due to technological advancements and increased demand for specialty inks.
Drivers of the market
The inks market in Bolivia is supported by the increasing demand for diverse printing applications, including packaging, labels, and advertising materials. Inks are used in various printing technologies, such as offset, flexographic, and digital printing, to produce high-quality printed products. As Bolivia`s printing and packaging industries grow and the need for vibrant and durable prints rises, the demand for inks increases. Additionally, innovations in ink technology and a focus on improving print performance and sustainability drive market growth.
Challenges of the market
The inks market in Bolivia faces challenges similar to those in the ink market, including high import costs and limited local production capabilities. There is a need for investment in technology and infrastructure to support the production and application of various ink products. Additionally, limited market awareness and technical expertise affect the growth of the inks market.
Government Policy of the market
For the broader inks market, Bolivias policies focus on similar areas: ensuring product safety, quality, and environmental responsibility. Regulations may cover a range of ink types and applications, setting standards for performance and safety. The government may provide support for innovations that enhance ink formulations and reduce environmental impacts, promoting sustainable practices in the industry.
Key Highlights of the Report:
- Bolivia Inks Market Outlook
- Market Size of Bolivia Inks Market, 2024
- Forecast of Bolivia Inks Market, 2031
- Historical Data and Forecast of Bolivia Inks Revenues & Volume for the Period 2021-2031
- Bolivia Inks Market Trend Evolution
- Bolivia Inks Market Drivers and Challenges
- Bolivia Inks Price Trends
- Bolivia Inks Porter`s Five Forces
- Bolivia Inks Industry Life Cycle
- Historical Data and Forecast of Bolivia Inks Market Revenues & Volume By Type for the Period 2021-2031
- Historical Data and Forecast of Bolivia Inks Market Revenues & Volume By Non-printing for the Period 2021-2031
- Historical Data and Forecast of Bolivia Inks Market Revenues & Volume By Printing for the Period 2021-2031
- Historical Data and Forecast of Bolivia Inks Market Revenues & Volume By Formulating Technology for the Period 2021-2031
- Historical Data and Forecast of Bolivia Inks Market Revenues & Volume By Oil-based for the Period 2021-2031
- Historical Data and Forecast of Bolivia Inks Market Revenues & Volume By Solvent-based for the Period 2021-2031
- Historical Data and Forecast of Bolivia Inks Market Revenues & Volume By Water-based for the Period 2021-2031
- Historical Data and Forecast of Bolivia Inks Market Revenues & Volume By UV-cured for the Period 2021-2031
- Historical Data and Forecast of Bolivia Inks Market Revenues & Volume By Others for the Period 2021-2031
- Historical Data and Forecast of Bolivia Inks Market Revenues & Volume By Applications for the Period 2021-2031
- Historical Data and Forecast of Bolivia Inks Market Revenues & Volume By Packaging for the Period 2021-2031
- Historical Data and Forecast of Bolivia Inks Market Revenues & Volume By Publication & Commercial for the Period 2021-2031
- Historical Data and Forecast of Bolivia Inks Market Revenues & Volume By Security for the Period 2021-2031
- Historical Data and Forecast of Bolivia Inks Market Revenues & Volume By Ceramic Tiles for the Period 2021-2031
- Historical Data and Forecast of Bolivia Inks Market Revenues & Volume By Tags & Labels for the Period 2021-2031
- Historical Data and Forecast of Bolivia Inks Market Revenues & Volume By Textiles for the Period 2021-2031
- Historical Data and Forecast of Bolivia Inks Market Revenues & Volume By Consumer for the Period 2021-2031
- Bolivia Inks Import Export Trade Statistics
- Market Opportunity Assessment By Type
- Market Opportunity Assessment By Formulating Technology
- Market Opportunity Assessment By Applications
- Bolivia Inks Top Companies Market Share
- Bolivia Inks Competitive Benchmarking By Technical and Operational Parameters
- Bolivia Inks Company Profiles
- Bolivia Inks Key Strategic Recommendations
Frequently Asked Questions About the Market Study (FAQs):
6Wresearch actively monitors the Bolivia Inks Market and publishes its comprehensive annual report, highlighting emerging trends, growth drivers, revenue analysis, and forecast outlook. Our insights help businesses to make data-backed strategic decisions with ongoing market dynamics. Our analysts track relevent industries related to the Bolivia Inks Market, allowing our clients with actionable intelligence and reliable forecasts tailored to emerging regional needs.
Yes, we provide customisation as per your requirements. To learn more, feel free to contact us on sales@6wresearch.com
1 Executive Summary |
2 Introduction |
2.1 Key Highlights of the Report |
2.2 Report Description |
2.3 Market Scope & Segmentation |
2.4 Research Methodology |
2.5 Assumptions |
3 Bolivia Inks Market Overview |
3.1 Bolivia Country Macro Economic Indicators |
3.2 Bolivia Inks Market Revenues & Volume, 2021 & 2031F |
3.3 Bolivia Inks Market - Industry Life Cycle |
3.4 Bolivia Inks Market - Porter's Five Forces |
3.5 Bolivia Inks Market Revenues & Volume Share, By Type, 2021 & 2031F |
3.6 Bolivia Inks Market Revenues & Volume Share, By Formulating Technology, 2021 & 2031F |
3.7 Bolivia Inks Market Revenues & Volume Share, By Applications, 2021 & 2031F |
4 Bolivia Inks Market Dynamics |
4.1 Impact Analysis |
4.2 Market Drivers |
4.2.1 Increasing demand for eco-friendly and sustainable inks |
4.2.2 Growth in packaging industry in Bolivia |
4.2.3 Technological advancements in ink manufacturing processes |
4.3 Market Restraints |
4.3.1 Fluctuating raw material prices |
4.3.2 Intense competition from imported inks |
4.3.3 Regulatory challenges related to environmental standards |
5 Bolivia Inks Market Trends |
6 Bolivia Inks Market Segmentations |
6.1 Bolivia Inks Market, By Type |
6.1.1 Overview and Analysis |
6.1.2 Bolivia Inks Market Revenues & Volume, By Non-printing, 2021-2031F |
6.1.3 Bolivia Inks Market Revenues & Volume, By Printing, 2021-2031F |
6.2 Bolivia Inks Market, By Formulating Technology |
6.2.1 Overview and Analysis |
6.2.2 Bolivia Inks Market Revenues & Volume, By Oil-based, 2021-2031F |
6.2.3 Bolivia Inks Market Revenues & Volume, By Solvent-based, 2021-2031F |
6.2.4 Bolivia Inks Market Revenues & Volume, By Water-based, 2021-2031F |
6.2.5 Bolivia Inks Market Revenues & Volume, By UV-cured, 2021-2031F |
6.2.6 Bolivia Inks Market Revenues & Volume, By Others, 2021-2031F |
6.3 Bolivia Inks Market, By Applications |
6.3.1 Overview and Analysis |
6.3.2 Bolivia Inks Market Revenues & Volume, By Packaging, 2021-2031F |
6.3.3 Bolivia Inks Market Revenues & Volume, By Publication & Commercial, 2021-2031F |
6.3.4 Bolivia Inks Market Revenues & Volume, By Security, 2021-2031F |
6.3.5 Bolivia Inks Market Revenues & Volume, By Ceramic Tiles, 2021-2031F |
6.3.6 Bolivia Inks Market Revenues & Volume, By Tags & Labels, 2021-2031F |
6.3.7 Bolivia Inks Market Revenues & Volume, By Textiles, 2021-2031F |
7 Bolivia Inks Market Import-Export Trade Statistics |
7.1 Bolivia Inks Market Export to Major Countries |
7.2 Bolivia Inks Market Imports from Major Countries |
8 Bolivia Inks Market Key Performance Indicators |
8.1 Percentage of inks manufactured using eco-friendly materials |
8.2 Market penetration rate of inks in the packaging industry |
8.3 Research and development investment in new ink technologies |
8.4 Customer satisfaction index for ink quality and performance |
8.5 Compliance rate with environmental regulations for ink production |
9 Bolivia Inks Market - Opportunity Assessment |
9.1 Bolivia Inks Market Opportunity Assessment, By Type, 2021 & 2031F |
9.2 Bolivia Inks Market Opportunity Assessment, By Formulating Technology, 2021 & 2031F |
9.3 Bolivia Inks Market Opportunity Assessment, By Applications, 2021 & 2031F |
10 Bolivia Inks Market - Competitive Landscape |
10.1 Bolivia Inks Market Revenue Share, By Companies, 2024 |
10.2 Bolivia Inks Market Competitive Benchmarking, By Operating and Technical Parameters |
11 Company Profiles |
12 Recommendations | 13 Disclaimer |
Global Go To Market Strategy - 2030
Export potential enables firms to identify high-growth global markets with greater confidence by combining advanced trade intelligence with a structured quantitative methodology. The framework analyzes emerging demand trends and country-level import patterns while integrating macroeconomic and trade datasets such as GDP and population forecasts, bilateral import–export flows, tariff structures, elasticity differentials between developed and developing economies, geographic distance, and import demand projections. Using weighted trade values from 2020–2024 as the base period to project country-to-country export potential for 2030, these inputs are operationalized through calculated drivers such as gravity model parameters, tariff impact factors, and projected GDP per-capita growth. Through an analysis of hidden potentials, demand hotspots, and market conditions that are most favorable to success, this method enables firms to focus on target countries, maximize returns, and global expansion with data, backed by accuracy.
By factoring in the projected importer demand gap that is currently unmet and could be potential opportunity, it identifies the potential for the Exporter (Country) among 190 countries, against the general trade analysis, which identifies the biggest importer or exporter.
To discover high-growth global markets and optimize your business strategy:
Click Here
Pricing
- Single User License$ 1,995
- Department License$ 2,400
- Site License$ 3,120
- Global License$ 3,795

Leadership Perspectives from Industry Events
Search
Thought Leadership and Analyst Meet


Our Clients
6WResearch In News
- India Export Attractiveness Tracker 2026
- India Air Conditioner Market Set for Strong Rebound in 2026 After Weather-Led Correction and GST-Driven Recovery: 6Wresearch
- ADAS in India: How Automatic Emergency Braking, Blind Spot Detection & Driver Monitoring are Transforming Road Safety
- Doha a strategic location for EV manufacturing hub: IPA Qatar
- Demand for luxury TVs surging in the GCC, says Samsung
- Empowering Growth: The Thriving Journey of Bangladesh’s Cable Industry
Latest Reports
- Nicaragua RPG Gaming Market (2026-2032)
- New Zealand RPG Gaming Market (2026-2032)
- Netherlands RPG Gaming Market (2026-2032)
- Nauru RPG Gaming Market (2026-2032)
- Namibia RPG Gaming Market (2026-2032)
- Mozambique RPG Gaming Market (2026-2032)
- Montenegro RPG Gaming Market (2026-2032)
- Mongolia RPG Gaming Market (2026-2032)
- Monaco RPG Gaming Market (2026-2032)
- Micronesia RPG Gaming Market (2026-2032)
Industry Events and Analyst Meet

EV India Expo 2026

HIMTEX 2026

India Refining Summit 2026

India EV Show 2026

EV tech India Expo 2026
Whitepaper
- Middle East & Africa Commercial Security Market Click here to view more.
- Middle East & Africa Fire Safety Systems & Equipment Market Click here to view more.
- GCC Drone Market Click here to view more.
- Middle East Lighting Fixture Market Click here to view more.
- GCC Physical & Perimeter Security Market Click here to view more.