Brazil Antimony Market (2025-2031) Outlook | Industry, Revenue, Share, Growth, Companies, Size, Forecast, Value, Trends & Analysis
Market Forecast By Type (Metal Ingot, Antimony Trioxide, Antimony Pentoxide, Alloys, Other), By Application (Flame Retardant, Lead Acid Batteries, Alloy Strengthening Agent, Fiberglass Composites, Catalyst, Other) And Competitive Landscape
| Product Code: ETC087021 | Publication Date: Jun 2021 | Updated Date: Oct 2025 | Product Type: Report | |
| Publisher: 6Wresearch | Author: Ravi Bhandari | No. of Pages: 70 | No. of Figures: 35 | No. of Tables: 5 |
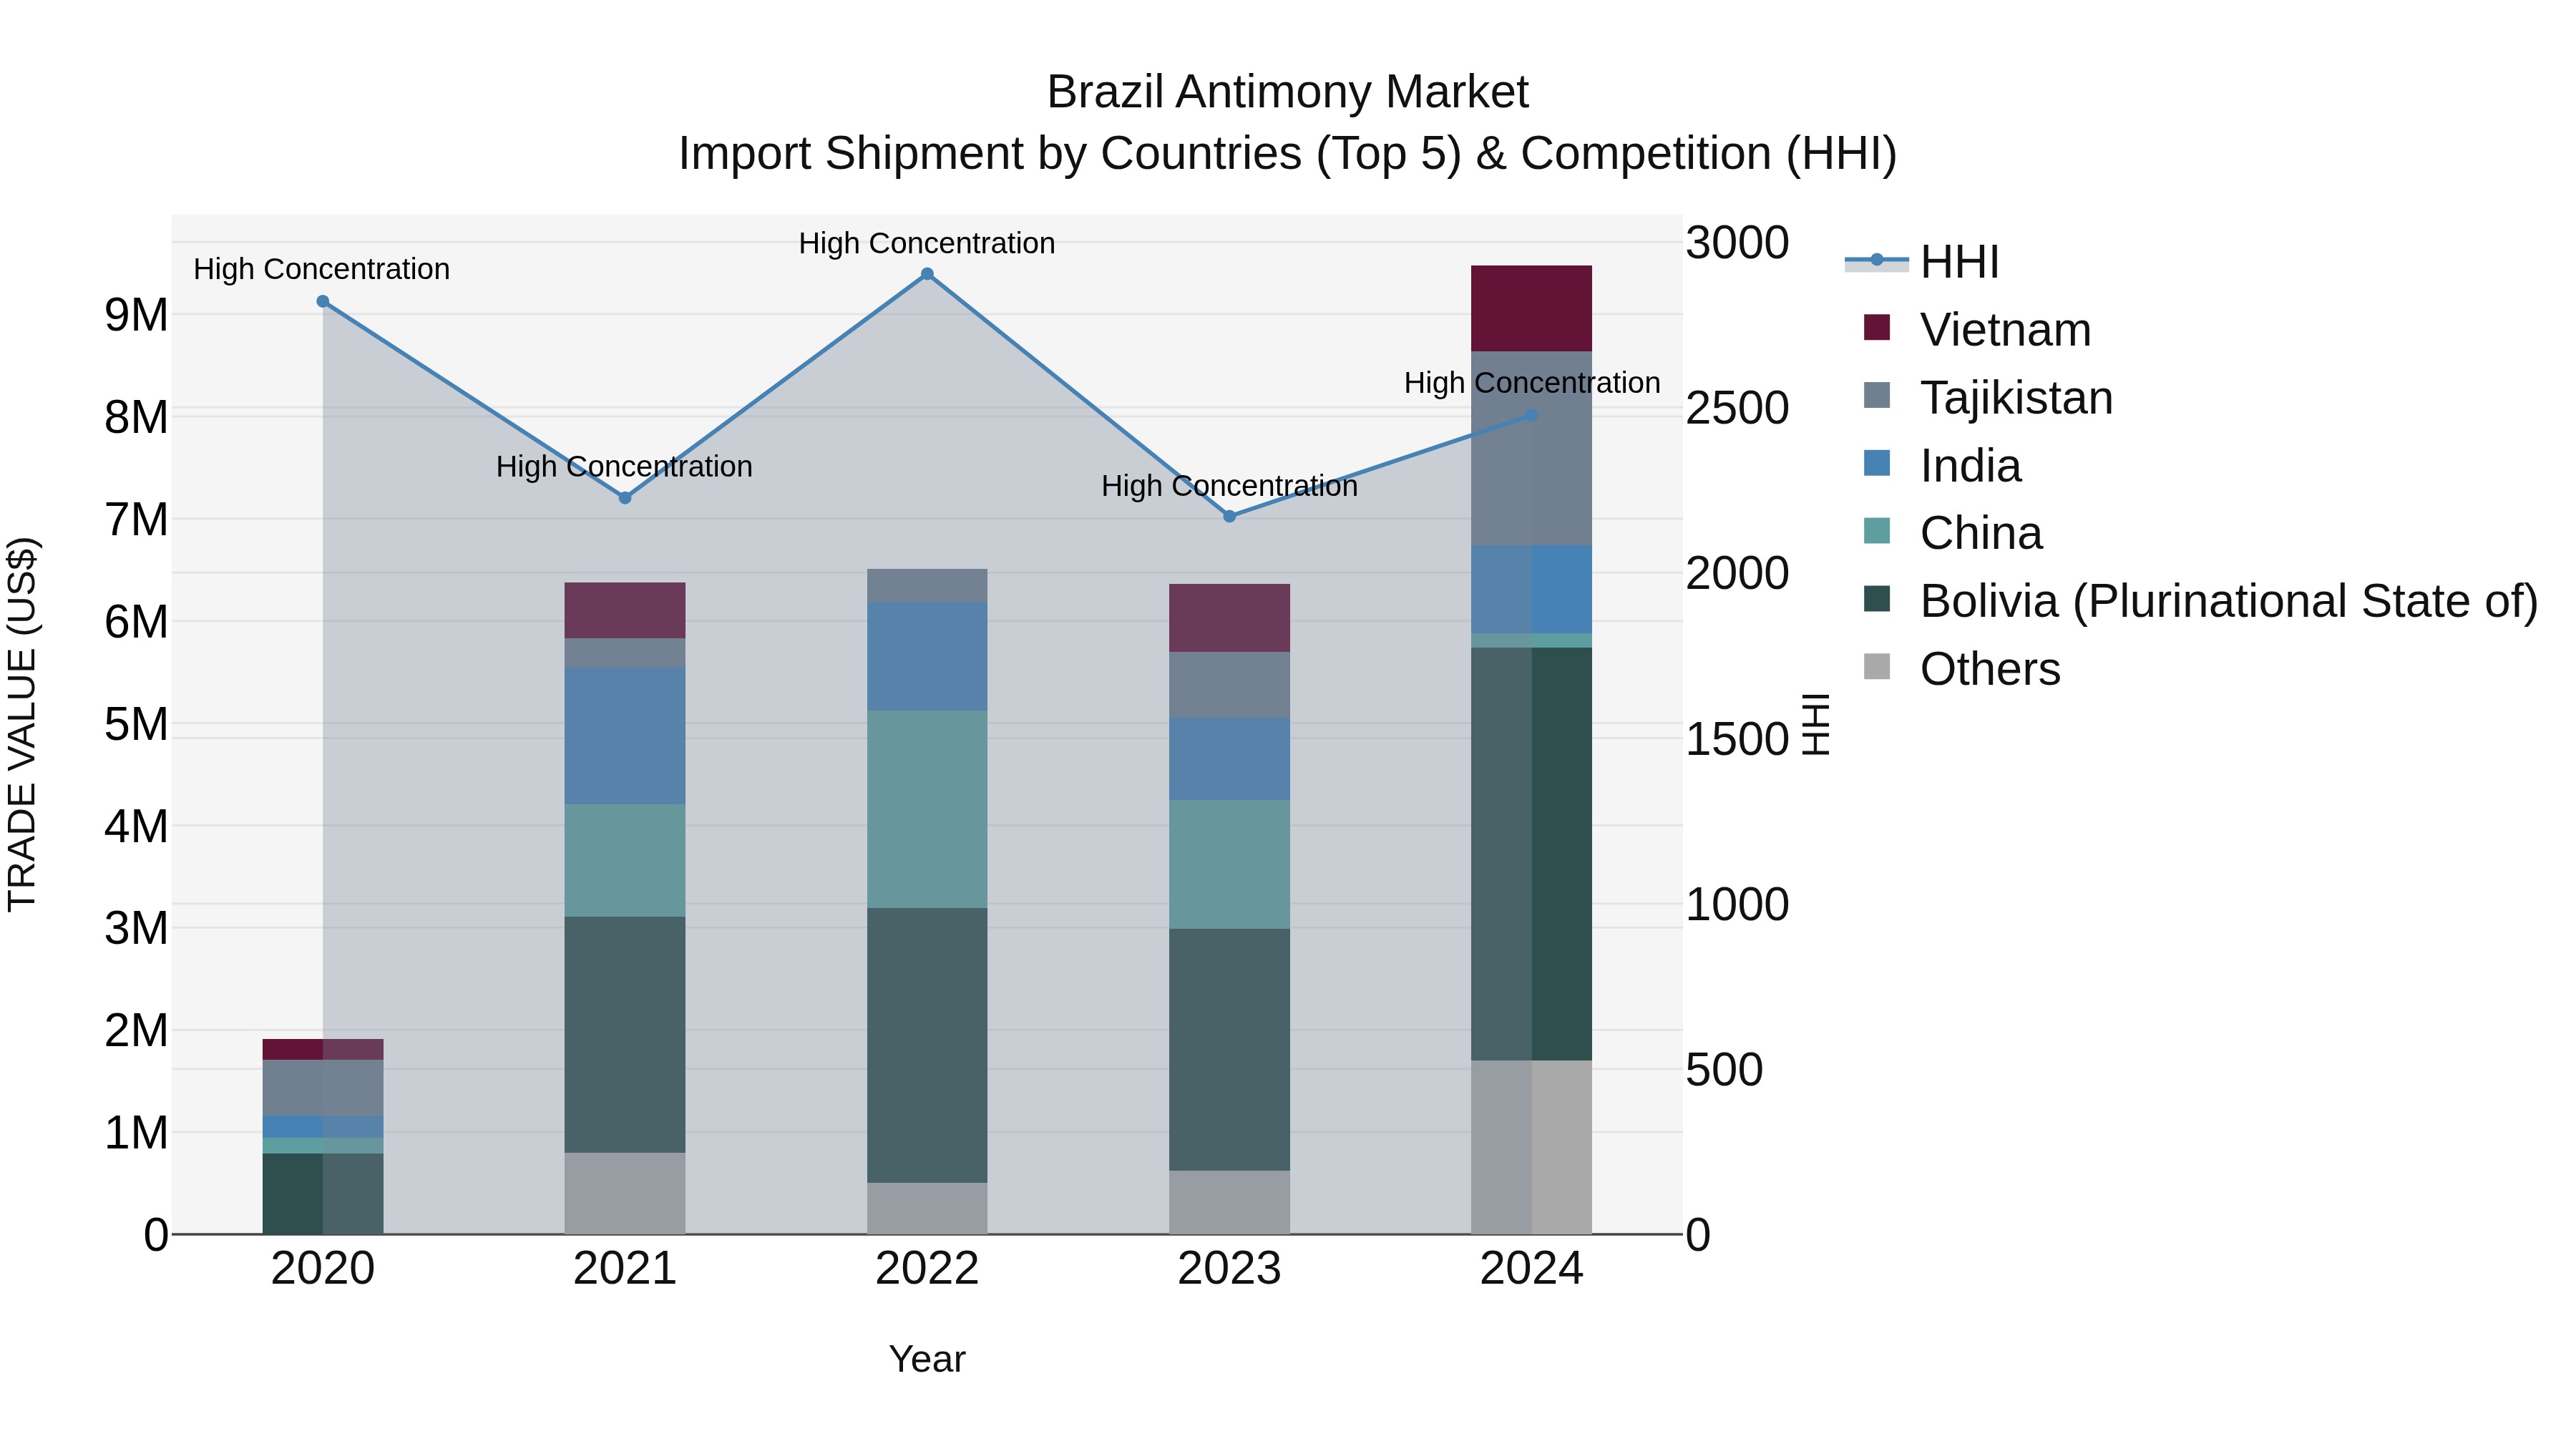
Brazil Antimony Market Top 5 Importing Countries and Market Competition (HHI) Analysis
Brazil`s antimony import market in 2024 continued to see a high concentration, with top exporting countries being Bolivia, Tajikistan, India, Vietnam, and the UK. The Herfindahl-Hirschman Index (HHI) remained at elevated levels, indicating significant market dominance. The compound annual growth rate (CAGR) from 2020 to 2024 was an impressive 49.27%, while the growth rate from 2023 to 2024 stood at 48.85%, pointing to a robust upward trend in antimony imports for the year. This data suggests a strong and dynamic market for antimony in Brazil.
Brazil Antimony Market Overview
The Brazil Antimony market is a key player in the global metals and alloys industry. Antimony, with applications in flame retardants, batteries, and metallurgical processes, holds strategic importance. Brazil rich mineral deposits contribute to its position in the global antimony market, with a focus on sustainable extraction and processing practices. The market dynamics reflect the nation`s role as a supplier to various industries, with a commitment to meeting international quality standards.
Drivers of the market
The Brazil Antimony Market sees growth driven by its applications in flame retardants, batteries, and metal alloys. With the increasing focus on fire safety standards and the expanding electronics and automotive sectors, the demand for antimony continues to rise. The metal`s unique properties contribute to its versatility, further supporting its market expansion.
Challenges of the market
The Brazil Antimony Market faces challenges related to market volatility and dependency on industries such as flame retardants and batteries. Regulatory changes and environmental concerns surrounding antimony usage present uncertainties. Diversification of applications and exploration of sustainable antimony sourcing practices are critical for long-term market stability.
Government Policy of the market
The antimony market in Brazil has witnessed fluctuations due to its diverse applications, including flame retardants and metallurgical processes. Government policies have aimed at balancing economic interests with environmental sustainability in antimony mining and processing. Measures to ensure responsible mining practices and compliance with international standards have played a crucial role in shaping the antimony market in Brazil.
Key Highlights of the Report:
- Brazil Antimony Market Outlook
- Market Size of Brazil Antimony Market, 2024
- Forecast of Brazil Antimony Market, 2031
- Historical Data and Forecast of Brazil Antimony Revenues & Volume for the Period 2021-2031
- Brazil Antimony Market Trend Evolution
- Brazil Antimony Market Drivers and Challenges
- Brazil Antimony Price Trends
- Brazil Antimony Porter's Five Forces
- Brazil Antimony Industry Life Cycle
- Historical Data and Forecast of Brazil Antimony Market Revenues & Volume By Type for the Period 2021-2031
- Historical Data and Forecast of Brazil Antimony Market Revenues & Volume By Metal Ingot for the Period 2021-2031
- Historical Data and Forecast of Brazil Antimony Market Revenues & Volume By Antimony Trioxide for the Period 2021-2031
- Historical Data and Forecast of Brazil Antimony Market Revenues & Volume By Antimony Pentoxide for the Period 2021-2031
- Historical Data and Forecast of Brazil Antimony Market Revenues & Volume By Alloys for the Period 2021-2031
- Historical Data and Forecast of Brazil Antimony Market Revenues & Volume By Other for the Period 2021-2031
- Historical Data and Forecast of Brazil Antimony Market Revenues & Volume By Application for the Period 2021-2031
- Historical Data and Forecast of Brazil Antimony Market Revenues & Volume By Flame Retardant for the Period 2021-2031
- Historical Data and Forecast of Brazil Antimony Market Revenues & Volume By Lead Acid Batteries for the Period 2021-2031
- Historical Data and Forecast of Brazil Antimony Market Revenues & Volume By Alloy Strengthening Agent for the Period 2021-2031
- Historical Data and Forecast of Brazil Antimony Market Revenues & Volume By Fiberglass Composites for the Period 2021-2031
- Historical Data and Forecast of Brazil Antimony Market Revenues & Volume By Catalyst for the Period 2021-2031
- Historical Data and Forecast of Brazil Antimony Market Revenues & Volume By Other for the Period 2021-2031
- Brazil Antimony Import Export Trade Statistics
- Market Opportunity Assessment By Type
- Market Opportunity Assessment By Application
- Brazil Antimony Top Companies Market Share
- Brazil Antimony Competitive Benchmarking By Technical and Operational Parameters
- Brazil Antimony Company Profiles
- Brazil Antimony Key Strategic Recommendations
Frequently Asked Questions About the Market Study (FAQs):
6Wresearch actively monitors the Brazil Antimony Market and publishes its comprehensive annual report, highlighting emerging trends, growth drivers, revenue analysis, and forecast outlook. Our insights help businesses to make data-backed strategic decisions with ongoing market dynamics. Our analysts track relevent industries related to the Brazil Antimony Market, allowing our clients with actionable intelligence and reliable forecasts tailored to emerging regional needs.
Yes, we provide customisation as per your requirements. To learn more, feel free to contact us on sales@6wresearch.com
1 Executive Summary |
2 Introduction |
2.1 Key Highlights of the Report |
2.2 Report Description |
2.3 Market Scope & Segmentation |
2.4 Research Methodology |
2.5 Assumptions |
3 Brazil Antimony Market Overview |
3.1 Brazil Country Macro Economic Indicators |
3.2 Brazil Antimony Market Revenues & Volume, 2021 & 2031F |
3.3 Brazil Antimony Market - Industry Life Cycle |
3.4 Brazil Antimony Market - Porter's Five Forces |
3.5 Brazil Antimony Market Revenues & Volume Share, By Type, 2021 & 2031F |
3.6 Brazil Antimony Market Revenues & Volume Share, By Form, 2021 & 2031F |
4 Brazil Antimony Market Dynamics |
4.1 Impact Analysis |
4.2 Market Drivers |
4.2.1 Increasing demand for antimony in industries such as automotive, electronics, and construction due to its unique properties. |
4.2.2 Growing awareness of the importance of antimony as a flame retardant in various applications. |
4.2.3 Rising investments in infrastructure projects in Brazil driving the demand for antimony-based products. |
4.3 Market Restraints |
4.3.1 Fluctuating prices of antimony due to factors such as supply-demand dynamics and global economic conditions. |
4.3.2 Environmental concerns related to the mining and processing of antimony leading to regulatory challenges. |
4.3.3 Competition from alternative materials and substitutes impacting the market growth. |
5 Brazil Antimony Market Trends |
6 Brazil Antimony Market, By Types |
6.1 Brazil Antimony Market, By Type |
6.1.1 Overview and Analysis |
6.1.2 Brazil Antimony Market Revenues & Volume, By Type, 2021-2031F |
6.1.3 Brazil Antimony Market Revenues & Volume, By Metal Ingot, 2021-2031F |
6.1.4 Brazil Antimony Market Revenues & Volume, By Antimony Trioxide, 2021-2031F |
6.1.5 Brazil Antimony Market Revenues & Volume, By Antimony Pentoxide, 2021-2031F |
6.1.6 Brazil Antimony Market Revenues & Volume, By Alloys, 2021-2031F |
6.1.7 Brazil Antimony Market Revenues & Volume, By Other, 2021-2031F |
6.2 Brazil Antimony Market, By Application |
6.2.1 Overview and Analysis |
6.2.2 Brazil Antimony Market Revenues & Volume, By Flame Retardant, 2021-2031F |
6.2.3 Brazil Antimony Market Revenues & Volume, By Lead Acid Batteries, 2021-2031F |
6.2.4 Brazil Antimony Market Revenues & Volume, By Alloy Strengthening Agent, 2021-2031F |
6.2.5 Brazil Antimony Market Revenues & Volume, By Fiberglass Composites, 2021-2031F |
6.2.6 Brazil Antimony Market Revenues & Volume, By Catalyst, 2021-2031F |
6.2.7 Brazil Antimony Market Revenues & Volume, By Other, 2021-2031F |
7 Brazil Antimony Market Import-Export Trade Statistics |
7.1 Brazil Antimony Market Export to Major Countries |
7.2 Brazil Antimony Market Imports from Major Countries |
8 Brazil Antimony Market Key Performance Indicators |
8.1 Average selling price of antimony products in Brazil. |
8.2 Percentage of antimony recycling rate in the country. |
8.3 Number of infrastructure projects utilizing antimony-based products. |
8.4 Research and development expenditure in the antimony industry. |
8.5 Level of compliance with environmental regulations in antimony mining and processing. |
9 Brazil Antimony Market - Opportunity Assessment |
9.1 Brazil Antimony Market Opportunity Assessment, By Type, 2021 & 2031F |
9.2 Brazil Antimony Market Opportunity Assessment, By Application, 2021 & 2031F |
10 Brazil Antimony Market - Competitive Landscape |
10.1 Brazil Antimony Market Revenue Share, By Companies, 2024 |
10.2 Brazil Antimony Market Competitive Benchmarking, By Operating and Technical Parameters |
11 Company Profiles |
12 Recommendations |
13 Disclaimer |
Global Go To Market Strategy - 2030
Export potential enables firms to identify high-growth global markets with greater confidence by combining advanced trade intelligence with a structured quantitative methodology. The framework analyzes emerging demand trends and country-level import patterns while integrating macroeconomic and trade datasets such as GDP and population forecasts, bilateral import–export flows, tariff structures, elasticity differentials between developed and developing economies, geographic distance, and import demand projections. Using weighted trade values from 2020–2024 as the base period to project country-to-country export potential for 2030, these inputs are operationalized through calculated drivers such as gravity model parameters, tariff impact factors, and projected GDP per-capita growth. Through an analysis of hidden potentials, demand hotspots, and market conditions that are most favorable to success, this method enables firms to focus on target countries, maximize returns, and global expansion with data, backed by accuracy.
By factoring in the projected importer demand gap that is currently unmet and could be potential opportunity, it identifies the potential for the Exporter (Country) among 190 countries, against the general trade analysis, which identifies the biggest importer or exporter.
To discover high-growth global markets and optimize your business strategy:
Click Here
Pricing
- Single User License$ 1,995
- Department License$ 2,400
- Site License$ 3,120
- Global License$ 3,795

Leadership Perspectives from Industry Events
Search
Thought Leadership and Analyst Meet


Our Clients
6WResearch In News
- India Air Conditioner Market Set for Strong Rebound in 2026 After Weather-Led Correction and GST-Driven Recovery: 6Wresearch
- ADAS in India: How Automatic Emergency Braking, Blind Spot Detection & Driver Monitoring are Transforming Road Safety
- Doha a strategic location for EV manufacturing hub: IPA Qatar
- Demand for luxury TVs surging in the GCC, says Samsung
- Empowering Growth: The Thriving Journey of Bangladesh’s Cable Industry
- Demand for luxury TVs surging in the GCC, says Samsung
Latest Reports
- Poland Fire Protection Systems Market (2026-2032)
- Cape Verde Portable Hand-Thrown Extinguisher Market (2026-2032)
- Canada Portable Hand-Thrown Extinguisher Market (2026-2032)
- Cameroon Portable Hand-Thrown Extinguisher Market (2026-2032)
- Burundi Portable Hand-Thrown Extinguisher Market (2026-2032)
- Burkina Faso Portable Hand-Thrown Extinguisher Market (2026-2032)
- Bulgaria Portable Hand-Thrown Extinguisher Market (2026-2032)
- Brunei Portable Hand-Thrown Extinguisher Market (2026-2032)
- Botswana Portable Hand-Thrown Extinguisher Market (2026-2032)
- Bosnia and Herzegovina Portable Hand-Thrown Extinguisher Market (2026-2032)
Industry Events and Analyst Meet

HIMTEX 2026

India Refining Summit 2026

India EV Show 2026

EV tech India Expo 2026

Auto Tech Asia 2026
Whitepaper
- Middle East & Africa Commercial Security Market Click here to view more.
- Middle East & Africa Fire Safety Systems & Equipment Market Click here to view more.
- GCC Drone Market Click here to view more.
- Middle East Lighting Fixture Market Click here to view more.
- GCC Physical & Perimeter Security Market Click here to view more.