Brazil Salt Market Outlook | Companies, Forecast, COVID-19 IMPACT, Revenue, Industry, Share, Value, Trends, Analysis, Size & Growth
Market Forecast By Type (Rock Salt, Brine, Solar Salt, Others), By Applications (Chemical Processing, Road De-icing, Food Processing, Others) And Competitive Landscape
| Product Code: ETC074481 | Publication Date: Jun 2021 | Updated Date: Oct 2025 | Product Type: Report | |
| Publisher: 6Wresearch | Author: Ravi Bhandari | No. of Pages: 70 | No. of Figures: 35 | No. of Tables: 5 |
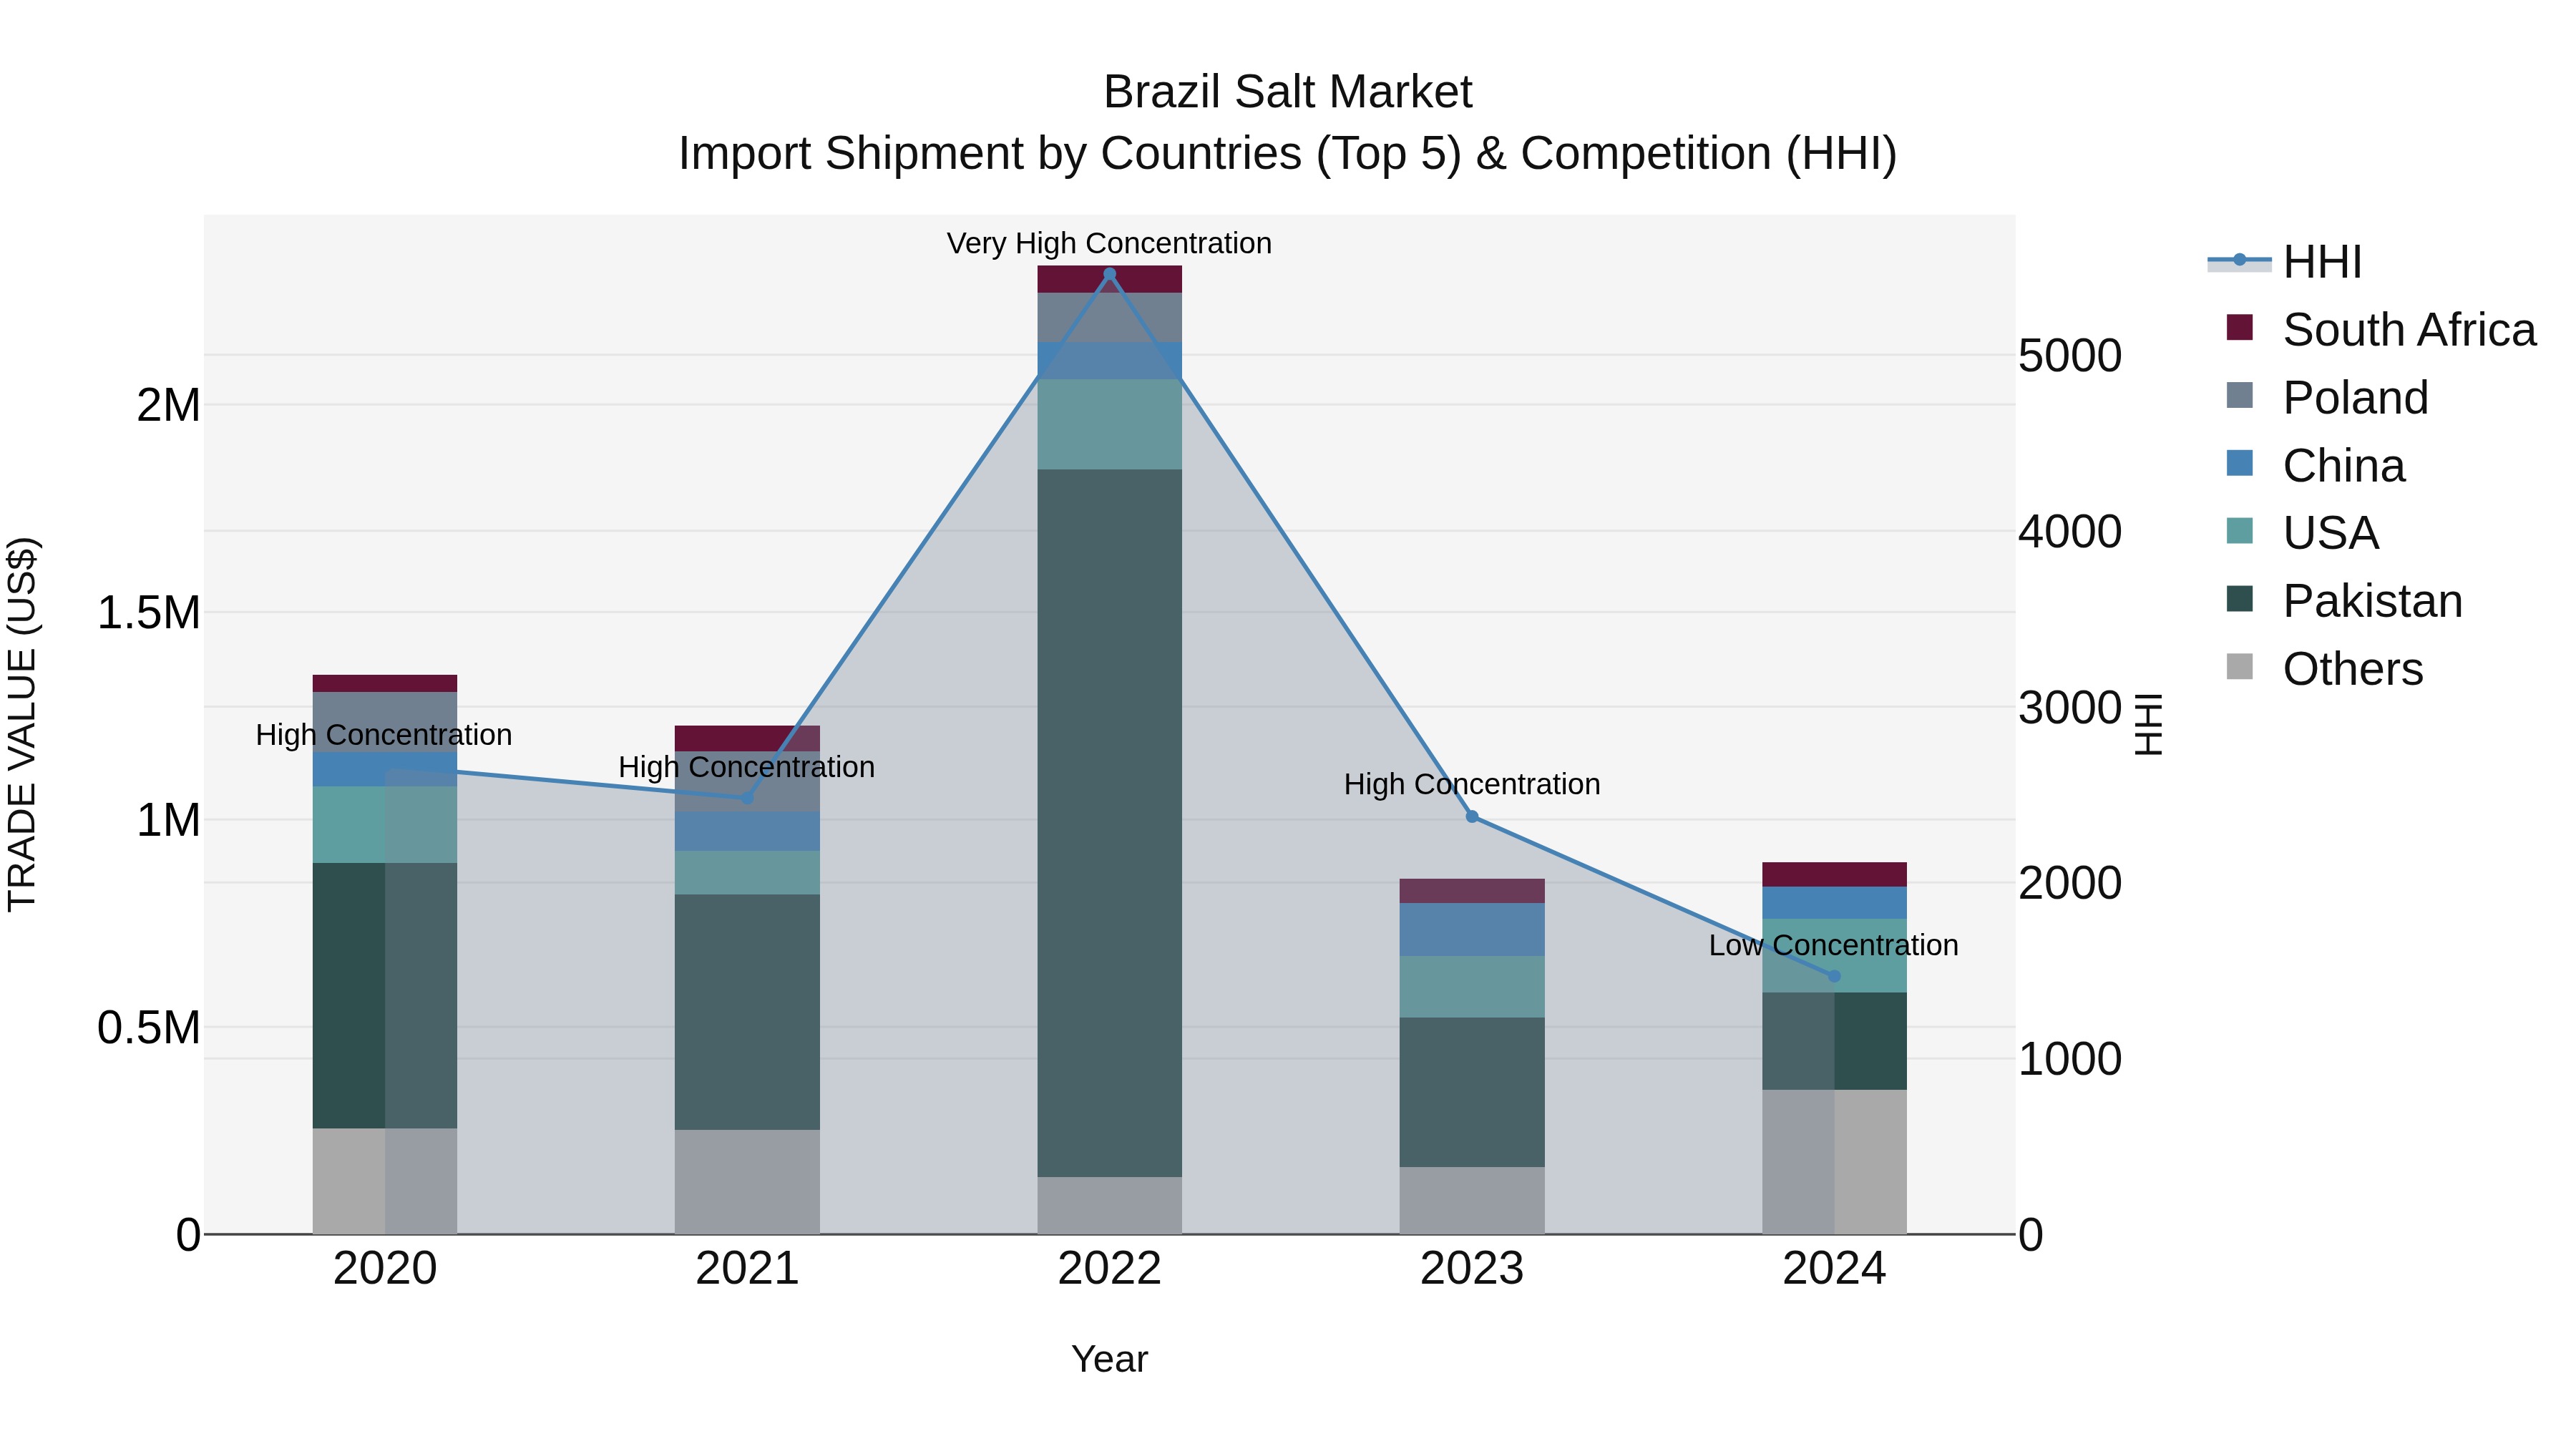
Brazil Salt Market Top 5 Importing Countries and Market Competition (HHI) Analysis
Brazil`s salt import market saw a shift in concentration levels from high to low in 2024, with key exporting countries being Pakistan, USA, Spain, Argentina, and China. Despite a negative compound annual growth rate (CAGR) of -9.68% from 2020 to 2024, there was a positive growth rate of 4.66% in 2024 compared to the previous year. This indicates potential opportunities for market expansion and diversification in the salt import sector in Brazil, with a more diverse range of countries contributing to the supply chain.
Brazil Salt Market Overview
The Brazil Salt Market encompasses the production, processing, and distribution of salt products for industrial, culinary, and agricultural applications. Salt is a vital ingredient in food processing, seasoning, and preservation, as well as in chemical manufacturing, water treatment, and de-icing operations. Market dynamics are driven by factors such as food consumption patterns, industrial demand for salt-based products, and environmental regulations governing salt extraction and production.
Drivers of the market
The salt market in Brazil experiences growth driven by demand from the food industry and various industrial applications. Salt is a versatile ingredient used in food processing, preservation, and seasoning, as well as in chemical manufacturing, water treatment, and de-icing applications. Factors such as population growth, urbanization, and expansion of food processing industries contribute to the demand for salt in Brazil.
Challenges of the market
The salt market in Brazil encounters challenges such as production costs, environmental sustainability, and market competition. Market players may face challenges related to salt extraction methods, quality standards, and transportation logistics. Additionally, there are challenges associated with health concerns, dietary trends, and consumer preferences for alternative seasoning options.
Government Policy of the market
Brazil government policies influence the salt market through regulations on food safety, public health, and industry standards. These policies ensure that salt products meet quality and purity requirements, including proper labeling and iodization levels to prevent micronutrient deficiencies. Additionally, there are initiatives to promote domestic salt production and reduce reliance on imports through investment incentives and trade agreements. Moreover, there may be regulations on salt mining and environmental sustainability to mitigate ecological impacts.
Key Highlights of the Report:
- Brazil Salt Market Outlook
- Market Size of Brazil Salt Market, 2020
- Forecast of Brazil Salt Market, 2027
- Historical Data and Forecast of Brazil Salt Revenues & Volume for the Period 2018 - 2027
- Brazil Salt Market Trend Evolution
- Brazil Salt Market Drivers and Challenges
- Brazil Salt Price Trends
- Brazil Salt Porter's Five Forces
- Brazil Salt Industry Life Cycle
- Historical Data and Forecast of Brazil Salt Market Revenues & Volume By Type for the Period 2018 - 2027
- Historical Data and Forecast of Brazil Salt Market Revenues & Volume By Rock Salt for the Period 2018 - 2027
- Historical Data and Forecast of Brazil Salt Market Revenues & Volume By Brine for the Period 2018 - 2027
- Historical Data and Forecast of Brazil Salt Market Revenues & Volume By Solar Salt for the Period 2018 - 2027
- Historical Data and Forecast of Brazil Salt Market Revenues & Volume By Others for the Period 2018 - 2027
- Historical Data and Forecast of Brazil Salt Market Revenues & Volume By Applications for the Period 2018 - 2027
- Historical Data and Forecast of Brazil Salt Market Revenues & Volume By Chemical Processing for the Period 2018 - 2027
- Historical Data and Forecast of Brazil Salt Market Revenues & Volume By Road De-icing for the Period 2018 - 2027
- Historical Data and Forecast of Brazil Salt Market Revenues & Volume By Food Processing for the Period 2018 - 2027
- Historical Data and Forecast of Brazil Salt Market Revenues & Volume By Others for the Period 2018 - 2027
- Brazil Salt Import Export Trade Statistics
- Market Opportunity Assessment By Type
- Market Opportunity Assessment By Applications
- Brazil Salt Top Companies Market Share
- Brazil Salt Competitive Benchmarking By Technical and Operational Parameters
- Brazil Salt Company Profiles
- Brazil Salt Key Strategic Recommendations
Frequently Asked Questions About the Market Study (FAQs):
6Wresearch actively monitors the Brazil Salt Market and publishes its comprehensive annual report, highlighting emerging trends, growth drivers, revenue analysis, and forecast outlook. Our insights help businesses to make data-backed strategic decisions with ongoing market dynamics. Our analysts track relevent industries related to the Brazil Salt Market, allowing our clients with actionable intelligence and reliable forecasts tailored to emerging regional needs.
Yes, we provide customisation as per your requirements. To learn more, feel free to contact us on sales@6wresearch.com
1 Executive Summary |
2 Introduction |
2.1 Key Highlights of the Report |
2.2 Report Description |
2.3 Market Scope & Segmentation |
2.4 Research Methodology |
2.5 Assumptions |
3 Brazil Salt Market Overview |
3.1 Brazil Country Macro Economic Indicators |
3.2 Brazil Salt Market Revenues & Volume, 2020 & 2027F |
3.3 Brazil Salt Market - Industry Life Cycle |
3.4 Brazil Salt Market - Porter's Five Forces |
3.5 Brazil Salt Market Revenues & Volume Share, By Type, 2020 & 2027F |
3.6 Brazil Salt Market Revenues & Volume Share, By Applications, 2020 & 2027F |
4 Brazil Salt Market Dynamics |
4.1 Impact Analysis |
4.2 Market Drivers |
4.2.1 Increasing health awareness leading to higher demand for healthier salt alternatives |
4.2.2 Growth in the food and beverage industry driving the demand for salt as a key ingredient |
4.2.3 Rising disposable income and changing consumer lifestyles influencing salt consumption patterns |
4.3 Market Restraints |
4.3.1 Health concerns related to excessive salt intake leading to a shift towards low-sodium products |
4.3.2 Fluctuating prices of raw materials impacting production costs and pricing strategies |
5 Brazil Salt Market Trends |
6 Brazil Salt Market, By Types |
6.1 Brazil Salt Market, By Type |
6.1.1 Overview and Analysis |
6.1.2 Brazil Salt Market Revenues & Volume, By Type, 2018 - 2027F |
6.1.3 Brazil Salt Market Revenues & Volume, By Rock Salt, 2018 - 2027F |
6.1.4 Brazil Salt Market Revenues & Volume, By Brine , 2018 - 2027F |
6.1.5 Brazil Salt Market Revenues & Volume, By Solar Salt, 2018 - 2027F |
6.1.6 Brazil Salt Market Revenues & Volume, By Others, 2018 - 2027F |
6.2 Brazil Salt Market, By Applications |
6.2.1 Overview and Analysis |
6.2.2 Brazil Salt Market Revenues & Volume, By Chemical Processing, 2018 - 2027F |
6.2.3 Brazil Salt Market Revenues & Volume, By Road De-icing, 2018 - 2027F |
6.2.4 Brazil Salt Market Revenues & Volume, By Food Processing, 2018 - 2027F |
6.2.5 Brazil Salt Market Revenues & Volume, By Others, 2018 - 2027F |
7 Brazil Salt Market Import-Export Trade Statistics |
7.1 Brazil Salt Market Export to Major Countries |
7.2 Brazil Salt Market Imports from Major Countries |
8 Brazil Salt Market Key Performance Indicators |
8.1 Consumer preference for low-sodium salt options |
8.2 Adoption rate of innovative salt products in the market |
8.3 Growth in the demand for organic and natural salt alternatives |
8.4 Regulatory compliance and adherence to salt content guidelines |
8.5 Market penetration of premium salt products |
9 Brazil Salt Market - Opportunity Assessment |
9.1 Brazil Salt Market Opportunity Assessment, By Type, 2020 & 2027F |
9.2 Brazil Salt Market Opportunity Assessment, By Applications, 2020 & 2027F |
10 Brazil Salt Market - Competitive Landscape |
10.1 Brazil Salt Market Revenue Share, By Companies, 2020 |
10.2 Brazil Salt Market Competitive Benchmarking, By Operating and Technical Parameters |
11 Company Profiles |
12 Recommendations |
13 Disclaimer |
Export potential assessment - trade Analytics for 2030
Export potential enables firms to identify high-growth global markets with greater confidence by combining advanced trade intelligence with a structured quantitative methodology. The framework analyzes emerging demand trends and country-level import patterns while integrating macroeconomic and trade datasets such as GDP and population forecasts, bilateral import–export flows, tariff structures, elasticity differentials between developed and developing economies, geographic distance, and import demand projections. Using weighted trade values from 2020–2024 as the base period to project country-to-country export potential for 2030, these inputs are operationalized through calculated drivers such as gravity model parameters, tariff impact factors, and projected GDP per-capita growth. Through an analysis of hidden potentials, demand hotspots, and market conditions that are most favorable to success, this method enables firms to focus on target countries, maximize returns, and global expansion with data, backed by accuracy.
By factoring in the projected importer demand gap that is currently unmet and could be potential opportunity, it identifies the potential for the Exporter (Country) among 190 countries, against the general trade analysis, which identifies the biggest importer or exporter.
To discover high-growth global markets and optimize your business strategy:
Click Here
Pricing
- Single User License$ 1,995
- Department License$ 2,400
- Site License$ 3,120
- Global License$ 3,795

Search
Thought Leadership and Analyst Meet


Our Clients
Latest Reports
- United Kingdom (UK) Long-term Care Insurance Market (2026-2032) | Growth, Share, Consumer Insights, Drivers, Opportunities, Competition, Pricing Analysis, Segments, Restraints, Companies, Competitive, Value, Outlook, Size, Demand, Analysis, Challenges, Strategic Insights, Investment Trends, Revenue, Trends, Supply, Forecast
- United Kingdom (UK) Long Term Care Market (2026-2032) | Companies, Outlook, Analysis, Trends, Value, Revenue, Segmentation, Share, Forecast, Competitive Landscape, Growth, Size & Forecast
- Iraq Insulation and Waterproofing Market (2026-2032) | Outlook, Drivers, Growth, Size, Share, Industry, Revenue, Trends, Demand, Competitive, Strategic Insights, Opportunities, Segments, Companies, Challenges, Strategy, Consumer Insights, Analysis, Investment Trends, Value, Segmentation, Forecast, Restraints
- India Switchgear Market Outlook (2026 - 2032) | Size, Share, Trends, Growth, Revenue, Forecast, Analysis, Value, Outlook
- Pakistan Contraceptive Implants Market (2025-2031) | Demand, Growth, Size, Share, Industry, Pricing Analysis, Competitive, Strategic Insights, Strategy, Consumer Insights, Analysis, Investment Trends, Opportunities, Revenue, Segments, Value, Segmentation, Supply, Forecast, Restraints, Outlook, Competition, Drivers, Trends, Companies, Challenges
- Sri Lanka Packaging Market (2026-2032) | Outlook, Competition, Drivers, Trends, Demand, Pricing Analysis, Competitive, Strategic Insights, Companies, Challenges, Strategy, Consumer Insights, Analysis, Investment Trends, Opportunities, Growth, Size, Share, Industry, Revenue, Segments, Value, Segmentation, Supply, Forecast, Restraints
- India Kids Watches Market (2026-2032) | Strategy, Consumer Insights, Analysis, Investment Trends, Opportunities, Growth, Size, Share, Industry, Revenue, Segments, Value, Segmentation, Supply, Forecast, Restraints, Outlook, Competition, Drivers, Trends, Demand, Pricing Analysis, Competitive, Strategic Insights, Companies, Challenges
- Saudi Arabia Core Assurance Service Market (2025-2031) | Strategy, Consumer Insights, Analysis, Investment Trends, Opportunities, Growth, Size, Share, Industry, Revenue, Segments, Value, Segmentation, Supply, Forecast, Restraints, Outlook, Competition, Drivers, Trends, Demand, Pricing Analysis, Competitive, Strategic Insights, Companies, Challenges
- Romania Uninterruptible Power Supply (UPS) Market (2026-2032) | Industry, Analysis, Revenue, Size, Forecast, Outlook, Value, Trends, Share, Growth & Companies
- Saudi Arabia Car Window Tinting Film, Paint Protection Film (PPF), and Ceramic Coating Market (2025-2031) | Strategy, Consumer Insights, Analysis, Investment Trends, Opportunities, Growth, Size, Share, Industry, Revenue, Segments, Value, Segmentation, Supply, Forecast, Restraints, Outlook, Competition, Drivers, Trends, Demand, Pricing Analysis, Competitive, Strategic Insights, Companies, Challenges
Industry Events and Analyst Meet

India EV Show 2026

EV tech India Expo 2026

Auto Tech Asia 2026

Battery Tech India 2026

Smart Production Solutions Guangzhou 2026
Whitepaper
- Middle East & Africa Commercial Security Market Click here to view more.
- Middle East & Africa Fire Safety Systems & Equipment Market Click here to view more.
- GCC Drone Market Click here to view more.
- Middle East Lighting Fixture Market Click here to view more.
- GCC Physical & Perimeter Security Market Click here to view more.
6WResearch In News
- Doha a strategic location for EV manufacturing hub: IPA Qatar
- Demand for luxury TVs surging in the GCC, says Samsung
- Empowering Growth: The Thriving Journey of Bangladesh’s Cable Industry
- Demand for luxury TVs surging in the GCC, says Samsung
- Video call with a traditional healer? Once unthinkable, it’s now common in South Africa
- Intelligent Buildings To Smooth GCC’s Path To Net Zero