Brazil Steam Trap Market (2025-2031) Outlook | Share, Size, Value, Growth, Industry, Trends, Revenue, Analysis, Forecast & Companies
Market Forecast By Product (Thermodynamic, Mechanical, Thermostatic), By Application (DripApplication, ProcessApplication, TracingApplication), By Body Material (Steel, Iron) And Competitive Landscape
| Product Code: ETC4587063 | Publication Date: Jul 2023 | Updated Date: Oct 2025 | Product Type: Report | |
| Publisher: 6Wresearch | Author: Ravi Bhandari | No. of Pages: 85 | No. of Figures: 45 | No. of Tables: 25 |
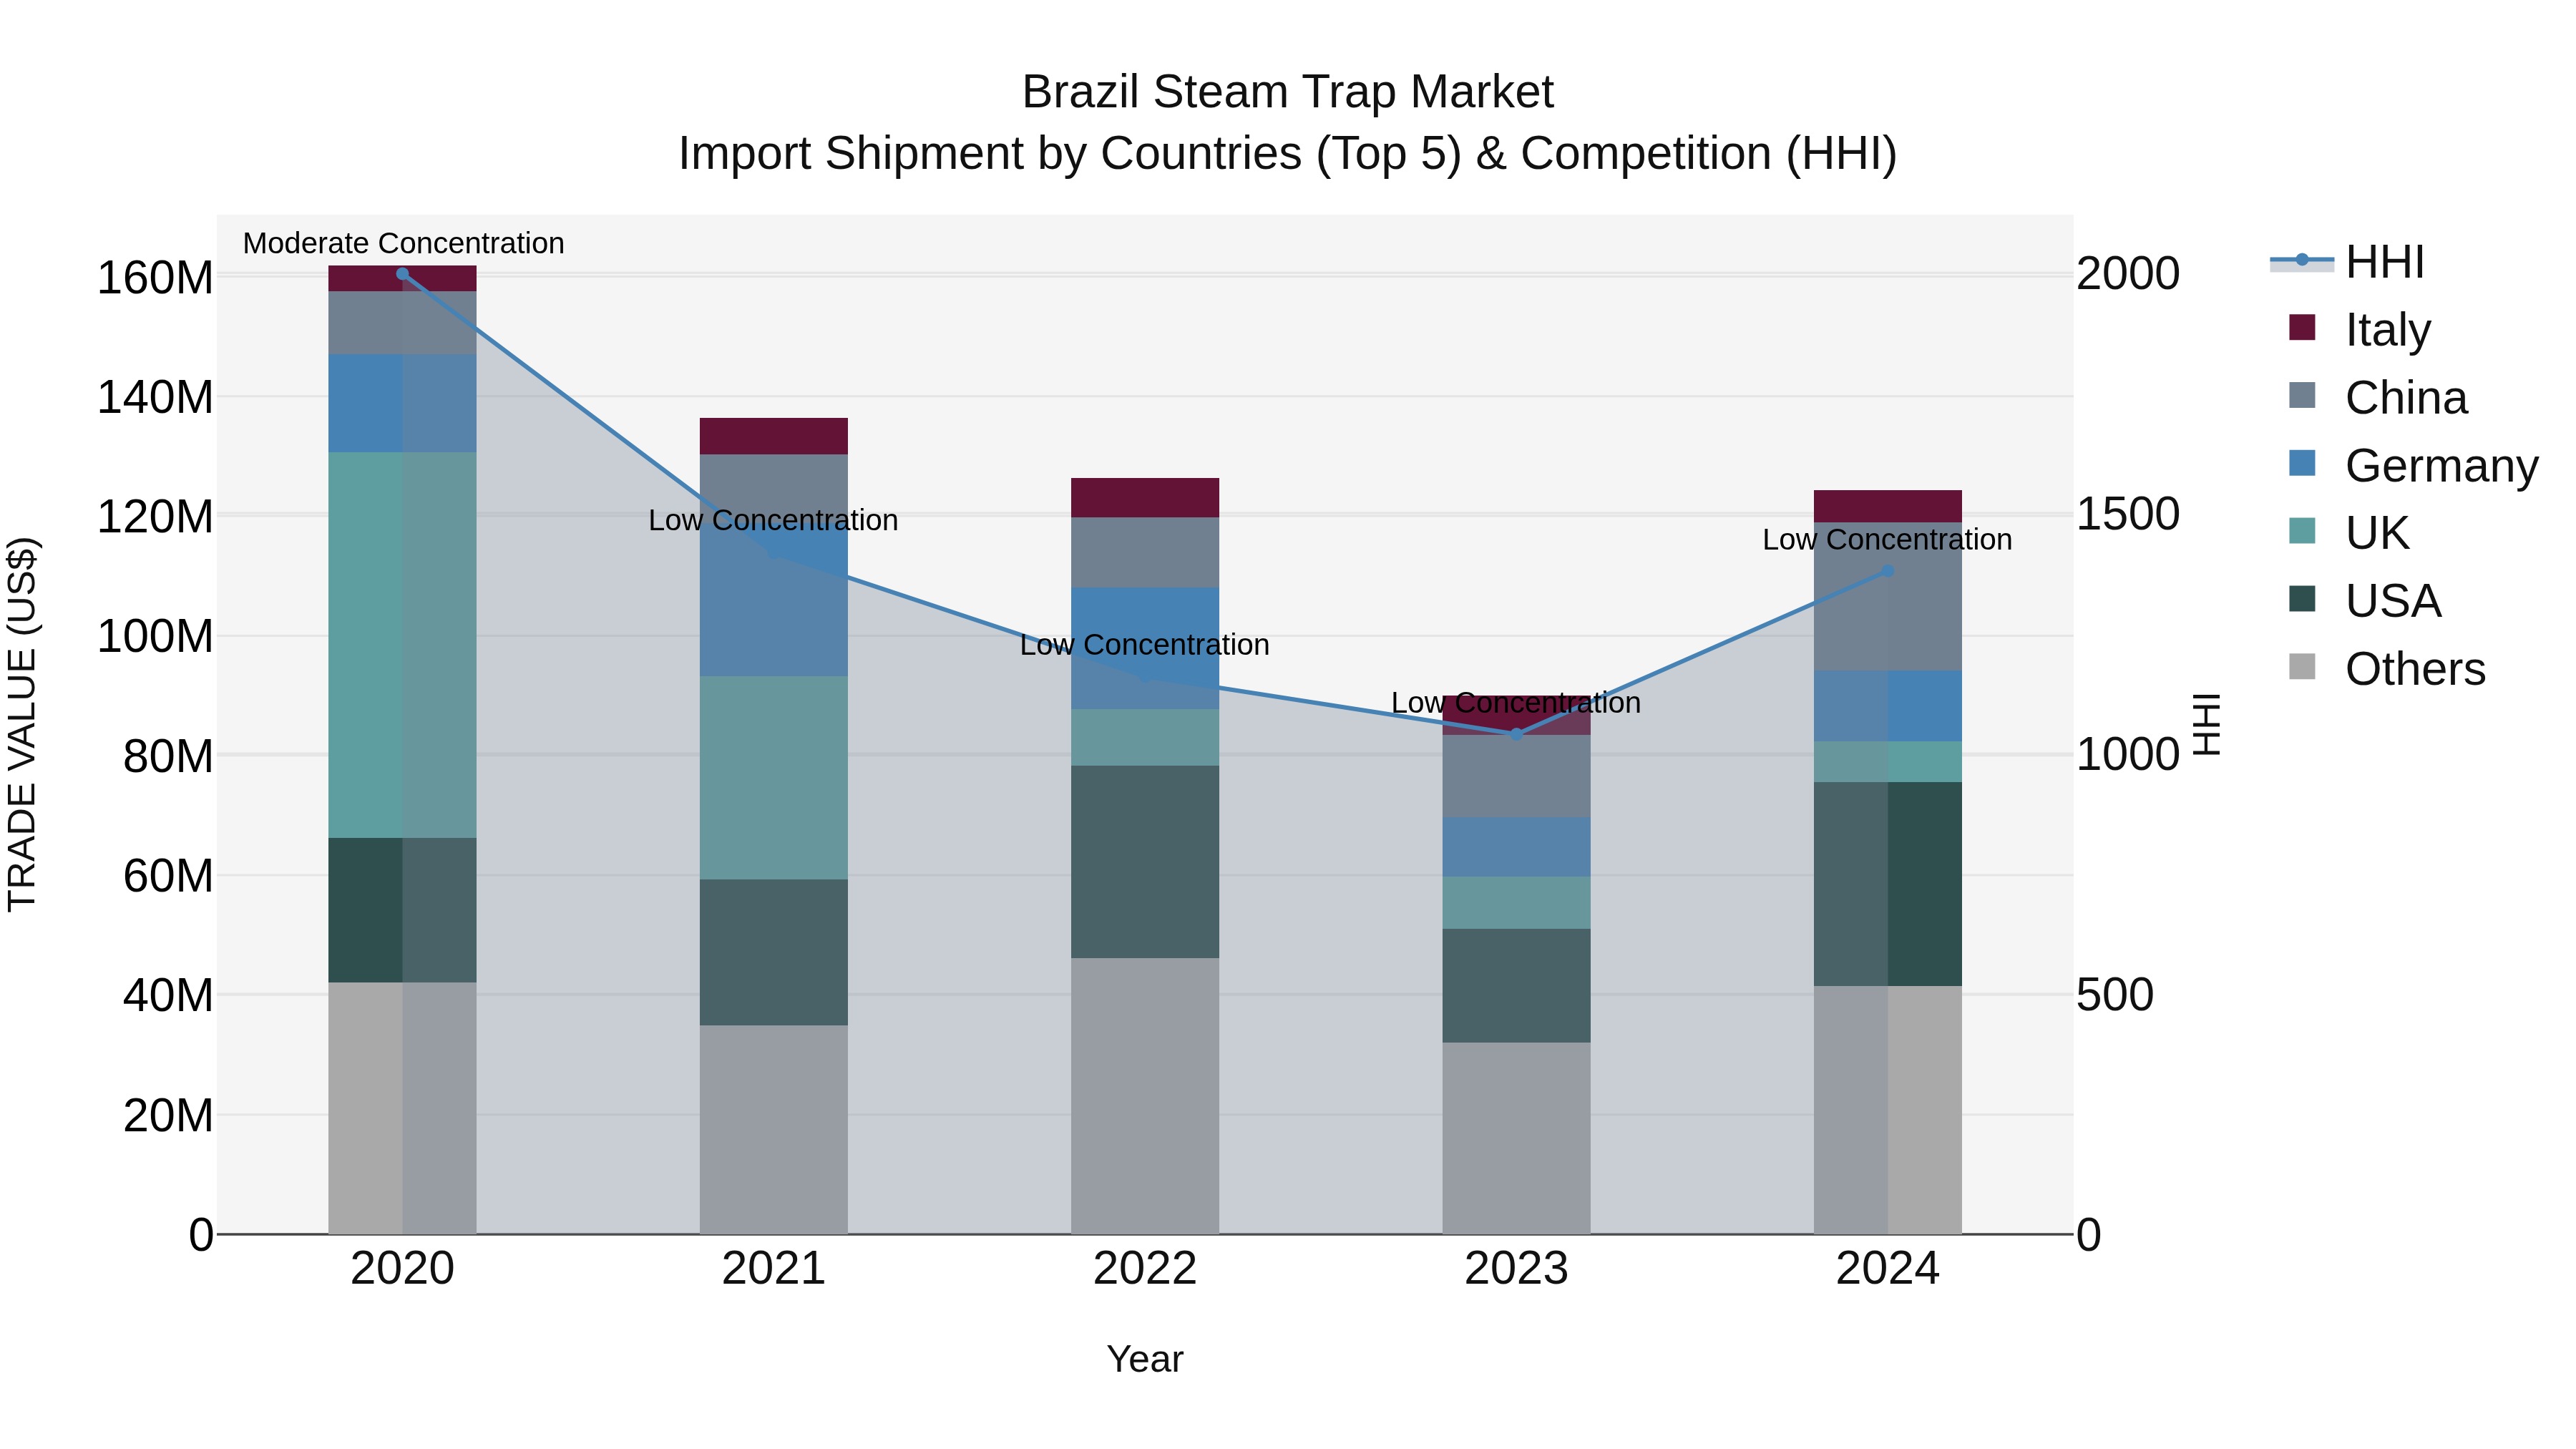
Brazil Steam Trap Market Top 5 Importing Countries and Market Competition (HHI) Analysis
In 2024, Brazil saw a notable increase in steam trap imports, with the top exporting countries being the USA, China, Germany, and Norway. Despite the low concentration indicated by the Herfindahl-Hirschman Index (HHI), the market experienced a negative compound annual growth rate (CAGR) of -6.37% from 2020 to 2024. However, there was a significant growth rate of 38.13% from 2023 to 2024, indicating a potential turnaround in the market dynamics. Brazil`s reliance on imports for steam traps highlights the importance of international trade relationships in meeting domestic demand.
Brazil Steam Trap Market Overview
The steam trap market in Brazil is driven by the growing emphasis on energy efficiency and sustainability across industries such as power generation, chemicals, and food processing. Steam traps play a crucial role in preventing steam loss and optimizing energy consumption, thereby fueling their demand in the market.
Drivers of the market
In Brazil, the Steam Trap market is influenced by the emphasis on energy conservation and the increasing adoption of steam systems in various industries such as power generation, manufacturing, and petrochemicals. Steam traps play a vital role in optimizing steam distribution systems by removing condensate and preventing energy loss. As industries strive to improve energy efficiency and reduce operating costs, the demand for steam traps is expected to rise. Additionally, government initiatives promoting energy efficiency and sustainability further contribute to market growth.
Challenges of the market
Challenges in the Brazil steam trap market include ensuring efficient and reliable removal of condensate from steam systems, addressing variability in steam quality and operating conditions, and managing the cost of maintenance and replacement of steam traps in industrial processes.
Government Policy of the market
Government initiatives to improve energy efficiency and reduce carbon emissions in industrial processes have led to regulations promoting the adoption of energy-saving technologies like steam traps. Incentive programs and regulatory mandates aimed at optimizing energy consumption in industries have encouraged widespread adoption of steam trap systems across various sectors in Brazil.
Key Highlights of the Report:
- Brazil Steam Trap Market Outlook
- Market Size of Brazil Steam Trap Market, 2024
- Forecast of Brazil Steam Trap Market, 2031
- Historical Data and Forecast of Brazil Steam Trap Revenues & Volume for the Period 2021-2031
- Brazil Steam Trap Market Trend Evolution
- Brazil Steam Trap Market Drivers and Challenges
- Brazil Steam Trap Price Trends
- Brazil Steam Trap Porter's Five Forces
- Brazil Steam Trap Industry Life Cycle
- Historical Data and Forecast of Brazil Steam Trap Market Revenues & Volume By Product for the Period 2021-2031
- Historical Data and Forecast of Brazil Steam Trap Market Revenues & Volume By Thermodynamic for the Period 2021-2031
- Historical Data and Forecast of Brazil Steam Trap Market Revenues & Volume By Mechanical for the Period 2021-2031
- Historical Data and Forecast of Brazil Steam Trap Market Revenues & Volume By Thermostatic for the Period 2021-2031
- Historical Data and Forecast of Brazil Steam Trap Market Revenues & Volume By Application for the Period 2021-2031
- Historical Data and Forecast of Brazil Steam Trap Market Revenues & Volume By DripApplication for the Period 2021-2031
- Historical Data and Forecast of Brazil Steam Trap Market Revenues & Volume By ProcessApplication for the Period 2021-2031
- Historical Data and Forecast of Brazil Steam Trap Market Revenues & Volume By TracingApplication for the Period 2021-2031
- Historical Data and Forecast of Brazil Steam Trap Market Revenues & Volume By Body Material for the Period 2021-2031
- Historical Data and Forecast of Brazil Steam Trap Market Revenues & Volume By Steel for the Period 2021-2031
- Historical Data and Forecast of Brazil Steam Trap Market Revenues & Volume By Iron for the Period 2021-2031
- Brazil Steam Trap Import Export Trade Statistics
- Market Opportunity Assessment By Product
- Market Opportunity Assessment By Application
- Market Opportunity Assessment By Body Material
- Brazil Steam Trap Top Companies Market Share
- Brazil Steam Trap Competitive Benchmarking By Technical and Operational Parameters
- Brazil Steam Trap Company Profiles
- Brazil Steam Trap Key Strategic Recommendations
Frequently Asked Questions About the Market Study (FAQs):
6Wresearch actively monitors the Brazil Steam Trap Market and publishes its comprehensive annual report, highlighting emerging trends, growth drivers, revenue analysis, and forecast outlook. Our insights help businesses to make data-backed strategic decisions with ongoing market dynamics. Our analysts track relevent industries related to the Brazil Steam Trap Market, allowing our clients with actionable intelligence and reliable forecasts tailored to emerging regional needs.
Yes, we provide customisation as per your requirements. To learn more, feel free to contact us on sales@6wresearch.com
1 Executive Summary |
2 Introduction |
2.1 Key Highlights of the Report |
2.2 Report Description |
2.3 Market Scope & Segmentation |
2.4 Research Methodology |
2.5 Assumptions |
3 Brazil Steam Trap Market Overview |
3.1 Brazil Country Macro Economic Indicators |
3.2 Brazil Steam Trap Market Revenues & Volume, 2021 & 2031F |
3.3 Brazil Steam Trap Market - Industry Life Cycle |
3.4 Brazil Steam Trap Market - Porter's Five Forces |
3.5 Brazil Steam Trap Market Revenues & Volume Share, By Product, 2021 & 2031F |
3.6 Brazil Steam Trap Market Revenues & Volume Share, By Application, 2021 & 2031F |
3.7 Brazil Steam Trap Market Revenues & Volume Share, By Body Material, 2021 & 2031F |
4 Brazil Steam Trap Market Dynamics |
4.1 Impact Analysis |
4.2 Market Drivers |
4.2.1 Increasing industrialization and infrastructure development in Brazil leading to higher demand for steam traps. |
4.2.2 Growing awareness about energy efficiency and sustainability driving the adoption of steam traps. |
4.2.3 Stringent regulations and policies promoting energy conservation and emission reduction, boosting the market for steam traps in Brazil. |
4.3 Market Restraints |
4.3.1 High initial investment costs associated with steam trap installation and maintenance. |
4.3.2 Presence of alternative technologies for condensate recovery and energy conservation posing a challenge to the steam trap market in Brazil. |
5 Brazil Steam Trap Market Trends |
6 Brazil Steam Trap Market, By Types |
6.1 Brazil Steam Trap Market, By Product |
6.1.1 Overview and Analysis |
6.1.2 Brazil Steam Trap Market Revenues & Volume, By Product, 2021-2031F |
6.1.3 Brazil Steam Trap Market Revenues & Volume, By Thermodynamic, 2021-2031F |
6.1.4 Brazil Steam Trap Market Revenues & Volume, By Mechanical, 2021-2031F |
6.1.5 Brazil Steam Trap Market Revenues & Volume, By Thermostatic, 2021-2031F |
6.2 Brazil Steam Trap Market, By Application |
6.2.1 Overview and Analysis |
6.2.2 Brazil Steam Trap Market Revenues & Volume, By DripApplication, 2021-2031F |
6.2.3 Brazil Steam Trap Market Revenues & Volume, By ProcessApplication, 2021-2031F |
6.2.4 Brazil Steam Trap Market Revenues & Volume, By TracingApplication, 2021-2031F |
6.3 Brazil Steam Trap Market, By Body Material |
6.3.1 Overview and Analysis |
6.3.2 Brazil Steam Trap Market Revenues & Volume, By Steel, 2021-2031F |
6.3.3 Brazil Steam Trap Market Revenues & Volume, By Iron, 2021-2031F |
7 Brazil Steam Trap Market Import-Export Trade Statistics |
7.1 Brazil Steam Trap Market Export to Major Countries |
7.2 Brazil Steam Trap Market Imports from Major Countries |
8 Brazil Steam Trap Market Key Performance Indicators |
8.1 Energy savings achieved through the use of steam traps. |
8.2 Reduction in maintenance costs and downtime due to efficient steam trap performance. |
8.3 Number of new installations and replacements of steam traps in key industries in Brazil. |
9 Brazil Steam Trap Market - Opportunity Assessment |
9.1 Brazil Steam Trap Market Opportunity Assessment, By Product, 2021 & 2031F |
9.2 Brazil Steam Trap Market Opportunity Assessment, By Application, 2021 & 2031F |
9.3 Brazil Steam Trap Market Opportunity Assessment, By Body Material, 2021 & 2031F |
10 Brazil Steam Trap Market - Competitive Landscape |
10.1 Brazil Steam Trap Market Revenue Share, By Companies, 2024 |
10.2 Brazil Steam Trap Market Competitive Benchmarking, By Operating and Technical Parameters |
11 Company Profiles |
12 Recommendations |
13 Disclaimer |
Global Go To Market Strategy - 2030
Export potential enables firms to identify high-growth global markets with greater confidence by combining advanced trade intelligence with a structured quantitative methodology. The framework analyzes emerging demand trends and country-level import patterns while integrating macroeconomic and trade datasets such as GDP and population forecasts, bilateral import–export flows, tariff structures, elasticity differentials between developed and developing economies, geographic distance, and import demand projections. Using weighted trade values from 2020–2024 as the base period to project country-to-country export potential for 2030, these inputs are operationalized through calculated drivers such as gravity model parameters, tariff impact factors, and projected GDP per-capita growth. Through an analysis of hidden potentials, demand hotspots, and market conditions that are most favorable to success, this method enables firms to focus on target countries, maximize returns, and global expansion with data, backed by accuracy.
By factoring in the projected importer demand gap that is currently unmet and could be potential opportunity, it identifies the potential for the Exporter (Country) among 190 countries, against the general trade analysis, which identifies the biggest importer or exporter.
To discover high-growth global markets and optimize your business strategy:
Click Here
Pricing
- Single User License$ 1,995
- Department License$ 2,400
- Site License$ 3,120
- Global License$ 3,795

Leadership Perspectives from Industry Events
Search
Thought Leadership and Analyst Meet


Our Clients
6WResearch In News
- Doha a strategic location for EV manufacturing hub: IPA Qatar
- Demand for luxury TVs surging in the GCC, says Samsung
- Empowering Growth: The Thriving Journey of Bangladesh’s Cable Industry
- Demand for luxury TVs surging in the GCC, says Samsung
- Video call with a traditional healer? Once unthinkable, it’s now common in South Africa
- Intelligent Buildings To Smooth GCC’s Path To Net Zero
Latest Reports
- New Zealand Aseptic Manufacturing Market (2026-2032)
- Netherlands Aseptic Manufacturing Market (2026-2032)
- Nauru Aseptic Manufacturing Market (2026-2032)
- Namibia Aseptic Manufacturing Market (2026-2032)
- Mozambique Aseptic Manufacturing Market (2026-2032)
- Montenegro Aseptic Manufacturing Market (2026-2032)
- Mongolia Aseptic Manufacturing Market (2026-2032)
- Monaco Aseptic Manufacturing Market (2026-2032)
- Micronesia Aseptic Manufacturing Market (2026-2032)
- Mauritius Aseptic Manufacturing Market (2026-2032)
Industry Events and Analyst Meet

HIMTEX 2026

India Refining Summit 2026

India EV Show 2026

EV tech India Expo 2026

Auto Tech Asia 2026
Whitepaper
- Middle East & Africa Commercial Security Market Click here to view more.
- Middle East & Africa Fire Safety Systems & Equipment Market Click here to view more.
- GCC Drone Market Click here to view more.
- Middle East Lighting Fixture Market Click here to view more.
- GCC Physical & Perimeter Security Market Click here to view more.