Brazil Terephthalic Acid Market Outlook | Trends, Industry, Revenue, Growth, Size, Companies, Share, COVID-19 IMPACT, Value, Analysis & Forecast
Market Forecast By Types (Amoco Process, Cooxidation, Multistage Oxidation, Henkel Process), By Applications (Cyclohexanedimethanol Production, Plasticisers, Liquid Crystal Polymers, Textiles, Bottling And Packaging) And Competitive Landscape
| Product Code: ETC349382 | Publication Date: Aug 2022 | Updated Date: Oct 2025 | Product Type: Market Research Report | |
| Publisher: 6Wresearch | Author: Ravi Bhandari | No. of Pages: 75 | No. of Figures: 35 | No. of Tables: 20 |
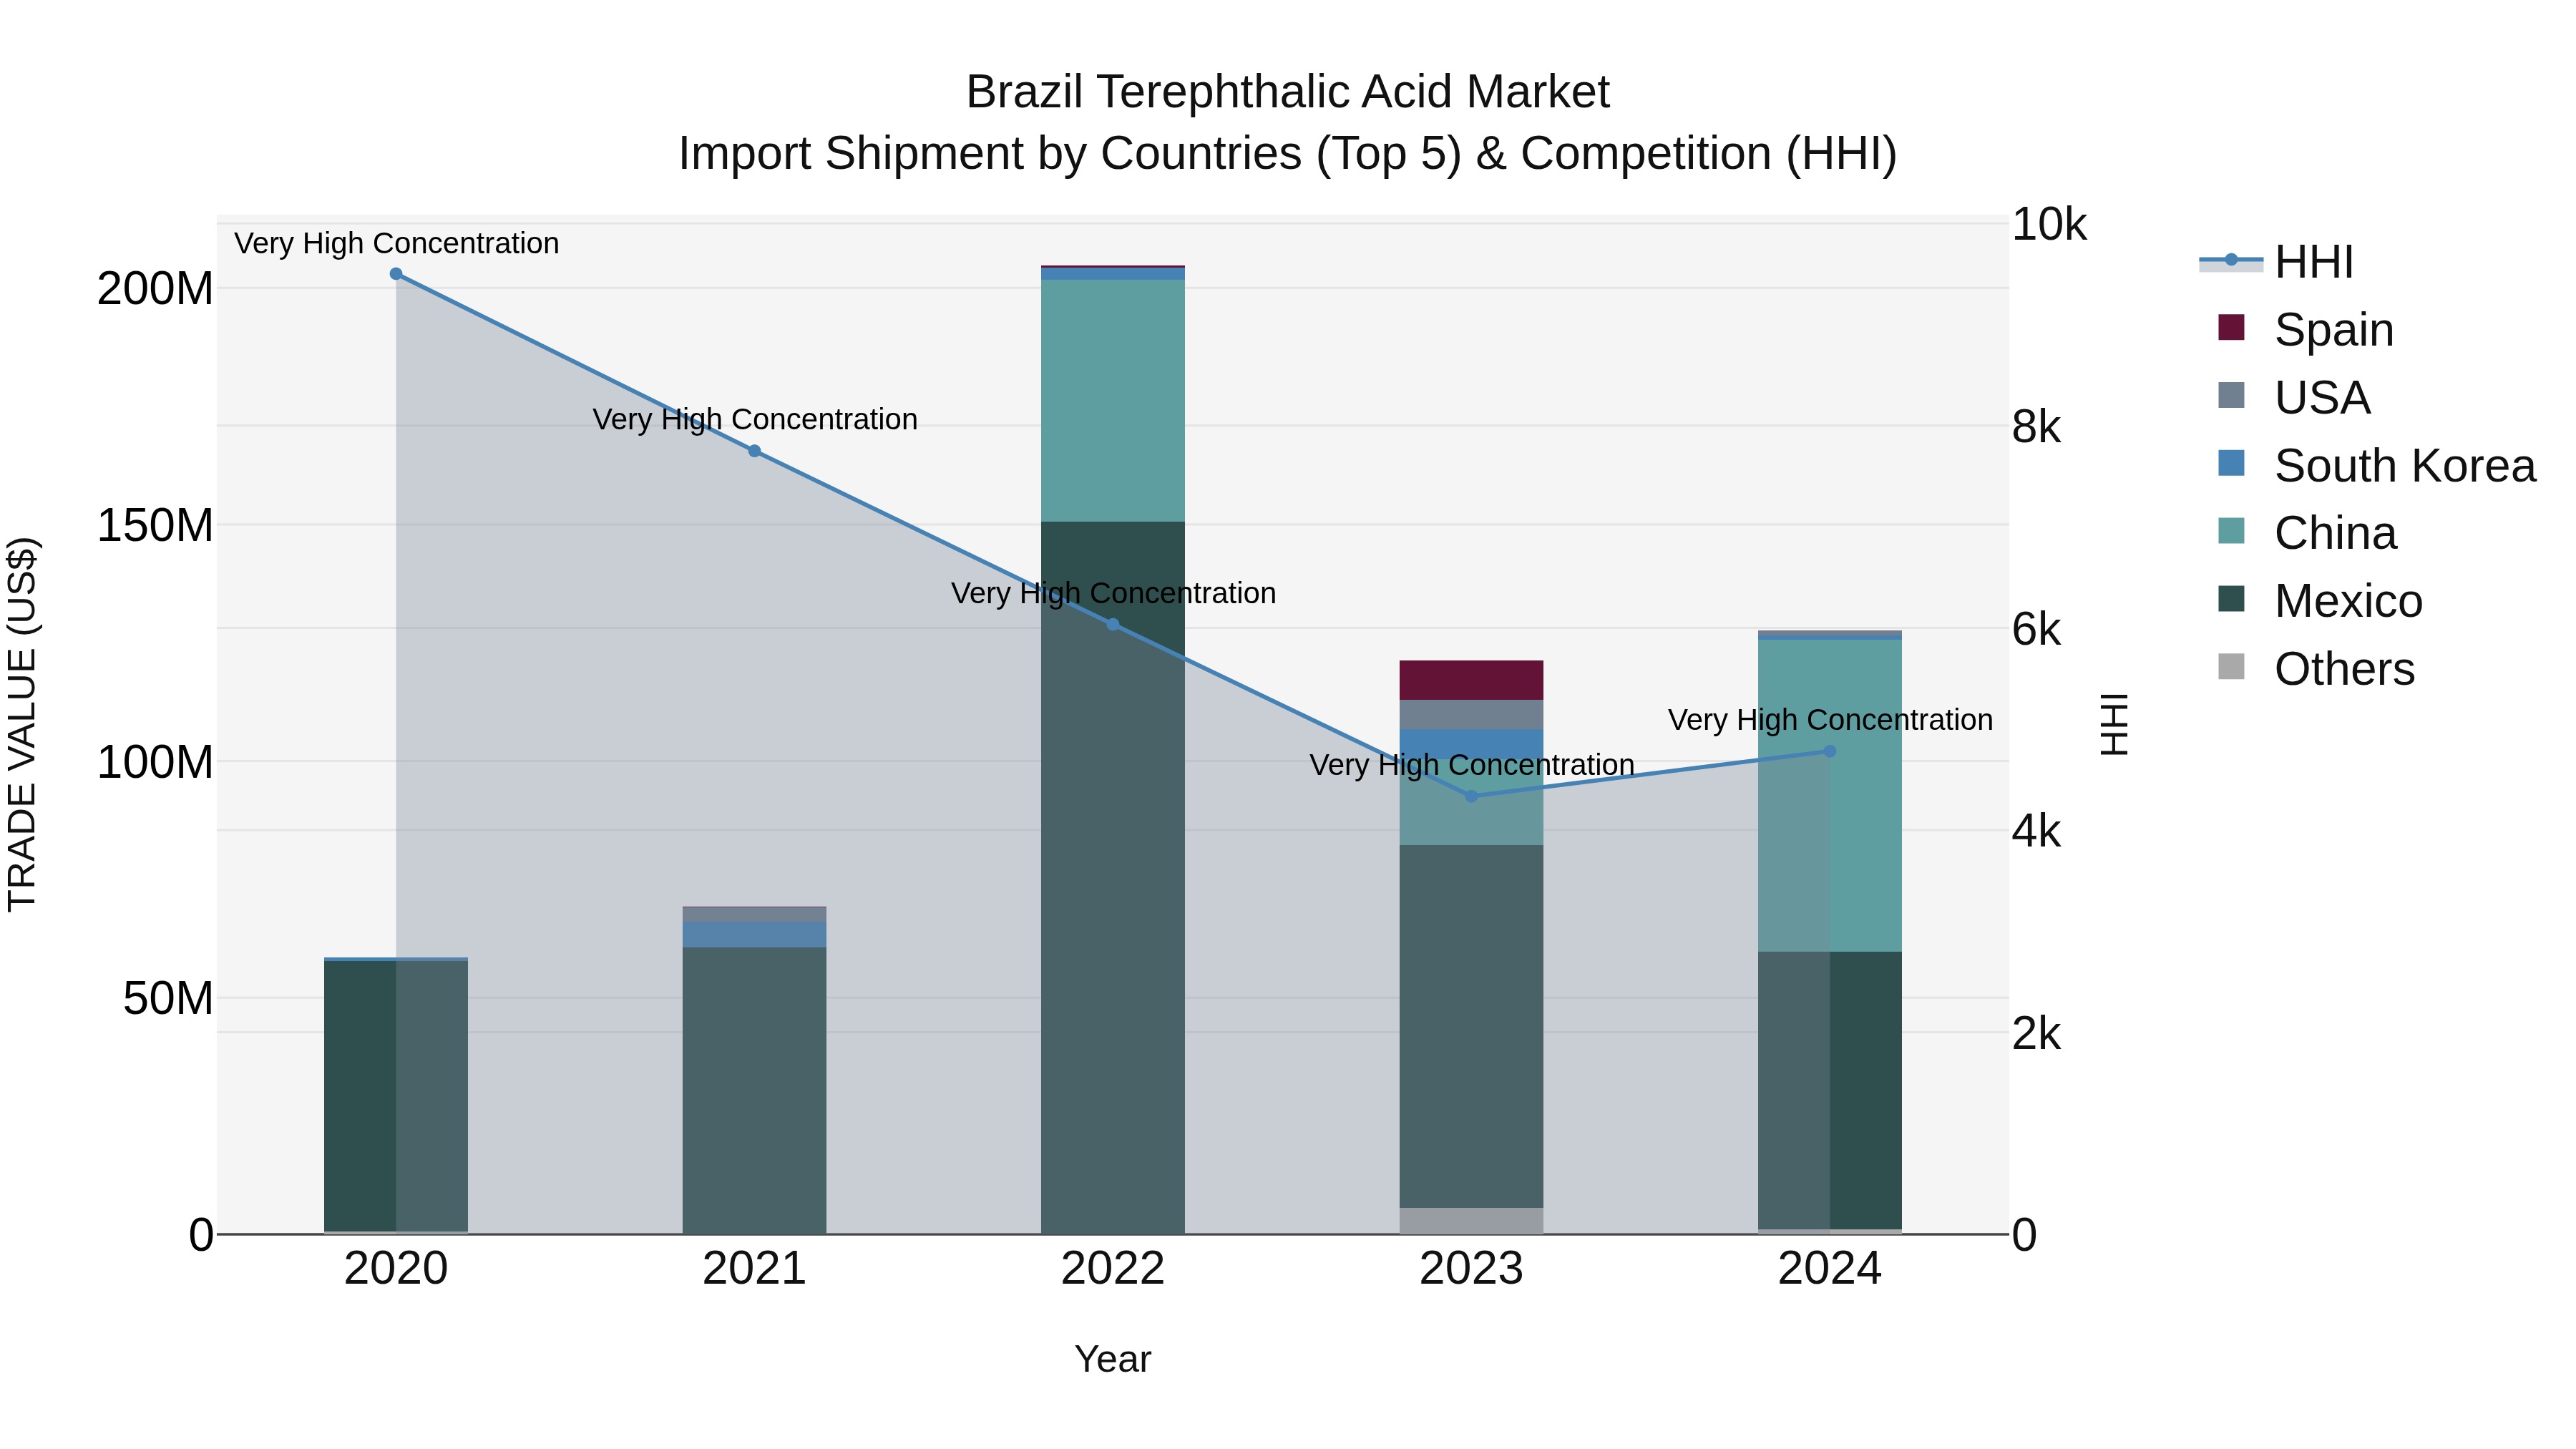
Brazil Terephthalic Acid Market Top 5 Importing Countries and Market Competition (HHI) Analysis
In 2024, Brazil continued to depend heavily on imports of terephthalic acid, with top exporters being China, Mexico, USA, Hong Kong, and South Korea. The market concentration, as measured by the HHI, remained high, indicating a dominant market presence by these countries. The compound annual growth rate (CAGR) from 2020 to 2024 was strong at 21.52%, with a notable growth rate of 5.28% from 2023 to 2024. These figures suggest a sustained demand for terephthalic acid in Brazil, driven by various factors influencing the market dynamics.
Brazil Terephthalic Acid Market Overview
Terephthalic acid, a key intermediate in polyester production, is influenced by trends in textiles, packaging, and plastics industries. Sustainability concerns and recycling initiatives shape the market`s trajectory.
Drivers of the market
The terephthalic acid market in Brazil is closely linked to the polyester industry, including PET resin production for packaging and textile fibers. Economic factors such as GDP growth, industrial investments, and infrastructure development influence market dynamics. Technological advancements in terephthalic acid production and sustainability initiatives shape market trends.
Challenges of the market
Challenges in Brazil terephthalic acid market include volatile raw material prices, environmental regulations, and competition from alternative materials, driving the need for technological advancements and market diversification strategies.
Government Policy of the market
The Brazil government implements regulations to oversee the production, importation, and use of terephthalic acid, a key chemical compound used in various industries, including textiles, packaging, and automotive. Regulatory measures aim to ensure product quality, environmental sustainability, and compliance with safety standards to support industry growth and competitiveness in domestic and international markets.
Key Highlights of the Report:
- Brazil Terephthalic Acid Market Outlook
- Market Size of Brazil Terephthalic Acid Market, 2021
- Forecast of Brazil Terephthalic Acid Market, 2028
- Historical Data and Forecast of Brazil Terephthalic Acid Revenues & Volume for the Period 2018 - 2028
- Brazil Terephthalic Acid Market Trend Evolution
- Brazil Terephthalic Acid Market Drivers and Challenges
- Brazil Terephthalic Acid Price Trends
- Brazil Terephthalic Acid Porter's Five Forces
- Brazil Terephthalic Acid Industry Life Cycle
- Historical Data and Forecast of Brazil Terephthalic Acid Market Revenues & Volume By Types for the Period 2018 - 2028
- Historical Data and Forecast of Brazil Terephthalic Acid Market Revenues & Volume By Amoco Process for the Period 2018 - 2028
- Historical Data and Forecast of Brazil Terephthalic Acid Market Revenues & Volume By Cooxidation for the Period 2018 - 2028
- Historical Data and Forecast of Brazil Terephthalic Acid Market Revenues & Volume By Multistage Oxidation for the Period 2018 - 2028
- Historical Data and Forecast of Brazil Terephthalic Acid Market Revenues & Volume By Henkel Process for the Period 2018 - 2028
- Historical Data and Forecast of Brazil Terephthalic Acid Market Revenues & Volume By Applications for the Period 2018 - 2028
- Historical Data and Forecast of Brazil Terephthalic Acid Market Revenues & Volume By Cyclohexanedimethanol Production for the Period 2018 - 2028
- Historical Data and Forecast of Brazil Terephthalic Acid Market Revenues & Volume By Plasticisers for the Period 2018 - 2028
- Historical Data and Forecast of Brazil Terephthalic Acid Market Revenues & Volume By Liquid Crystal Polymers for the Period 2018 - 2028
- Historical Data and Forecast of Brazil Terephthalic Acid Market Revenues & Volume By Textiles for the Period 2018 - 2028
- Historical Data and Forecast of Brazil Terephthalic Acid Market Revenues & Volume By Bottling And Packaging for the Period 2018 - 2028
- Brazil Terephthalic Acid Import Export Trade Statistics
- Market Opportunity Assessment By Types
- Market Opportunity Assessment By Applications
- Brazil Terephthalic Acid Top Companies Market Share
- Brazil Terephthalic Acid Competitive Benchmarking By Technical and Operational Parameters
- Brazil Terephthalic Acid Company Profiles
- Brazil Terephthalic Acid Key Strategic Recommendations
Frequently Asked Questions About the Market Study (FAQs):
6Wresearch actively monitors the Brazil Terephthalic Acid Market and publishes its comprehensive annual report, highlighting emerging trends, growth drivers, revenue analysis, and forecast outlook. Our insights help businesses to make data-backed strategic decisions with ongoing market dynamics. Our analysts track relevent industries related to the Brazil Terephthalic Acid Market, allowing our clients with actionable intelligence and reliable forecasts tailored to emerging regional needs.
Yes, we provide customisation as per your requirements. To learn more, feel free to contact us on sales@6wresearch.com
1 Executive Summary |
2 Introduction |
2.1 Key Highlights of the Report |
2.2 Report Description |
2.3 Market Scope & Segmentation |
2.4 Research Methodology |
2.5 Assumptions |
3 Brazil Terephthalic Acid Market Overview |
3.1 Brazil Country Macro Economic Indicators |
3.2 Brazil Terephthalic Acid Market Revenues & Volume, 2021 & 2028F |
3.3 Brazil Terephthalic Acid Market - Industry Life Cycle |
3.4 Brazil Terephthalic Acid Market - Porter's Five Forces |
3.5 Brazil Terephthalic Acid Market Revenues & Volume Share, By Types, 2021 & 2028F |
3.6 Brazil Terephthalic Acid Market Revenues & Volume Share, By Applications, 2021 & 2028F |
4 Brazil Terephthalic Acid Market Dynamics |
4.1 Impact Analysis |
4.2 Market Drivers |
4.2.1 Growing demand for PET (polyethylene terephthalate) products in various industries like packaging, textiles, and automotive. |
4.2.2 Increasing consumer awareness towards sustainable and eco-friendly products, leading to a shift towards PET products. |
4.2.3 Favorable government regulations promoting the use of PET products for packaging and reducing plastic waste. |
4.3 Market Restraints |
4.3.1 Fluctuating raw material prices, such as paraxylene, impacting the production cost of terephthalic acid. |
4.3.2 Intense competition from substitute products like bio-based polymers and recycled PET. |
4.3.3 Volatile global economic conditions affecting the export and import of terephthalic acid in Brazil. |
5 Brazil Terephthalic Acid Market Trends |
6 Brazil Terephthalic Acid Market, By Types |
6.1 Brazil Terephthalic Acid Market, By Types |
6.1.1 Overview and Analysis |
6.1.2 Brazil Terephthalic Acid Market Revenues & Volume, By Types, 2018 - 2028F |
6.1.3 Brazil Terephthalic Acid Market Revenues & Volume, By Amoco Process, 2018 - 2028F |
6.1.4 Brazil Terephthalic Acid Market Revenues & Volume, By Cooxidation, 2018 - 2028F |
6.1.5 Brazil Terephthalic Acid Market Revenues & Volume, By Multistage Oxidation, 2018 - 2028F |
6.1.6 Brazil Terephthalic Acid Market Revenues & Volume, By Henkel Process, 2018 - 2028F |
6.2 Brazil Terephthalic Acid Market, By Applications |
6.2.1 Overview and Analysis |
6.2.2 Brazil Terephthalic Acid Market Revenues & Volume, By Cyclohexanedimethanol Production, 2018 - 2028F |
6.2.3 Brazil Terephthalic Acid Market Revenues & Volume, By Plasticisers, 2018 - 2028F |
6.2.4 Brazil Terephthalic Acid Market Revenues & Volume, By Liquid Crystal Polymers, 2018 - 2028F |
6.2.5 Brazil Terephthalic Acid Market Revenues & Volume, By Textiles, 2018 - 2028F |
6.2.6 Brazil Terephthalic Acid Market Revenues & Volume, By Bottling And Packaging, 2018 - 2028F |
7 Brazil Terephthalic Acid Market Import-Export Trade Statistics |
7.1 Brazil Terephthalic Acid Market Export to Major Countries |
7.2 Brazil Terephthalic Acid Market Imports from Major Countries |
8 Brazil Terephthalic Acid Market Key Performance Indicators |
8.1 Capacity utilization rate of terephthalic acid production facilities in Brazil. |
8.2 Adoption rate of PET products in key end-use industries. |
8.3 Investment trends in research and development for PET product innovation. |
9 Brazil Terephthalic Acid Market - Opportunity Assessment |
9.1 Brazil Terephthalic Acid Market Opportunity Assessment, By Types, 2021 & 2028F |
9.2 Brazil Terephthalic Acid Market Opportunity Assessment, By Applications, 2021 & 2028F |
10 Brazil Terephthalic Acid Market - Competitive Landscape |
10.1 Brazil Terephthalic Acid Market Revenue Share, By Companies, 2021 |
10.2 Brazil Terephthalic Acid Market Competitive Benchmarking, By Operating and Technical Parameters |
11 Company Profiles |
12 Recommendations |
13 Disclaimer |
Global Go To Market Strategy - 2030
Export potential enables firms to identify high-growth global markets with greater confidence by combining advanced trade intelligence with a structured quantitative methodology. The framework analyzes emerging demand trends and country-level import patterns while integrating macroeconomic and trade datasets such as GDP and population forecasts, bilateral import–export flows, tariff structures, elasticity differentials between developed and developing economies, geographic distance, and import demand projections. Using weighted trade values from 2020–2024 as the base period to project country-to-country export potential for 2030, these inputs are operationalized through calculated drivers such as gravity model parameters, tariff impact factors, and projected GDP per-capita growth. Through an analysis of hidden potentials, demand hotspots, and market conditions that are most favorable to success, this method enables firms to focus on target countries, maximize returns, and global expansion with data, backed by accuracy.
By factoring in the projected importer demand gap that is currently unmet and could be potential opportunity, it identifies the potential for the Exporter (Country) among 190 countries, against the general trade analysis, which identifies the biggest importer or exporter.
To discover high-growth global markets and optimize your business strategy:
Click Here
Pricing
- Single User License$ 1,995
- Department License$ 2,400
- Site License$ 3,120
- Global License$ 3,795

Leadership Perspectives from Industry Events
Search
Thought Leadership and Analyst Meet


Our Clients
6WResearch In News
- India Air Conditioner Market Set for Strong Rebound in 2026 After Weather-Led Correction and GST-Driven Recovery: 6Wresearch
- ADAS in India: How Automatic Emergency Braking, Blind Spot Detection & Driver Monitoring are Transforming Road Safety
- Doha a strategic location for EV manufacturing hub: IPA Qatar
- Demand for luxury TVs surging in the GCC, says Samsung
- Empowering Growth: The Thriving Journey of Bangladesh’s Cable Industry
- Demand for luxury TVs surging in the GCC, says Samsung
Latest Reports
- Nicaragua RPG Gaming Market (2026-2032)
- New Zealand RPG Gaming Market (2026-2032)
- Netherlands RPG Gaming Market (2026-2032)
- Nauru RPG Gaming Market (2026-2032)
- Namibia RPG Gaming Market (2026-2032)
- Mozambique RPG Gaming Market (2026-2032)
- Montenegro RPG Gaming Market (2026-2032)
- Mongolia RPG Gaming Market (2026-2032)
- Monaco RPG Gaming Market (2026-2032)
- Micronesia RPG Gaming Market (2026-2032)
Industry Events and Analyst Meet

HIMTEX 2026

India Refining Summit 2026

India EV Show 2026

EV tech India Expo 2026

Auto Tech Asia 2026
Whitepaper
- Middle East & Africa Commercial Security Market Click here to view more.
- Middle East & Africa Fire Safety Systems & Equipment Market Click here to view more.
- GCC Drone Market Click here to view more.
- Middle East Lighting Fixture Market Click here to view more.
- GCC Physical & Perimeter Security Market Click here to view more.